Managing agglomeration development in the face of multiple competing goals: challenges and solutions

Author: Okrepilov V.V., Korshunov I.V.
Journal: Economic and Social Changes: Facts, Trends, Forecast @volnc-esc-en
Section: Public administration
Article in issue: 1 т.17, 2024.
Free access
The emergence of agglomerations as new objects in the public administration system makes it necessary to create and define a set of indicators that will assess their economic growth and development. This management problem justifies the relevance of the study, the aim of which is to assess the information and analytical sufficiency and quality of indicators recommended for use in the elaboration of longterm plans for the socio-economic development of large and largest agglomerations and determined by documents of strategic planning at the federal level, using the example of the Saint Petersburg agglomeration. The methodological basis of the research includes the publications of Russian and foreign scientists and experts on the problem of spatial development and management of urban agglomerations; the current legal framework regulating certain aspects of the national spatial development policy; official statistics data. Based on the results obtained during the study, the following conclusions are drawn: 1) indicators for assessing the economic growth of agglomerations, which are unambiguously defined by federal documents of strategic spatial planning, can be accepted as minimally sufficient and exclusively for the implementation of an extremely concise version of express analysis; 2) the process of institutionalization of urban agglomerations management has not been completed; at the current stage, we are dealing with a “soft” form of both requirements for determining the composition and boundaries of agglomerations and rules for the formation of long-term agglomerations development programs; 3) it is necessary to develop existing experience in creating strategic plans for the development of urban agglomerations. The new methodology should combine modern spatial development concepts that help to find a compromise between state control and the potential of agglomeration management; to overcome the problem of fragmentation of management and the blurring of the institutional structure of agglomeration management; to use the tools of quality economics (metrology, standardization and quality management) in the development of strategies and long-term plans for the development of urban agglomerations.
Urban agglomerations, strategic planning, spatial development, planning indicators, management quality, planning quality, quality economics, saint petersburg agglomeration
Short address: https://sciup.org/147243334
IDR: 147243334 | UDC: 332.02 | DOI: 10.15838/esc.2024.1.91.3
Text of the scientific article Managing agglomeration development in the face of multiple competing goals: challenges and solutions
The research was carried out at the expense of Russian Science Foundation grant 23-28-10090, and a grant from the St. Petersburg Science Foundation with the support of the Government of Saint Petersburg, at the Institute
The key concept of the current Spatial Development Strategy of the Russian Federation up to 20251 (hereinafter referred to as the Strategy) is the policy of polarized development. The document defines the priorities of spatial development that represent agglomerations as drivers of territorial growth; priorities for the development of the infrastructure framework and the boundaries of macroregions. The emergence of agglomerations as new objects in the public administration system necessitates the development and definition of a set of indicators that will measure economic growth and development of agglomerations, which stimulates research in the field of substantiation of an agglomeration management model (Report on the for Regional Economic Studies RAS.
Current State.., 2021) and in the field of formation of assessment approaches (Rastvortseva, Manaeva, 2023; Fauzer, Smirnova, 2023). In modern times characterized by shifts in the social structure and in the economy, and amid the geopolitical crisis, these issues are extremely relevant for Russia and no less relevant abroad (Castan Broto et al., 2019; Bell et al., 2020; Granqvist et al., 2020). This substantiates the importance of “the quality of management, and improvements in the quality of planning” (Okrepilov, 2021a). The management process is critically dependent on information – decisions are made on the basis of the information received (including planning), and the use of components of the quality economy – standardization, metrology, quality management – increases the efficiency and quality of planning, which is confirmed by the experience of creating strategic documents.
This management problem substantiates the relevance of our study, the aim of which is to assess the information and analytical sufficiency and quality of indicators recommended for use in the development of long-term plans for the socioeconomic development of large and largest agglomerations and determined by documents of strategic planning at the federal level, using the example of the Saint Petersburg agglomeration. Thus, the object of the study is the Saint Petersburg agglomeration, which belongs to the category of the largest urban agglomerations2.
To achieve the goal, the following tasks were set and solved in the study:
-
1) indicators for assessing the economic growth of agglomerations were established, and they are clearly defined by federal documents of strategic spatial planning;
-
2) a retrospective analysis of the state of the socio-economic system of the Saint Petersburg agglomeration was carried out on the basis of indicators unambiguously determined by documents of strategic planning at the federal level;
-
3) the main trends of spatial and socioeconomic development of the Saint Petersburg agglomeration were revealed.
Based on the results obtained in the course of addressing the research tasks, we drew conclusions about the sufficiency of the recommended set of indicators for determining the main parameters of the economic growth of the agglomeration in order to make strategic decisions and understand the challenges related to the development of the agglomeration.
Research methodology and data
Methodological basis of the research includes publications of Russian and foreign scientists and experts on spatial development and management of urban agglomerations; the current legal framework regulating certain aspects of the national spatial development policy; official statistics data.
When starting to discuss the research methodology, it is necessary to take into account the following fact, which adds complexity in the field of urban agglomerations development management. This is the lack of legislative consolidation of the concept of urban agglomeration, criteria for classifying territories as such, and methods for determining the boundaries of agglomerations. The existing “Methodological recommendations for the development of long-term plans for the socioeconomic development of large and largest urban agglomerations”3 (hereinafter – Methodological Recommendations), discussed below, provide only recommendations for determining the composition of large and largest urban agglomerations, offering a list of municipalities recommended for inclusion in their composition. As a result, according to experts from the Institute for Urban Economics, based on the results of their research, today there is a situation when “the idea of the composition of agglomerations existing in constituent entities of the Russian Federation and reflected, among other things, in current planning documents, in most cases diverges, and sometimes radically, with the composition proposed by the Methodological Recommendations”4. We should note that with regard to the Saint Petersburg agglomeration, there is a convergence of opinions on its composition both at the federal level and at the level of constituent entity of the Russian Federation. The same territories are defined by both Methodological Recommendations and the law of the Leningrad Region5.
As noted in L.V. Melnikova’s study, which presents an analysis of the evolution of “ideas about efficiency and equality in the spatial development of the economy” (Melnikova, 2022) for the period from the 1990s to the present, a model of polarized development based on “the idea of the fundamental role of agglomerations in economic growth” (Melnikova, 2022), It came to the fore in Russian regional policy in the second decade of the 21st century. In 2017, “further development of the urbanization process, in particular the development of large urban agglomerations”, was identified as one of the results of the state policy of regional development of the Russian Federation, which must be achieved by 20256. The national goals and strategic objectives for the development of the Russian Federation worked out in 2018, first until 20247, and then until 20308, and the “Unified plan for achieving the national development goals of the Russian Federation for the period through to 2024 and for the planning period through to 2030”9 identified territorial differences in living standards as one of the challenges, and “the emergence and development of new centers of economic growth” was designated as a response to this challenge.
According to the abovementioned plan, strengthening interregional ties should ensure improved connectivity of economic growth centers among themselves and create incentives for additional development of the centers themselves and the territories between them. This should lead to an increase in the quality of life throughout the country, not through the redistribution of resources, but through the economic development of territories, which increases the importance of managing centers of economic growth. At the same time, the document notes its role – to form “an upper-level system of indicators and the main tasks (factors and a description of the required actions within them)”10. This decision was substantiated by the intention to ensure the operational flexibility of a mechanism for managing the achievement of the national development goals. As a result, the details of tasks, activities, tools, and indicators are transferred to national projects, state programs, regional projects and state programs of the regions. The argument is to improve management efficiency and ensure a direct link between programs and work to achieve the national development goals.
As a result, the task of forming a system of indicators and a methodology for their formation, which are critical aspects of the agglomerations management system (centers of economic growth) is transferred to the level of specific projects and programs that will be planned for implementation in specific territories, where, in fact, agglomerations are located. Given the totality of national goals, the variety of problems and the difference in the level of their priority within the boundaries of a particular territory (Korshunov, 2023), as well as the fact that agglomeration itself as a national goal is not defined by these documents, we should obviously assume that there are several options for the development of events in terms of building the contour of the agglomeration management system.
Option 1. The wide variability of the set of indicators for the management of agglomerations, which is due to:
-
1) the presence of a significant number of management entities (responsible for the implementation of the program / project conditioned by the national development goals), since it is highly likely that not a single program / project will be implemented in a particular region, but some of them;
-
2) the presence of a large set of national projects, state programs, regional projects and state programs of the regions that will be implemented in the territory;
-
3) different levels of attention to agglomeration processes and individual aspects of this process, different approaches explained by the specifics of projects/programs, the level at which they are developed (state/regional/municipal), which will lead to a focus on a certain range of tasks and measurable indicators corresponding to these tasks.
Option 2. A standard set of indicators recommended (or mandatory) for use at all levels of management of agglomeration processes, fixed in methodological guidelines prepared at the federal level. The preparation of methodological guidelines will require the federal level of management to choose a specific theoretical concept on which the methodology determining these indicators will be built and to understand the institutional structure of agglomerations management.
Option 3 represents a combination of options 1 and 2: it is the use of a standard set of indicators and indicators extracted from systems created within the framework of program and project management for achieving the national development goals.
In this regard, we should note the following. The formation of an urban agglomeration management system is of great interest among Russian experts; nevertheless, the authors avoid the issue concerning the system of indicators on the basis of which management decisions should be made. Within the framework of the problem we are discussing, an article by Yu.V. Pavlov, E.N. Koroleva and N.N. Evdokimov (Pavlov et al., 2019) is of interest. It is noteworthy that at the level of representation of the synthesized urban agglomeration management system, obtained on the basis of the analysis of 144 studies, Table 7 of the above study, revealing the elements of the subsystem of direct and feedback links of the management system, provides such an element as state (including legal) regulation of the agglomeration development, within which such characteristics as indicators for management purposes are formalized. But in the authors’ multilevel decomposition of the agglomeration management system proposed by the researchers, this element is excluded from the discussion in relation to all considered models of urban agglomeration management (contractual, two-level municipal, one-level, regional).
While agreeing with the researchers that the complexity of the management object and the features of the management model require a balanced approach to determining the indicators used for management purposes, we believe that avoiding discussion of this significant element of the agglomeration management system is not a constructive step.
The objective existence of the problem is indicated not only by the analysis of the “upperlevel” strategic planning documents carried out above and the results of research by scientists and experts; this also follows from the analysis of documents on the state strategic planning of Russia’s spatial development.
The Strategy adopted in 2019, defining the policy of developing promising centers of economic growth as one of four priorities, simultaneously focuses on stimulating agglomeration effects not only in promising centers, but also on the periphery (these are the other two priorities of the four stated in the Strategy), which is defined, first, as “territories with a low level of socio-economic development, having their own potential for economic growth, as well as territories with low population density and a forecasted increase in economic potential”; second, as “stronghold settlements”; third, as “border municipalities”. The fourth priority is linking the center and the periphery, which is implemented through ensuring transport accessibility, developing communication and information infrastructure. In this regard, we think that a well-founded opinion was voiced by those researchers who, even at the stage of discussing the Strategy, argued that it indicates the state’s refusal to regulate the spatial organization of the economy and “the transition from integrated territorial development planning to infrastructure planning” (Musinova, 2019). In more recent studies, attention has also been drawn to the role of infrastructure planning, in particular to the fact that in the strategies of territories that fall within the zone of implementation of federal infrastructure projects, the manifestation of certain provisions determined by the Strategy is noted most often (Zhikharevich, 2021).
A large number of growth centers and their dispersion across the territory of the Russian Federation are recorded in Appendix 3 to the Strategy. Such an impressive number of management facilities with different characteristics makes it necessary to have a sound system of indicators used to determine the main parameters of economic growth of the agglomeration in order to make strategic management decisions.
The documents reviewed earlier pointed to the only way proposed by the legislator – the detailing of indicators in specific plans, programs, projects and strategies. This path is not easy and is in the focus of experts’ attention. On the one hand, it reflects the position of the central government on how it plans to make agglomerations more attractive and competitive. There are many difficulties in extracting the potential of agglomeration management through the implementation of state control (Tolkki, Haveri, 2020). On the other hand, this solution creates a problem that is widely discussed today in foreign studies by independent experts (Dixon et al., 2023; Kitchin, Moore-Cherry, 2020) and at the UN sites11; the problem is called fragmented governance, which creates great difficulties for modern territorial planning and management.
Nevertheless, there is every reason to carefully study the documents issued in line with the development of the Strategy so as to identify methodological recommendations and indicators recommended for use in the management of large and largest urban agglomerations.
The first document in this category is the “Plan for the implementation of the Spatial Development Strategy for the period up to 2025”12 (hereinafter referred to as the Plan). Indeed, paragraph 73 of the Plan provides for the “development of a procedure for coordinating, approving and monitoring the implementation of long-term plans for the socio-economic development of large and largest urban agglomerations; it was completed almost a year late (in May 2022 instead of June 2021), but this document13 discusses procedures rather than indicators. At the same time Paragraph 75 of the Plan provides for the “elaboration of at least 20 long-term plans for the socio-economic development of large and largest urban agglomerations”. Since the deadline for the event has been postponed from December 2021 to December 2023, it can be assumed that this is due to a delay in the preparation of a document regulating the process of developing plans. And this is true, the Methodological Recommendations that have already been mentioned above were prepared only in September 2023.
Unfortunately, the problem lies in the fact that the document does not provide certainty as to what constitutes a system of indicators established by strategic planning documents at the federal level for analyzing the state of socio-economic development of an agglomeration in order to prepare long-term plans for the socio-economic development of agglomerations, as well as the methodology substantiating them. In particular, Paragraph 1.7 recommends that when developing a long-term plan, it is necessary to use the calculation form “Preparation of a long-term plan for the socio-economic development of large and largest urban agglomerations”, which is not attached to the document. It is indicated that the document (calculation form) “is posted on the website of the Ministry of Economic Development of the Russian Federation in the section “Regulatory support for strategic planning” strateg_planirovanie/normativnoe_obespechenie_ strategicheskogo_planirovaniya/)”. But when trying to access the specified link (the last date of access is November 10, 2023), the document is not found.
Of great importance for our analysis is Section 3 of the Methodological Recommendations, which is called “Analysis of socio-economic development and forecasting of urban agglomeration development”. Describing the analysis algorithm, this section was designed to form a clear understanding of the methodology and composition of the indicators that will be included in the system substantiating the management decision. The following algorithm is proposed:
-
1) conduct an analysis of the current and forecasted socio-economic development of the urban agglomeration in order to identify gaps and deficits and, based on the results of the analysis, set the values of targets that are to be achieved with the help of the Long-Term Plan (Paragraph 3.1);
-
2) identify gaps and deficits, analyze basic indicators of the socio-economic development of the urban agglomeration (current values and growth rates over the past five years) (Paragraph 3.2). It is also stated here that the list of basic indicators is contained in the section “Basic indicators of SED” in the calculation form, which can be reached via the link given in Paragraph 1.7 to an online source. But, as noted above, the calculation form is not found at this address.
Further, Paragraph 3.2 provides a list of indicators (four in total) defined by the Ministry of Economic Development of the Russian Federation as characterizing economic growth and recommended for analyzing socio-economic development and forecasting the development of urban agglomeration. The indicators are as follows:
-
– volume of shipped goods of our own production, own completed works and services;
-
– volume of investments in fixed assets;
-
– average number of employees of organizations;
-
– average monthly wage of employees of organizations.
Thus, the conclusion is substantiated that most likely the system of indicators characterizing the economic growth of agglomerations is a wide list, which to some extent will coincide with the indicators generated within the framework of the management of national projects and programs. Nevertheless, the above four indicators are clearly and unambiguously defined precisely as characterizing the economic growth of the agglomeration; therefore, we will use them when conducting a retrospective analysis of the state of the socio-economic system of the Saint Petersburg agglomeration.
Another conclusion is that, presumably, since there is no clear indication of a certain methodology for the formation of indicators and methods for calculating them, then the entities carrying out planning have some degree of freedom to choose the methodology and the formation of indicators. The most important thing is to ensure their consistency with the “upper-level system of indicators” contained in the national development goals of the Russian Federation.
Let us pay attention to an interesting point that was revealed when comparing the indicators unambiguously defined in the Methodological Recommendations and the indicators established by the national development goals of the Russian Federation (Tab. 1).
The comparison of indicators shows that the economic growth of the agglomeration should primarily contribute to the achievement of the following national goals: “Decent, effective work, successful entrepreneurship” and “Preservation of the population, people’s health and well-being”, which fully complies with the logic of developing measures to respond to a major challenge defined as “territorial differences in living standards”, which was the reason for the adoption of a polarized development strategy representing agglomerations as growth drivers.
Next, let us analyze four indicators characterizing the economic growth of the agglomeration, given in the Methodological Recommendations, in order to form a substantiated judgment about the essence of the observed trends in the field of socioeconomic development of the agglomeration.
Table 1. Correlation of indicators characterizing the economic growth of agglomerations with the national development goals
|
No. |
Indicator defined by Order 669, dated September 26, 2023 |
Target indicator in accordance with Decree 474, dated July 21, 2020 |
|
1 |
Average number of employees of organizations |
Increase in the number of people employed in the field of small and medium-sized enterprises, including individual entrepreneurs and the self-employed, to 25 million people* |
|
2 |
Average monthly wage of employees of organizations |
Ensuring the rate of sustainable income growth of the population not lower than inflation*; reduction of the poverty level by half compared to the indicator of 2017** |
|
3 |
Volume of investments in fixed assets |
Real growth of investments in fixed assets at least by 70% compared to 2020* |
|
4 |
Volume of shipped goods of own production, own completed works and services |
Ensuring the growth rate of the country’s gross regional product above the global average while maintaining macroeconomic stability* |
|
* The indicator refers to the national goal “Decent, effective work, successful entrepreneurship”. ** The indicator refers to the national goal “Preservation of the population, people’s health and well-being”. Source: own compilation. |
||
Results of the study
The Saint Petersburg agglomeration covers an area of 17.1 square kilometers, it includes the entire territory of Saint Petersburg and 19% of the territory of the Leningrad Region. These are the following municipal districts: Vsevolozhsky, Lomonosovsky, Tosnensky, Gatchinsky and Kirovsky14. The location of the Saint Petersburg agglomeration on the territory of the Leningrad Region is shown in Figure 1.
Production. We should note that although the Methodological Recommendations indicate that the proposed indicators are calculated by Rosstat at the municipal level, it is difficult to find them in the public domain (a typical situation is that the general data are presented, but the data in the context of branches of the municipal economy are absent) or the presentation is carried out in a format not comparable to the format of the data defined for statistics of the constituent entity of the Russian Federation (Saint Petersburg). This primarily applies to indicators characterizing economic activity, in particular, the volume of goods shipped. In this regard, gross regional product (hereinafter referred to as GRP) was taken as an indicator characterizing the volume of production, presented, among other things, with details by type of economic activity of the region.
For the same reason, the GRP indicator for the Leningrad Region was used to assess economic trends emerging within the boundaries of the agglomeration in the part formed by municipal districts included in the Leningrad Region. It was assumed that the trend observed for the region as a whole, for the most part, will be typical for municipal districts.
Figure 1. Saint Petersburg agglomeration on the territory of the Leningrad Region
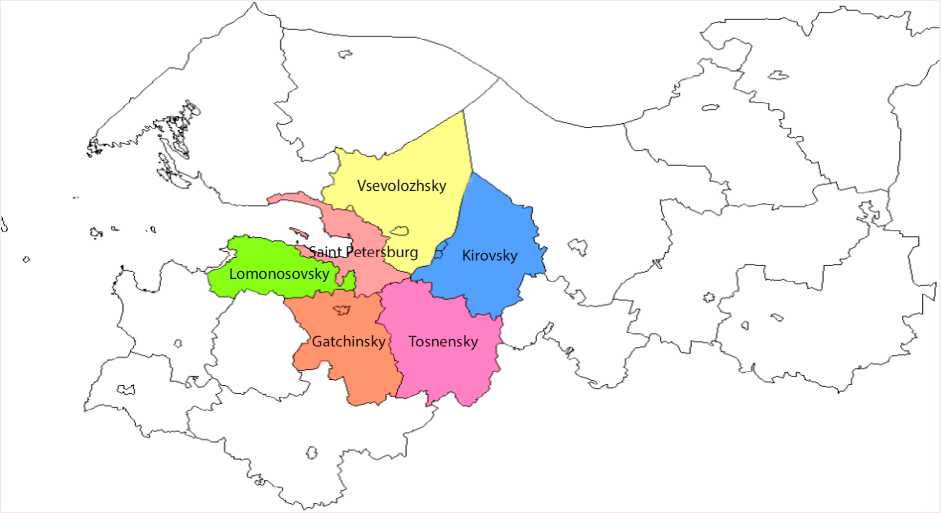
Compiled according to: Unified State Register of Soil Resources of Russia. Available at: (accessed: October 19, 2023).
The analysis of statistical data leads to the following conclusions.
First, the main types of economic activity (hereinafter referred to as TEA), determined by the share of contribution of TEA to GRP, for Saint Petersburg in 2006–2021 are TEA “Wholesale and retail trade; repair of motor vehicles, motorcycles, household goods and personal items” (22% in GRP), TEA “Real estate transactions, rent, and provision of services” (18% in GRP), TEA “Manufacturing industries” (17% in GRP) and TEA “Transport and communications” (13% in GRP). The average annual GRP growth rate in Saint Petersburg amounted to 9.44% over the period under consideration (Fig. 2).
The emerging industry vector is in clear contradiction with the “industry vector for the implementation of tasks set for the industry of Saint Petersburg” (Okrepilov, 2021b) in the Industrial
Policy Concept developed by the Committee on Industrial Policy, Innovation and Trade of Saint Petersburg. The trend of sustainable economic growth based on the industries that form the basis of the innovative development of the city (radioelectronic industry, transport engineering, including shipbuilding, energy engineering), as well as the most high-tech industries (automotive, pharmaceutical, food) has not yet been developed.
Second, the main economic activities of the Leningrad Region in 2006–2021 were TEA “Manufacturing industries” (28% in GRP), TEA “Transport and communications” (14% in GRP), TEA “Construction” (12% in GRP) and TEA “Wholesale and retail trade; repair of motor vehicles, motorcycles, household goods and personal items” (11% in GRP). The average annual GRP growth rate in the Leningrad Region was 4.33% over the period under consideration (Fig. 3) .
Figure 2. Dynamics and structure of the gross regional product of Saint Petersburg for 2006–2021, billion rubles in 2010 prices
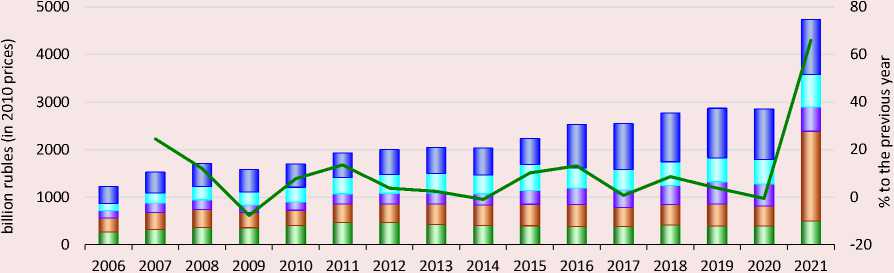
■ ■ Other TEAs (left axis)
■ _ _ ■ Real estate transactions, rent, and provision of services (left axis)
L J Transport and communications (left axis)
I ■ Wholesale and retail trade; repair of motor vehicles, motorcycles, household goods and personal items (left axis)
-
■ ■ Manufacturing industries (left axis)
^^^^^^^^M GRP growth rate, % (right axis)
Compiled according to: Gross regional product in basic prices (OKVED-2007). Available at: indicator/33379 (accessed: October 19, 2023); Gross regional product in basic prices (OKVED 2). Available at: https://www. (accessed: October 19, 2023).
Figure 3. Dynamics and structure of gross regional product of the Leningrad Region for 2006–2021, billion rubles in 2010 prices
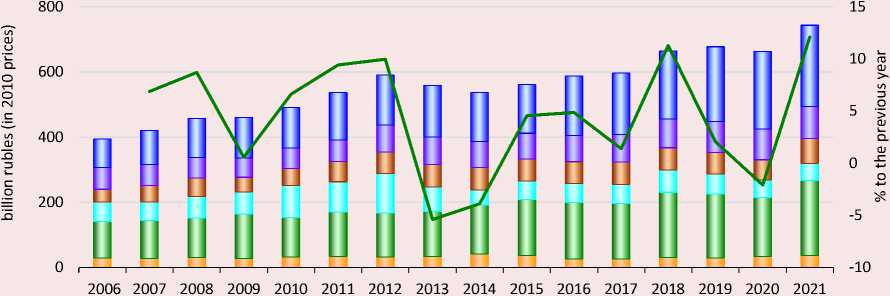
■ ■ Other TEAs (left axis)
■ ■ Transport and communications (left axis)
-
■ ■ Wholesale and retail trade; repair of motor vehicles, motorcycles, household goods and personal items (left axis)
-
■ ■ Construction (left axis)
-
■ _ _ ■ Manufacturing industries (left axis)
-
■ __ ■ Agriculture, forestry, hunting, fishing and fish farming (left axis)
^^^^^^^^м GRP growth rate, % (right axis)
Compiled according to: Gross regional product in basic prices (OKVED-2007). Available at: indicator/33379 (accessed: October 19, 2023); Gross regional product in basic prices (OKVED 2). Available at: https://www. (accessed: October 19, 2023).
It is noteworthy that, although there is no complete coincidence of the structure of those types of economic activity that form the economy of the territories included in the agglomeration, at the same time, the share of the contribution of three TEAs, which are simultaneously significant for Saint Petersburg and for the municipal districts of the Leningrad Region included in the agglomeration, practically coincides and amounts to 52% and 53%, respectively (Tab. 2). It is also worth noting that TEA “Construction” is among the top four for the Leningrad Region and is absent from the topo four for Saint Petersburg, for which the four foreign economic activities that determine the main contribution to GRP, include TEA “Real estate transactions, rent, and provision of services”.
Table 2. Comparison of foreign economic activity by share of contribution to GRP: Saint Petersburg and the Leningrad Region
|
Saint Petersburg |
Leningrad Region |
||
|
TEA |
% to GRP |
TEA |
% to GRP |
|
Wholesale and retail trade; repair of motor vehicles, motorcycles, household goods and personal items |
22 |
Manufacturing industries |
28 |
|
Real estate transactions, rent, and provision of services |
18 |
Transport and communications |
14 |
|
Manufacturing industries |
17 |
Construction |
12 |
|
Transport and communications |
13 |
Wholesale and retail trade; repair of motor vehicles, motorcycles, household goods and personal items |
11 |
|
Source: own compilation. |
|||
Figure 4. Dynamics of GRP in Saint Petersburg and the Leningrad Region for 2006–2021, billion rubles in 2010 prices
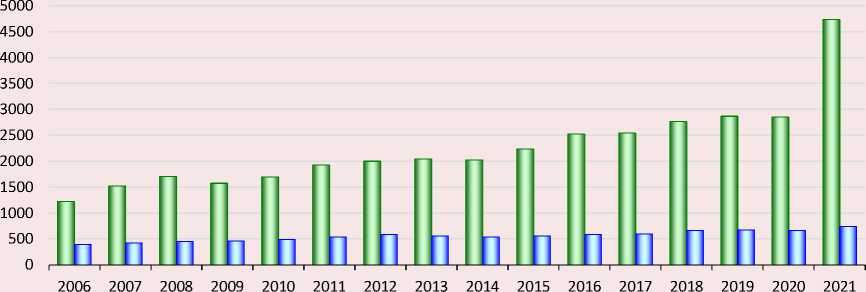
□ Saint Petersburg □ Leningrad Region
Compiled according to: Gross regional product in basic prices (OKVED-2007). Available at: indicator/33379 (accessed: October 19, 2023); Gross regional product in basic prices (OKVED 2). Available at: https://www. (accessed: October 19, 2023).
Here it is necessary to take into account how GRP indicators for Saint Petersburg and for the Leningrad Region relate to each other (Fig. 4) . Despite the fact that until 2021, the GRP of the region was about four times lower than the GRP of the city, and in 2021, as a result of the abrupt growth of the GRP of Saint Petersburg, this gap approached seven times, on average, the GRP of Saint Petersburg grew at a rate twice the growth rate of the GRP of the Leningrad Region, while the volume of GRP of Saint Petersburg is many times higher than the volume of GRP of the Leningrad Region.
Investments. If we consider the cost indicators of the volume of investments in fixed assets carried out by organizations located in the territory that makes up the Saint Petersburg agglomeration (Fig. 5) , then it can be assumed that Saint Petersburg is a driver of economic development.
But the analysis of the dynamics of the share of investments in relation to GRP urges us to consider what could cause a decrease in business investment activity in the territory of Saint Petersburg. In particular, the following fact was revealed: in 2008– 2021, the share of investments in fixed assets in GRP of Saint Petersburg decreased from more than 20% to 7%. At the same time, the share of investments in fixed assets in municipal districts, which are also part of the Saint Petersburg agglomeration, in the GRP of the Leningrad Region, although it had a downward trend, did not decrease as rapidly as in the city, and in 2021 it almost equaled the share of Saint Petersburg (decreased from 10% to 7%).
As noted earlier, GRP growth rate in the Leningrad Region was two times lower than that of Saint Petersburg. As a result, it turns out that despite the high growth of GRP in Saint Petersburg, the business did not show investment activity, but invested approximately equal amounts annually in the city’s economy, which by 2021 led to a more than twofold decrease in the share of investments in fixed assets relative to GRP. At the same time, for the part of the agglomeration that includes municipal districts of the Leningrad Region, a different trend was observed – a slight increase in GRP corresponded to sluggish investment activity,
Figure 5. Investments in fixed assets of the Saint Petersburg agglomeration
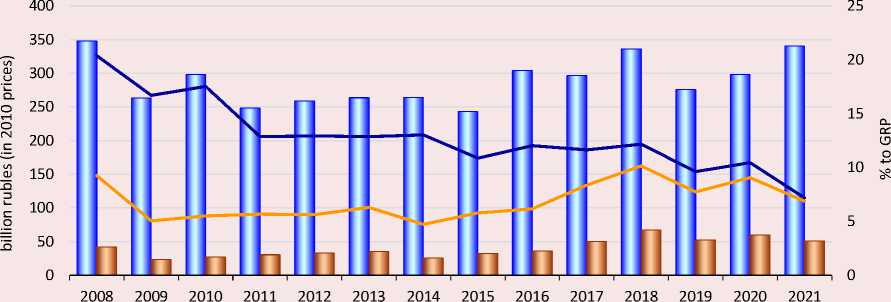
I ■ Saint Petersburg (left axis)
1 _ ■ Municipal districts of the Leningrad Region (left axis) ^^^^^^^м% to the GRP of Saint Petersburg (right axis)
^^^^^^^^м % to the GRP of the Leningrad Region (right axis)
Compiled according to: Gross regional product in basic prices (OKVED-2007). Available at: indicator/33379 (accessed: October 19, 2023); Gross regional product in basic prices (OKVED 2). Available at: https://www. (accessed: October 19, 2023); Investments in fixed assets carried out by organizations located on the territory of a municipality (without small businesses). Available at: (accessed: October 19, 2023).
which did not lead to an increase in the share of investments in fixed assets in the GRP of the region, but also did not lead to a significant drop in this share.
The fact that the Leningrad Region is characterized by moderate investment activity and the fact that TEA “Construction” is among key TEAs in terms of contribution to GRP in the region confirms the conclusions of another work devoted to the study of trends in the development of municipalities of the Leningrad Region located in the zone of intensive urbanization of the Saint Petersburg agglomeration, namely: the increase in the intensity of development activity in these municipalities is due to the development of industrial zones, location of new production facilities, organization of industrial parks, development of new investment sites, development of housing construction and modernization of infrastructure facilities (Sviridenko, 2020). A later study by this author draws attention to the problem of fragmented management, which we mentioned above; this problem had clearly manifested itself by 2022: it consists in the unsatisfactory quality and intensity of the investment process in the agglomeration area due to the insufficient level of cooperation between the two regions (Saint Petersburg and the Leningrad Region). The author sees the solution to this problem in achieving greater consistency of investment policy within the framework of development of the Saint Petersburg agglomeration. The “institutional interaction of the governing bodies of the two constituent entities of the Russian Federation” is proposed as a tool for solving the problem (Sviridenko, 2022).
This fact draws attention to the relevance of a broad expert discussion not only regarding what an indicator system should be for the purposes of managing the development of an agglomeration, but also regarding the form of institutions in which the agglomeration management function should be implemented, since this is very important for determining the management quality standards that would be advisable to follow. Modern studies of the last three years (Medeiros at al., 2020; Knickel at al., 2021; Kellokumpu, 2023) show that the relevance of this issue is increasing. Different management models also have different goals, different tools for achieving goals; thus, using the same indicator template is unlikely to be a rational decision. Therefore, among the obvious advantages we can point out the recommendatory nature of the indicators proposed in the Methodological Recommendations analyzed above and a certain degree of freedom that allows forming a system of indicators based on one’s own vision of the prospects for the development of the agglomeration (but with a focus on the “upper-level system of indicators”) by the heads of territories and citizens living within its borders.
Population. Monocentricity is one of the problems of the Saint Petersburg agglomeration
(Solodilov, 2021). Stimulating suburbanization, which leads to a decrease in the monocentricity of the agglomeration, seems to be a solution to this problem. In this regard, studying the dynamics and structure of the population of the agglomeration, as well as its settlement, is an important task, since this knowledge forms the basis for decisionmaking on managing the development of the agglomeration. Our analysis will not address the issues of territorial and sectoral development of the Saint Petersburg agglomeration, but individual indicators characterizing demographic processes are important for understanding the prospects for economic growth.
The first question that is of interest based on the objectives and aim of our study is the place of the Saint Petersburg agglomeration among the largest agglomerations in Russia. The composition of these agglomerations is determined by the Methodological Recommendations already given above. Table 3 shows the dynamics of the population of these agglomerations in the last
Table 3. The average annual number of permanent residents (2019–2021, people)
Agglomeration Years Average annual growth rate, % 2019 2020 2021 2019-2021 Largest urban agglomerations Perm agglomeration 1 168 551 1 168 040 1 163 548 1 166 713 -0.21 Saratov agglomeration 1 199 165 1 193 227 1 182 027 1 191 473 -0.72 Omsk agglomeration 1 259 634 1 246 656 1 232 125 1 246 138 -1.10 Krasnoyarsk agglomeration 1 267 351 1 269 416 1 276 212 1 270 993 0.35 Voronezh agglomeration 1 272 926 1 273 518 1 270 140 1 272 195 -0.11 Krasnodar agglomeration 1 270 334 1 289 642 1 312 521 1 290 832 1.65 Ufa agglomeration 1 300 725 1 305 709 1 313 050 1 306 495 0.47 Volgograd agglomeration 1 493 693 1 489 498 1 484 102 1 489 098 -0.32 Chelyabinsk agglomeration 1 526 104 1 521 354 1 523 729 -0.31 Rostov agglomeration 1 527 599 1 534 538 1 536 458 1 532 865 0.29 Kazan agglomeration 1 576 153 1 587 570 1 598 287 1 587 337 0.70 Nizhny Novgorod agglomeration 1 814 652 1 807 919 1 736 572 1 786 381 -2.18 Novosibirsk agglomeration 2 081 888 2 086 486 2 087 584 2 085 319 0.14 Samara agglomeration 2 106 142 2 102 965 2 093 143 2 100 750 -0.31 Yekaterinburg agglomeration 2 108 623 2 113 653 2 113 449 2 111 908 0.11 Saint Petersburg agglomeration 6 359 051 6 391 543 6 410 019 6 386 871 0.40 Moscow agglomeration 16 621 311 16 127 719 16 141 112 16 296 714 -1.46 Compiled according to: The average annual number of permanent population. FIRA PRO information and analytical system. Available at: (accessed: October 26, 2023); Regions of Russia. Socio-economic indicators. Rosstat. Available at: (accessed: October 26, 2023). three years and the average annual growth rate. According to the data provided, out of seventeen agglomerations belonging to the largest, for twelve the population did not exceed two million people, for three agglomerations it slightly exceeds two million people, and only two agglomerations have significantly more than two million people. These are the Saint Petersburg agglomeration, numbering more than six million people, and the Moscow agglomeration, numbering more than sixteen million people. The growth rate of the permanent population for nine agglomerations was negative. The Saint Petersburg agglomeration was among the eight agglomerations that had positive growth rates regarding the permanent population.
The largest share of the population of the Saint Petersburg agglomeration as of 2021 lived in the territory of Saint Petersburg (84%), Vsevolozhsky District (8%) and Gatchinsky District (4%). The following structural changes were noted in 2011–2021: in Vsevolozhsky District, the share of the population increased by 2%, and in Saint Petersburg – decreased by 2%. In addition, we observe a decline in the annual population growth rate for 2011–2021 from 1.39% to 0.28% (Fig. 6).
Since 2018, the demographic situation has been deteriorating: death rate has exceeded birth rate. The situation is complicated by a significant drop in migration growth; for example, in 2018, population growth was 9 people per 1,000 people, while in 2020 – 6 people (Fig. 7 ).
The highest level of average monthly real wages for employees of large, medium-sized enterprises and nonprofit organizations was recorded in Lomonosovsky Municipal District and in Saint Petersburg. Here, we also observe the largest average annual growth rates of wages, calculated for the period 2009–2021. The differentiation in the amount of wages between the highest and lowest average values in the agglomeration is 1.4 times for the three years under consideration (Fig. 8) .
Figure 6. Dynamics and structure of the population of the Saint Petersburg agglomeration
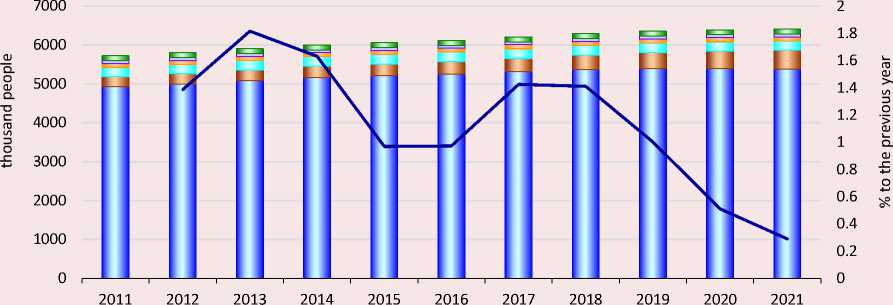
Saint Petersburg (left axis) L J Vsevolozhsky District (left axis)
L J Gatchinsky District (left axis) ■ _ J Kirovsky District (left axis)
Lomonosovsky District (left axis) ■ ■ Tosnensky District (left axis)
^^^^» Population growth rate (right axis)
Compiled according to: Average annual number of permanent population. FIRA PRO information and analytical system. Available at: (accessed: October 19, 2023).
Figure 7. Birth rate, death rate, and migration gain in the Saint Petersburg agglomeration for 2016–2021, per mill (per 1,000 people)
|
15 |
||||||
|
E ф |
10 5 |
|||||
|
0 |
2016 |
2017 2018 |
2019 |
2020 |
2021 |
|
|
Rirth ratp Birth rate |
||||||
|
□ path ratp Death rate |
||||||
|
Migration gain |
||||||
|
Migration gain |
||||||
Compiled according to: Population. FIRA PRO information and analytical system. Available at: search/#themes (accessed: October 19, 2023).
Figure 8. Accrued real average monthly wage for 2019–2021 and its average growth rate for 2009–2021 (indicated above the columns)

3.24%
2.77%
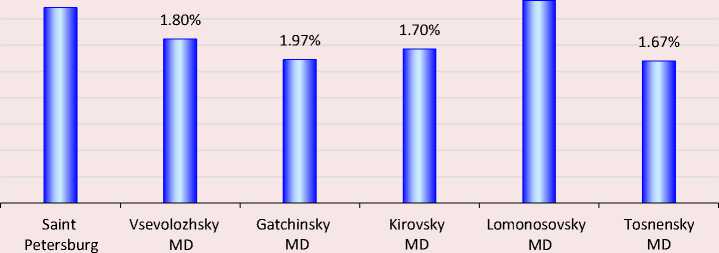
□ Accrued average monthly wage
Compiled according to: Average monthly nominal accrued wage of employees of large, medium-sized enterprises and nonprofit organizations of the urban okrug (municipal district). FIRA PRO information and analytical system. Available at: (accessed: October 19, 2023); Regions of Russia. Socio-economic indicators. Federal State Statistics Service (Rosstat). Available at: (accessed: October 19, 2023).
Discussion and conclusions
The above analysis allows us to make a number of generalizations that we put forward for discussion and that are important for assessing the current state and forecasting the development of large and largest urban agglomerations.
Using the information provided in federal strategic planning documents and obtained during the analysis of statistical indicators reflecting the development of the Saint Petersburg agglomeration, our study examines whether the indicator system established in the regulatory framework is sufficient to determine the main parameters of economic growth in agglomerations in order to manage their development. We should note that the indicators defined by federal strategic planning documents are minimally sufficient, and are suitable exclusively for the implementation of an extremely abbreviated version of express analysis. The available indicators do not allow us to identify, assess and forecast the factors that generate impulses for the development of an agglomeration.
The results of the analysis show that the federal level has a significant impact on the formation of the potential for managing urban agglomerations. This influence is related to the control that is implemented indirectly through a system of national goals and plans. At the present stage of development, a choice has not yet been made regarding the agglomeration management model and, accordingly, it is not yet clear what a planning system should be for the management of an urban agglomeration. The control that exists today creates a framework that defines the subjects of management and “upper-level goals”, but at the same time creates another problem: fragmentation of agglomeration management.
The research allowed us to identify three key components that modern methods of strategic planning and management of agglomerations development should include:
-
1) ensuring a compromise between state control and agglomeration management potential;
-
2) overcoming the problem of management fragmentation and the blurring of the institutional structure of agglomeration management;
-
3) using quality economics tools (metrology, standardization and quality management) in designing strategies and long-term plans for the development of urban agglomerations.
As a result, we substantiate the necessity to introduce a new approach to management, which consists in managing spatial forms, rather than individual cities and municipalities, and designing new management concepts.
The conclusions of this study have certain implications for designing a methodology for strategic planning related to the development of urban agglomerations. First, it is necessary to further elaborate on the methodology for developing indicators to assess the economic growth of agglomerations. The research presented in the paper shows the relevance and expediency of a detailed study of the issue regarding the full-scale implementation of quality economics tools in order to ensure the effectiveness of planning and management. This is especially true for systems consisting of multiple management entities.
Second, in order to overcome the identified limitations, it is necessary to form agglomeration management institutions that coordinate the actions of many management entities, which is an urgent methodological and applied task.
The findings of the study contribute to the development of theoretical provisions of agglomeration management science in the following areas. First, we have systematized the conditions that influenced the approach to strategic planning of agglomerations in the Russian Federation. Second, we have assessed the possibility of indicators used by federal strategic planning documents to identify factors that generate impulses for the development of agglomerations. Third, we have defined the range of the most significant principles for the Russian Federation in designing a methodology for the strategic planning and management of agglomerations development. In addition, it is possible to highlight the practical result of the study, which consists, in particular, in proposing ways to overcome the current difficulties in managing agglomerations.
The results obtained are important for stimulating the experiment on the use of quality economics tools (metrology, standardization and quality management) in designing strategies and long-term plans for the development of urban agglomerations in order to improve strategic planning methodology.
References Managing agglomeration development in the face of multiple competing goals: challenges and solutions
- Beel D., Jones M., Plows A. (2020). Urban growth strategies in rural regions: Building the North Wales Growth Deal. Regional Studies, 54(5), 719–731. Available at: https://doi.org/10.1080/00343404.2019.1669783
- Castan Broto V., Trencher G., Iwaszuk E. (2019). Transformative capacity and local action for sustainability. Ambio, 48(5), 449–462. Available at: https://doi.org/10.1007/s13280-018-1086-z
- Chuanglin Fang, Danlin Yu (2017). Urban agglomeration: An evolving concept of an emerging phenomenon. Landscape and Urban Planning, 162, 126–136. Available at: https://doi.org/10.1016/j.landurbplan.2017.02.014
- Dixon T.J., Karuri-Sebina G., Ravetz J., Tewdwr-Jones M. (2023). Re-imagining the future: City-region foresight and visioning in an era of fragmented governance. Regional Studies, 57(4), 609–616, DOI: 10.1080/00343404.2022.2076825
- Fauzer V.V., Smirnov A.V. (2023). International and Russian approaches to studying the sustainable development of urban environment: From theory to practice. Ekonomicheskie i sotsial'nye peremeny: fakty, tendentsii, prognoz=Economic and Social Changes: Facts, Trends, Forecast, 16(1), 85–102. DOI: 10.15838/esc.2023.1.85.5 (in Russian).
- Granqvist K., Humer A., Mäntyslao R. (2020). Tensions in city-regional spatial planning: The challenge of interpreting layered institutional rules. Regional Studies, 55(5), 844–856. Available at: https://doi.org/10.1080/00343404.2019.1707791
- Ivanova K.A. (Ed.). Doklad o sostoyanii mestnogo samoupravleniya v Rossiiskoi Federatsii. Mezhmunitsipal'noe sotrudnichestvo kak mekhanizm upravleniya gorodskimi aglomeratsiyami (2021): monografiya [Report on the Current State of Local Self-Government in the Russian Federation. Intermunicipal Cooperation as a Mechanism for Managing Urban Agglomerations: Monograph]. Moscow: Prospekt.
- Kellokumpu V. (2023). Depoliticizing urban futures: Visionary planning and the politics of city-regional growth. Regional Studies, 57(4), 617–628. DOI: 10.1080/00343404.2021.1980206
- Kitchin R., Moore-Cherry N. (2020). Fragmented governance, the urban data ecosystem and smart city-regions: The case of Metropolitan Boston. Regional Studies, 55(12), 1913–1923. DOI: 10.1080/00343404.2020.1735627
- Knickel K., Almeida A., Bauchinger L., et al. (2021). Towards more balanced territorial relations – the role (and limitations) of spatial planning as a governance approach. Sustainability, 13(9), 5308. Available at: https://doi.org/10.3390/su13095308
- Korshunov I.V. (2023). Sustainable development in regional strategies: Approaches and solutions. Ekonomika regiona=Economy of Regions, 1(19), 15–28. DOI: https://doi.org/10.17059/ekon.reg.2023-1-2 (in Russian).
- Medeiros E, van der Zwet A. (2020). Sustainable and integrated urban planning and governance in metropolitan and medium-sized cities. Sustainability, 12(15), 5976. Available at: https://doi.org/10.3390/su12155976
- Melnikova L.V. (2022). Efficiency and equality: Twenty years of discussion on spatial development. Region: ekonomika i sotsiologiya=Region: Economics and Sociology, 1(113), 289–323. DOI: 10.26425/1816-4277-2019-2-46-51 (in Russian).
- Musinova N.N. (2019). Development of urban agglomerations as one of the directions of the strategy of spatial development of Russia. Vestnik universiteta, 2, 46–51. DOI: 10.26425/1816-4277-2-46-51 (in Russian).
- Okrepilov V.V. (2021a). Experience in creating strategic documents for the development of the economy of St. Petersburg, aimed at improving the quality of life. Ekonomika Severo-Zapada: problemy i perspektivy razvitiya, 1(64), 4–13. DOI: 10.52897/2411-4588-2021-1-14-13 (in Russian).
- Okrepilov V.V. (2021b). Development strategy of basic economic branches of St. Petersburg. Ekonomika Severo-Zapada: problemy i perspektivy razvitiya, 2(65), 26–34. DOI: 10.52897/2411-4588-2021-2-26-34 (in Russian).
- Pavlov Yu.V., Koroleva E.N., Evdokimov N.N. (2019). Theoretical foundations for organizing the metropolitan governance system. Ekonomika regiona=Economy of Regions, 15(3), 834–850. DOI: 10.17059/2019-3-16 (in Russian).
- Rastvortseva S.N., Manaeva I.V. (2023). Modern development of the system of cities in Russia: Static and dynamic approaches. Ekonomicheskie i sotsial'nye peremeny: fakty, tendentsii, prognoz=Economic and Social Changes: Facts, Trends, Forecast, 16(1), 55–67. DOI: 10.15838/esc.2023.1.85.3 (in Russian).
- Solodilov V.V. (2021). Sectoral special features of territorial development of Petersburg city agglomeration. Ekonomika Severo-Zapada: problemy i perspektivy razvitiya, 2(65), 101–112. DOI: 10.52897/2411-4588-2021-2-101-112 (in Russian).
- Sviridenko M.V. (2020). Spatial development of municipalities of the Leningrad Region, located in the zone of intensive urbanization of the St. Petersburg agglomeration: Key trends and challenges. Ekonomika Severo-Zapada: problemy i perspektivy razvitiya, 1(60), 69–76 (in Russian).
- Sviridenko M.V. (2022). Formation of the concept of spatial development of the territory of the St. Petersburg agglomeration: the opportunity of a coordinated investment policy. Ekonomika Severo-Zapada: problemy i perspektivy razvitiya, 1(68), 92–97. DOI: 10.52897/2411-4588-2022-1-92-97 (in Russian).
- Tolkki H.; Haveri A. (2020). The dynamics between state control and metropolitan governance capacity. Administrative Sciences, 10(2), 1–12, Available at: https://doi.org/10.3390/admsci10020026
- Zhikharevich B.S. (2021). Impact of the spatial development strategy of Russia on municipal strategies. Ekonomika Severo-Zapada: problemy i perspektivy razvitiya, 3(66), 8–19. DOI: 10.52897/2411-4588-2021-3-8-19 (in Russian).
