Mapping and evaluating urban density patterns in Moscow, Russia

Author: Choudhary Komal, Boori Mukesh Singh Boori, Kupriyanov Alexander Victorovich
Journal: Компьютерная оптика @computer-optics
Section: Image processing, pattern recognition
Article in issue: 4 т.41, 2017.
Free access
The defense of the notion of ‘compact city’ as a strategy to reduce urban sprawl to support greater utilization of existing infrastructure and services in more compact areas and to improve the connectivity of employment hubs is actively discussed in urban research. Using the urban residential density as a surrogate measure for urban compactness, this paper empirically examines a cadaster database that contains details of every property with a view of capturing changes in urban residential density patterns across Moscow using geospatial techniques. The policy of densification in chase of a more compact city has produced mixed results. Findings of this study signal that the urban densities across the buffer zones around Moscow city are significantly different. The Landsat images from 1995, 2005 and 2016 are classified based on the maximum likelihood to expand the land use/cover maps and identify the land cover. Then, the area coverage for all the land use/cover types at different points in time is combined with the distance from the city center. After that, urbanization densities from the city center toward the outskirts for every 1-km distance from 1 to 60 km are calculated. The city density on the distance of 1 to 35 km is found to be very high in the years 1995 to 2016. As usual, the population, traffic conditions, industrialization and government policy are the major factors that influenced the urban expansion.
Density, compact city, land use/cover, buffer zones
Short address: https://sciup.org/140228765
IDR: 140228765 | DOI: 10.18287/2412-6179-2017-41-4-528-534
Text of the scientific article Mapping and evaluating urban density patterns in Moscow, Russia
Land use planning is an indiscernible part of the viability and livability of a metropolitan area because it affects decisions about where and how we live. Over the last few decades local councils and government agencies in Moscow have been continually developing land use planning strategies to contain and manage urban growth [1]. The general purpose of this shift is to reduce urban sprawl and support utilization of existing infrastructure and services in more situated areas [2]. Over all to this shift, suburbanization was heralded for hortative economic growth for generating employment with strong multiplier effects and for the development of infrastructure in urban fringe. Moscow is one of the most important historical, cultural, industrial and commercial cities in Russia. It has a booming economy with moveable growth. During the last two decades growth in industry, population and economic activities has been strongly concentrated in Moscow region. Moscow became the administrative center and took center stage in national development. Major development and supporting policy variation were undertaken and within two decades there were major transformation landscape changes in Moscow region.
In the past, few years valuable research has been carried out on the use of GIS (Geographical Information Systems) and Satellite data for measuring city growth and sprawl development patterns [3, 4]. Remote sensing a Laboratory of Advanced Technology for Earth provides spatially consistent data that cover large areas with both high spatial detail and temporal frequency. Newly, remote sensing has been used in combination with Global Positioning Systems and GIS to assess land cover change more effectively than by remote sensing data [5]. The objective of this study is to determine the spatial patterns of urban growth. The growth has been systematically mapped, monitored and accurately assessed using satellite images with conventional ground data. Mapping provides a picture of where growth is occurring helps to identify the natural and environmental resources.
In this research we will examine the hypothesis that the current compact city model is likely to increase the residential lodgment density in inner suburbs because the compact city policy encourages the development of multi-level constructions in these areas [6, 7]. To capture the change in urban density two main sets of techniques are employed. First a buffer analysis is applied to compute zonal statistics and test the difference in residential densities around the Moscow center. Second a metropolitan scale a spatial autocorrelation measure is used to calculate the degree of spatial clustering of dwellings. The spatial analysis applied in this study uses a 1 km by 1 km grid to explore the changes in urban residential density in Moscow. This represents the spatial variability and the degree of densification within the Urban Growth Boundary [8].
Study area
Moscow city, an important historical, cultural, social and economic center in Russian Federation was selected for this study (Fig. 1). The latitude of the city is 55° 45’ 7” N and longitude is 37° 36’ 56" E. The population of Moscow 13,197,596 permanent residents within city limits, 15,300,000 estimated totals within city limits, 17,900,000 urban areas and the total population in Moscow metropole areas is 20,561,194. This gives the city proper a very high population density of 4,900 people per square kilometer.
The climate of Moscow region is humid continental, short but warm summers and long cold winters. The average temperature is 3.5 °C (38.3 °F) to 5.5 °C (41.9 °F).The coldest months are January and February average temperature of -9 °C (16 °F) in the west and -12 °C (10 °F) in the east. The minimum temperature is -54 °C (-65 °F). Here are more than three hundred rivers in Moscow region and most rivers belong to the basin of the Volga. Which itself only crosses a small part in the north of Moscow region. They are mostly fed by melting snow and the flood falls on April-May. The water level is low in summer and increases only with heavy rain. The river freezes over from late November until April.
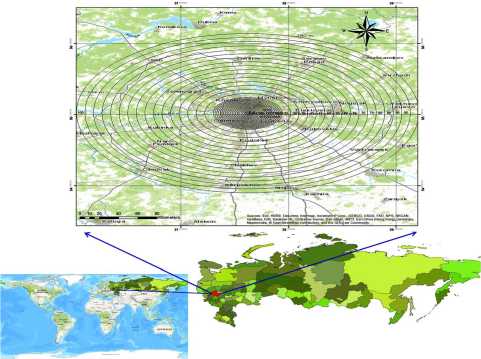
Fig. 1 Location map of the study area in Moscow Region, Russia
Data and methods
Urban density mapping is based on four core spatial digital databases of Moscow. The State digital property layers for September 1995, October 2005 and April 2016. The layers contain details for each property for Moscow in Russia. The specific satellite images used were Land-sat TM for 1995, Landsat ETM+ for 2000 and Landsat 8 for 2016, an image captured by different types of sensor [9, 10]. So, three different date satellite images were used. The spatial resolution is 30 m for band numbers 1 to 5 for all sensors. All images were from the USGS website. All images have the same spatial resolution for specific bands; one simply goes through maximum likelihood classification. In this study, at least 16 years’ time difference was used so that sufficient land use change information can be find out.
The mapping has been undertaken using a grid format with 1 – 1 km grid cell. It was centered on the centroid of the Moscow and the grid cells were then spread out to cover the total area [11, 12]. A number of data preprocessing were applied to process the data such as projection, rectification, registration, band combination and interpretation. Than complete data analysis as (1) Relates to calculation of urban density, which is measured as the number of residential dwellings per square kilometer; (2) applies a buffer analysis to evaluate difference between zones from the Moscow center; and (3) quantifies the degree of spatial clustering of dwelling density patterns [13, 14].
Maps processing
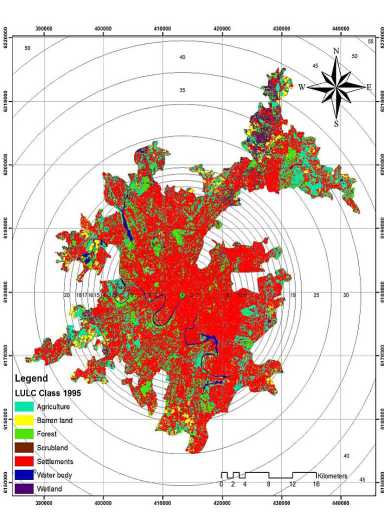
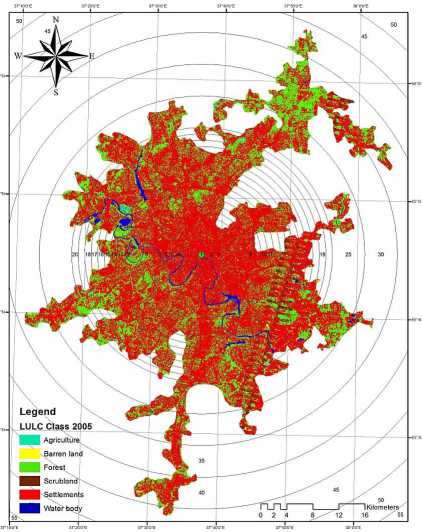
The image obtained as standard products were geometrically and radio metrically corrected by data providers. All three images were geometrically corrected up to the orthorectified level. Images from different sensors have different spatial resolutions. In this research we preferred to retain the spatial detail, original pixel size and value of each image for specific bands [15, 16]. The images were kept without changing their pixel sizes despite the possible varying accuracy level of classification with the different spatial, spectral and radiometric resolutions. All of the images were classified by creating accurate polygons as training areas for introducing ideal classes for each image by using the maximum likelihood classification method. To create a closer correspondence between the maps produced, the classification was done by considering following classes: agriculture, barren land, forest, settlements, scrubland, water body and wetland (Table 1).
Table 1. Land use classes definitions
|
LULC Classes |
Definition of Land Use Classes |
|
Agricultural |
Cultivated areas, crop lands, grass lands, vegetables, fruits etc. |
|
Barren land |
This contains open lands mostly barren but also small vegetation. |
|
Forest |
Small trees and shrub vegetation area except for vegetation. |
|
Scrub is a plant community describe by vege- |
|
|
Scrubland |
tation shrubs, often also including grasses and herbs. |
|
Settlements |
Includes construction activities along the coastal dunes as well as sporadic houses within the local village and some governmental buildings. |
|
Water body |
All the water within land mainly river, ponds, lakes etc. |
|
Wetland |
A wetland is a land area with standing water and low soil fertility. |
Post-classification refinement was used to improve the fraction with a complex combination of features (buildings, roads, grass, soil, trees and water), mixed pixels and the salt effect are common problem when we were using medium spatial resolution data [17, 18]. This research is focused on urban settlements and urban vegetation coverage measurement and their interactions. Rangeland is considered to be both forest area and nonurban vegetation. Water bodies have very limited cover- age and along with barren land are not discussed further in the results and discussion.
After classification multi-buffer rings are created for every 1 km distance from 1 to 60 from the city center to the outside. After that, the intersection with classified maps for all three dates is featured. All class areas were measured for 1 to 60 km distance and derive density according to [19, 20]:
Urban density =
Settlement area / Ring Total ring area
Urban growth rate
In order to evaluate the spatial distribution of urban expansion intensity, we adapted an indicator called annual urban growth rate (AGR) for evaluating the urbanization speed of unit area [21]. AGR is defined as:
ТТЛ TA
AGR = —n ----Lx100% .
nTAn + i
Where TA n+i is the total land area of the target unit to be calculated at the time point of I + n, UA n+i and UA i the urban area or built – up area in the target unit at times i + n and i, respectively and n is the interval of the calculating period . Usually, the target calculating unit is set to the administrative district so as to link with administration or economic statistics [22]. In this research, we preferred the geographical gridding unit since the administrative borders have been changed so frequently in this city. The maps were therefore gridded as 1×1 km units and the annual urban growth rates of each unit were then calculated. At last, the grid- based annual urban growth rates were mapped to evaluate the spatial features of the expansion.
Results and discussion
Urban residential density mapping has been conducted on a grid with a 1 to 1 km grid cell. The grid was generated for the Moscow area. The density maps in Fig. 2, a number of observations about spatial patterns of dwelling density can be made. First, dwelling density across the Moscow metropolitan area tends to vary substantially. Due to historical and geographical factors, eastern parts of Moscow are more densely populated than its counterparts the western suburbs. More than 10 training sites have been selected for each class so that classification accuracy is high. The high level of accuracy observed in this study could be the result of the classification since seven classes were used. Furthermore, in all buffer rings only the urban area was calculated in place of the whole ring. After that producing completed land use maps, the total coverage of different classes was determined.
Using this information, we calculated the water, forest, agricultural, barren land and settlements area per capita for all the study years (Table 2). There are several major trends explicit in the changes of land cover that are consistent over the period 1995 to 2016. The settlement area increased rapidly and there was a marked decrease in other classes. The categories in the land cover maps were agriculture, barren land, forest, scrubland, settlements, water body and wetland. Some interesting patterns in the distribution of dwellings across different buffer zones can be noted in Fig. 1. As expected the settlements / urban density in Moscow tends to downfall outward from the city center. According to the land use maps produced for the urban area of Moscow was expanded from 3898.31 km2 in 1995 to 4361.75 km2 in 2005 and finally reaches to 5852.00 km2 in 2016 (Fig. 3).
The urban area has been continuously increasing 8.34 % of the study area in 1995 to 9.33 % in 2005 and finally 12.51 % in 2016. The other classes’ area of agriculture land decreased from 29.24% in 1995 and 13.91 in 2005. The area of forest has first increased from 45.19 % to 52.75 % from 1995 to 2005 and later on reduced 42.54% in 2016. In contrast, the area of water body was 0.87% in 1995, 0.92% in 2005 and 0.96% in 2016. Barren land has first increased 45.19 % in 1995 to 10.09 % in 2005, later on decreased 6.40 % in 2016. Other classes such as scrubland first increased then decreased and wetland continuously decreased (Table. 2).
Fig. 2 represents 1.58 % growth in urban area over a period of two decades. In the first decade, urban growth was 1.06 %. In 2005 to 2016 (5852 km2), the average rate of expanse was 2.31 % it was increase (Table. 3).
City density patterns around the Moscow center were also examined to ascertain whether different zones have represented different densities. Fig. 5 shows 60 buffer ring zones from 1 to 60 km distance. It has been argued that the first five zones represent the areas that are within walking distance from the city center. High density development has been supported by the government to encourage people to walk to train stations and other destination such as shopping centers. This policy has in part been pursued to encourage active transport as part of a healthy lifestyle. WE find that in the city center urban density was more than 90 % for the last three decades. In 1995, it was reduced dramatically around 60 % on the distance of 5 km from the city center, less than 10 % on 15 km and 0 % after 40 km. When we were comparing 1995 and 2016 on the distances of 5, 8, 15, and 20 and 30 km the city density has been increase very high. If we compare only 1995 and 2005 on the distances of 8, 15, and 19 km the city density was highly increased. From 2005 to 2016 on the distances of 4 and 30 km density was increased. On the distance of 60 km the city density was 0 % in the last three decades (Fig. 4).
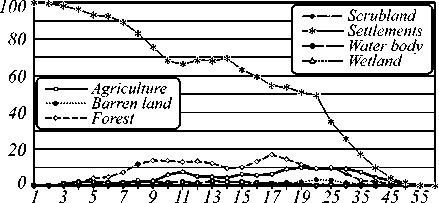
Fig. 5 shows, in 1995 the city center urban density was more than 90 %, the share of agriculture was 10 % and forest and water was 0 %. Till 4 km distance from the center the urban area continuously reduces and agriculture has continuously increased 45 %. Later on both have small variation and 7 to 16 km distance both classes were reduced. Both classes were stable or vary a little and after 40 km distance both classes have 0 % density. The class forest has 0 % density from 1 to 5 km and from 30 to 60 km distance. It has less than 10 % density from 5 to 40 km distance. The water class has almost close to 0 % density in all distances.
Legend
LULC Class
Agriculture
Barren land
Forest
Scrubland
Settlements Waterbody Wetland
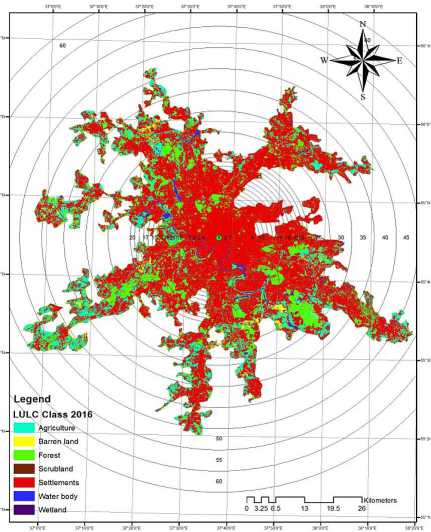
Fig. 2. Multi-buffer ring zones around the city center of Moscow for 1995, 2005 and 2016 maps
|
Table 2. Moscow Land use/cover classes for 1995, 2005 and 2016 |
||||||
|
Class |
1995 |
2005 |
2016 |
|||
|
Area KmSq |
% |
Area KmSq |
% |
Area KmSq |
% |
|
|
Agriculture |
13673.00 |
29.24 |
6504.00 |
13.91 |
13403.62 |
28.66 |
|
Barren land |
3802.63 |
8.13 |
4717.74 |
10.09 |
2993.18 |
6.40 |
|
Forest |
21135.18 |
45.19 |
24671.31 |
52.75 |
19896.64 |
42.54 |
|
Scrubland |
1268.97 |
2.71 |
3791.82 |
8.11 |
3377.49 |
7.22 |
|
Settlements |
3898.31 |
8.34 |
4361.75 |
9.33 |
5852.00 |
12.51 |
|
Water body |
408.96 |
0.87 |
430.13 |
0.92 |
449.45 |
0.96 |
|
Wetland |
2580.57 |
5.52 |
2291.37 |
4.90 |
795.75 |
1.70 |
|
Total |
46768.12 |
100.00 |
46768.12 |
100.00 |
46768.12 |
100.00 |
Table 3. Urban growth rate km2 of Moscow
|
Year |
19952005 |
20052016 |
19952016 |
Per year |
|
AGR (km2) |
1.06 |
2.31 |
1.58 |
0.075 |
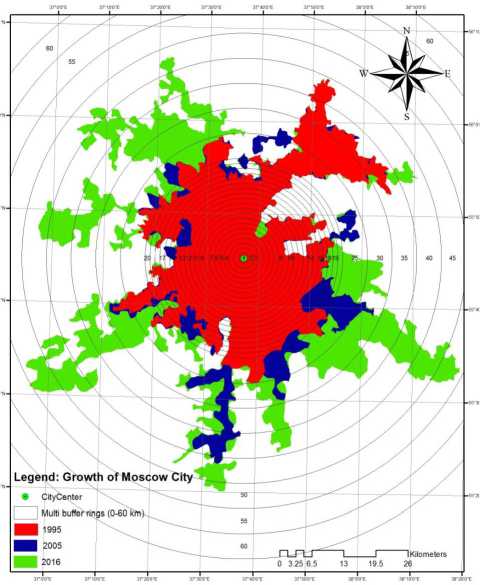
Fig. 3. Growth of Moscow in 1995, 2005 and 2016
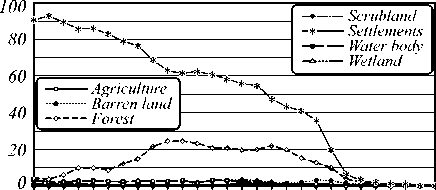
In 2005, density of urban area and agriculture is the same like 1995 till distance of 9 km. Later on urbanization reduces continuously. In 2005, agriculture has 10 % density on 10 km and 10 % density 7 to 18 km distance. Water class was very less on maximum distance and has 0 % density (Fig. 5). In 2016, in the city center urban density was more than 96 % and other classes as agriculture, forest, wetland water etc. were less than 5 %. From 1 to 5 km distance urban area reduce till 75 % but agriculture increase and reaches up to 24 % and later on reduces around 10 to 15 % in all distance. Urban density again increases after 6 to 10 km and later on reduces continuously. Forest is variant on 10 % and versa with agriculture class (Fig. 5). The census data indicated that the main phase of population growth in Moscow occurred between 1995 and 2001.
The main causes of this growth were a high birth rate, rural to city migration and the merging of nearby village with the city as it development. Urban expansion and subsequent landscape changes are governed by geographical and socioeconomic factors such as population growth, policy and economic development. In cases, urban expansion and associated land use changes resulted from a combination of these factors. For example, socioeconomic policy can strongly affect urban expansion and under the changes driven by urban expansion, the land use patterns of the urban outskirts are altered or adjusted in pursuit of high economic returns. Even though it is dif- ficult to clarify the influence of these factors in these changes, their influence is examined by analyzing the relationships between developed area and socioeconomic factors such as population, industrialization, traffic conditions and infrastructure.
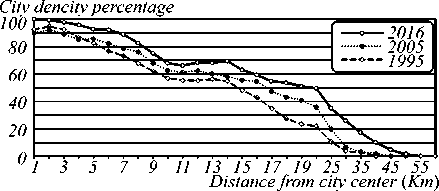
Fig. 4. Moscow density from 1 to 60 km distance for 1995, 2005 and 2016
City dencity percentage 2016
a) Distance from city center (km)
City dencity percentage 2005
1 3 5 7 9 11 13 15 17 19 25 35 45 55
b) Distance from city center (km)
c)
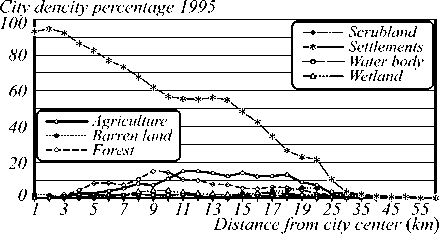
Fig. 5. Moscow land cover class density from 1 to 60 km distance for the year (a) 2016, (b) 2005 and (c) 1995
Conclusion
The empirical investigation of urban residential density patterns presented in this paper offers new insights into the spatial implication of policy changes. Moreover it provides evidence to assess the difference between rhetoric and reality in terms of achieving higher residential densities around the designated activity centers. Analysis of the database that contains details of every property has the potential to aide urban planners and policy practitioners in evaluations of urban consolidation policies. In comparing 1995 and 2016 on distances of 5, 8, 15, 20 and 30 km the city density was increased very high. In 1995 to 2005 on the distances of 8, 15 and 19 km the city density has been highly increased. From 2005 to 2016 on the distances of 3 and 35 km density has increased and on 55 km distance the city density was 0 % in the last two decades. In Moscow urban land expansion has largely been shaped by the tract such as mountains and lakes and social factors such as population growth, migration and economic development. All open spaces such as vegetation cover were destroyed and converted to urban areas. This study demonstrated that development occurred mainly in available open spaces in the city lands between the buildings. This will form the basis of future research. The spatial representation of change in residential dwelling density at a metropolitan level was the prime focus of this paper. Further research into the application of modelling techniques is therefore called upon to identify the factors that produce spatial mutability in density patterns with the ability to model the likely impacts of policy change.
References Mapping and evaluating urban density patterns in Moscow, Russia
- Anselin, L. Spatial econometrics: Methods and models/L. Anselin. -Dordrecht: Kluwer Academic Publishers, 1988. -284 p. -ISBN: 978-90-481-8311-1.
- Beed, C.S. Melbourne’s development and planning/C.S. Beed. -Melbourne: Clewara Press, 1981. -338 p. -ISBN: 978-0959416602.
- Choudhary, K. Spatial modelling for natural and environmental vulnerability through remote sensing and GIS in Astrakhan, Russia/K. Choudhary, M.S. Boori, A. Kupriyanov//The Egyptian Journal of Remote Sensing and Space Science. -2017. - -(In Press) DOI: 10.1016/j.ejrs.2017.05.003
- Burton, E. The compact city: Just or just compact? A preliminary analysis/E. Burton//Urban Studies. -2000. -Vol. 37, Issue 11. -P. 1969-2001. - DOI: 10.1080/00420980050162184
- Al-Awadhi, T. Monitoring and modeling urban expansion using GIS & RS: Case study from Muscat, Oman/T. Al-Awadhi//In: Proceedings of Urban Remote Sensing Joint Event. -2007. -P. 1-5. - DOI: 10.1109/URS.2007.371790
- Alphan, H. Land-use change and urbanization in Adana, Turkey/H. Alphan//Land Degradation & Development. -2003. -Vol. 14, Issue 6. -P. 575-586. - DOI: 10.1002/ldr.581
- Anderson, J.R. A land use and land cover classification system for use with remote sensor data/J.R. Anderson, E. Hardey, J. Roach, R.E. Witmer//U.S. Geological Survey Professional Paper. -1976. -Vol. 964. -P. 1-28.
- Barnsley, M.J. Inferring urban land use from satellite sensor images using Kernel-based spatial reclassification/M.J. Barnsley, S.J. Barr//Photogrammetric Engineering & Remote Sensing. -1996. -Vol. 62, Issue 8. -P. 949-958.
- Choudhary, K. Landscape analysis through remote sensing and GIS techniques: A case study of Astrakhan, Russia/K. Choudhary, M.S. Boori, A. Kupriyanov//Proceedings of SPIE. -2017. -Vol. 10225. -102251U. - DOI: 10.1117/12.2266245
- Lu, Q. Urban classification using full spectral information of Landsat ETM+ imagery in Marion County, Indiana/Q. Lu, D. Weng//Photogrammetric Engineering & Remote Sensing. -2005. -Vol. 71, Issue 11. -P. 1275-1284. - DOI: 10.14358/PERS.71.11.1275
- Bertaud, A. The spatial distribution of population in 35 world cities: The role of markets planning and topography/A. Bertaud, S. Malpezzi. -Madison, WI: Centre of Urban Land Economics Research, 1999. -23 p.
- Saboori, B. Economic growth and CO2 emission in Malaysia: A cointegration analysis of the environmental Kuznets curve/B. Saboori, J. Sulaiman, S. Mohd//Energy Policy. -2012. -Vol. 51. -P. 184-191. - DOI: 10.1016/j.enpol.2012.08.065
- Salari, H.E. Detection and analysis of land use changes and growth of Hanoi using remote sensing methods and Landsat satellite images/H.E. Salari, T. Hengsbach, C. Henke, J. Kopec, M. Kozinski, P. Sumpelmann. -Dortmund: Technische University, 2013.
- Stefanov, W.L. Monitoring urban land cover change: An expert system approach to land cover classification of semiarid to arid urban centers/W.L. Stefanov, M.S. Ramsey, P.R. Christensen//Remote Sensing of Environment. -2001. -Vol. 77. -P. 173-185. - DOI: 10.1016/S0034-4257(01)00204-8
- Thinh, N.X. Contemporary spatial analysis and simulation of the settlement development of the Dresden city region/N.X. Thinh//Proceedings of 17th International Conference Informatics for Environmental Protection, Cottbus, Part 1: Concepts and Methods. -2003. -P. 253-261.
- Thinh, N.X. Pin-pointing sustainable urban land-use structures with the aid of GIS and cluster analysis/N.X. Thinh, G. Arlt, B. Heber, J. Hennersdorf, I. Lehmann//Proceedings of the 15th International Symposium Informatics for Environmental Protection. -2013. -P. 559-567.
- Weng, Q.H. Land use change analysis in the Zhujiang Delta of China using satellite remote sensing, GIS and stochastic modelling/Q.H. Weng//Journal of Environmental Management. -2002. -Vol. 64, Issue 3. -P. 273-284. - DOI: 10.1006/jema.2001.0509
- Boori, M.S. Natural and Environmemtal vulnerability analysis through remote sensing and GIS techniques: A case study of Indigirka River basin, Eastern Siberia, Russia/M.S. Boori, K. Choudhary, A. Kupriyanov, A. Sugimoto, M. Eyer//Proceedings of SPIE. -2016. -Vol. 10005. -100050U. - DOI: 10.1117/12.2240917
- Wilson, E.H. Development of a geospatial model to quantify, describe and map urban growth/E.H. Wilson, J.D. Hurd, D.L. Civco, M.P. Prisloe, C. Arnold//Remote Sensing of Environment. -2003. -Vol. 86, Issue 3. -P. 275-285. - DOI: 10.1016/S0034-4257(03)00074-9
- Wu, K.Y. Impacts of land use/land cover change and socioeconomic development on regional ecosystem services: the case of fast-growing Hangzhou metropolitan area, China/K.Y. Wu, Z.Y. Ye, Z.F. Qi, H. Zhang//Cities. -2013. -Vol. 31. -P. 276-284. - DOI: 10.1016/j.cities.2012.08.003
- Xiao, J. Evaluation urban expansion and land use change in Shijiazhuang, China, by using GIS and remote sensing/J. Xiao, Y. Shen, J. Ge, R. Tateishi, C. Tand, Y. Liang, Z. Huang//Landscape and Urban Planning. -2006. -Vol. 75, Issue 1-2. -P. 69-80. - DOI: 10.1016/j.landurbplan.2004.12.005
- Yagoub, M. Monitoring of urban growth of a desert city through remote sensing: Al-Ain, UAE, between 1976 and 2000/M. Yagoub//International Journal of Remote Sensing. -2004. -Vol. 25, Issue 6. -P. 1063-1076. - DOI: 10.1080/0143116031000156792
- Choudhary, K. Analysis of urban spatio-temporal land use/cover change and expansion with their driving force through remote sensing and GIS in Samara city, Russia/K. Choudhary, M.S. Boori, A. Kupriyanov, V. Kovelskiy//In Book: Advanced materials, mechanical and structural engineering/ed. by S.H. Hong, J. Seo, K. Moon. -London, UK: Taylor & Francis Group, 2016. -ISBN: 978-1-138-02908-8. -P. 355-358. - DOI: 10.1201/b19934-70
