Mapping of vegetation cover and soil carbon stock using geographic information system tools, remote sensing data and digiatal elevation model

Author: Danilova Irina V., Ryzhkova Vera A., Korets Michael A.
Journal: Журнал Сибирского федерального университета. Серия: Техника и технологии @technologies-sfu
Article in issue: 6 т.10, 2017.
Free access
This study employed an algorithm of vegetation cover mapping based on a spatial analysis of Landsat OLI satellite imagery, a digital elevation model (DEM) and field data using geographic information systems (GIS) and expert knowledge. Applying this algorithm, maps of vegetation types and vegetation growth conditions were built for the test site in the northern part of near-Yenisei Siberia (Krasnoyarsk region). The spatial analysis of these two maps with field samples were used for the extrapolation and mapping of soil carbon stock volumes (kgC/m2).
Remote sensing data (rsd), digital elevation model (dem), geographic information system (gis), vegetation cover mapping, soil carbon stock, central siberia
Short address: https://sciup.org/146115245
IDR: 146115245 | UDC: 630.58.02+528.8 | DOI: 10.17516/1999-494X-2017-10-6-775-782
Картографирование растительного покрова и запасов углерода в почве с использованием ГИС, данных дистанционного зондирования и цифровой модели рельефа
В статье представлено применение алгоритма картографирования растительного покрова на основе спутниковых данных Landsat OLI, цифровой модели рельефа (ЦМР) SRTM и материалов полевых исследований. С использованием предложенного алгоритма и ГИС-технологий были составлены карты лесорастительных условий и актуальной растительности для тестовой территории в северной части Приенисейской Сибири. На основе пространственного анализа полученных карт и данных полевых измерений были выполнены экстраполяция и картографирование величин запасов углерода в почве (кгС/м2).
Text of the scientific article Mapping of vegetation cover and soil carbon stock using geographic information system tools, remote sensing data and digiatal elevation model
investigation was the approbation the algorithm for the test site in the northern part of near-Yenisei Siberia. Additionally, we used the produced map of vegetation regeneration as a base for mapping of ecosystem carbon stock volume.
Methods and materials
The test site (68º20’ – 68º30’ N, 88º30’ – 89º00’ E) was located in the northern part of Yenisei Siberia in forest-tundra and northern taiga subzones. Different natural vegetation types and their complexes present this area: tundra, forest-tundra, taiga forests and bog complexes.
Preliminary classification of the vegetation cover was performed using an approach of Russian forest scientist Kolesnikov [6]. According to this approach, the study territory is differentiated into sites similar in topographic location, combination of mesorelief form and elements and, hence, in ecological regimes creating a certain vegetation effect, rather than on continuously changing species composition. These sites are identified as VGC units. Therefore, vegetation type and VGC type are elementary units of preliminary conjugate classification of the test site [7].
In this study, VGC types were identified based on analysis of DEM SRTM [8], thematic maps (landscape, vegetation, soil) and ground truth data. Current vegetation cover classes were obtained based on the classification of Landsat 8 satellite data.
Satellite data pre-processing stage involved image geometrical correction and transformation to base map projection, georeferencing, as well as radiometric correction and preliminary processing of multiband images. To perform the automatized classification of a DEM-composite (elevation above sea level, slope) and satellite images, we used pixel-based classification algorithms: unsupervised clustering – ISODATA and supervised Maximum Likelihood Classification (MAXLIKE) [9].
In our studies, we used the data of complex GIS “Forests of Central Siberia” [10]. The input data included topographic base maps, DEM SRTM, high-resolution satellite images, such as Landsat TM/ETM/OLI, small-scale thematic maps (climate, landscape, soil etc.), and a database of ground observations on sample sites. Satellite images and DEM were processed with help of procedures of ERDAS Imagine 2011 and ESRI ArcGIS 10.1.
Results
The mapping of vegetation cover for the test site in the northern part of near-Yenisei Siberia was represented in a stepwise manner.
The first task was to develop an appropriate preliminary classification of vegetation and VGC, upon which the map legend would be based. We developed the classification of VGC for the test site taking into account site topology and the associated vegetation types. Also, we used DEM SRTM to build topological profiles that crossed the test site. Analyzing these transects and thematic maps (landscape, soil and vegetation), literature and field data, we identified sites relatively similar in relief (i.e., in mesorelief form, range of elevations above sea level, and dissection of surface) and vegetation cover characteristics and, therefore, determined preliminary number of classes for an automated DEM classification.
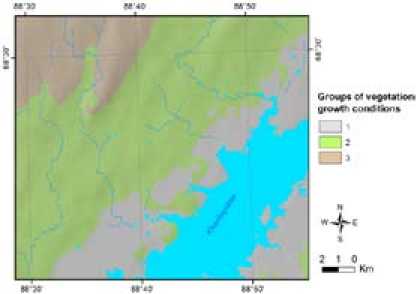
After that an unsupervised classification of DEM-composite (elevation above sea level (a.s.l.) and slope) was done. Additionally using thematic maps, three (1-3) classes with respect to geomorphology, zonal soil types, and predominant vegetation were obtained and identified as different groups of VGC (Fig. 1а).
More detailed units, VGC types, were identified for each group of VGC based on the ranges of slope values. For refining the classification, we identified sites that were relatively homogeneous in slope (flat surfaces (0-1°), soft slopes (1-2° or 1-3°), moderate slopes (3-5°), steep slopes (5-8°), very steep slopes (8-15°), benches and rocks (>15°)), which had relatively similar soil conditions and hydrological regimes and correspond to vegetation growth conditions types (Fig. 1 b ). Specific vegetation types or their complexes characterized the VGC types defined.
The resulting two-layer map (groups and types of VGC) was the basis for mapping of vegetation types.
The next step was an automated classification of RS data. To do this, we used summer (July) cloud-free Landsat 8-OLI scene (2013 year). The image was converted into the basic map projection, topographically normalized and then combined to obtain a 7-band image. We excluded the thermal band. To classify the multiband image, the training samples for major land cover classes were done with help of an aerophotography interpretation. The airborne imagery interpreted by expert-geobotanist using multiyear field and literature data, thematic maps and other reference knowledge.
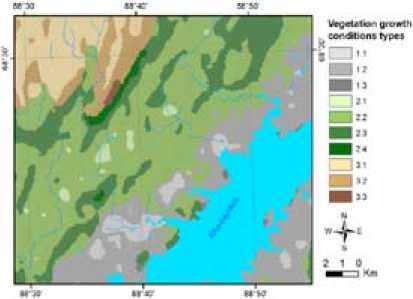
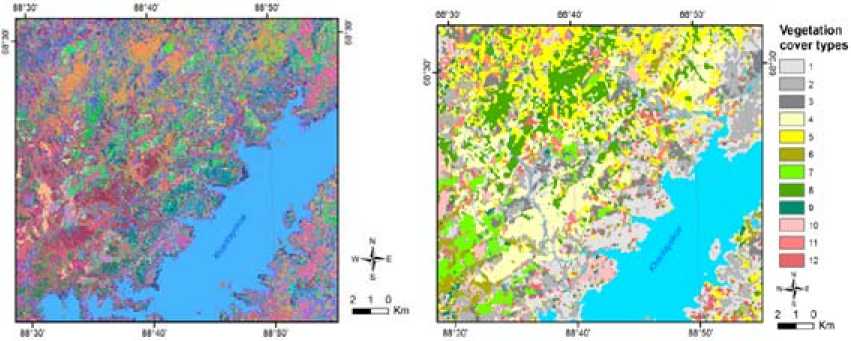
As a result of supervised image classification, a total 88 initial land cover classes were obtained (Fig. 2 a ). We received a mosaic image, which is very difficult to interpret because the vegetation cover was represented not only by vegetation types but also by their complexes.
Finally, an expert decision tree system was developed to generalize the land cover classes and to build the vegetation complexes using Knowledge Engineer module of ERDAS Imagine [11]. The initial land
a)
b)
-
1. Low (0-58 m a.s.l.), flat and rolling, and alluvial-accumulative, waterlogged plains with flat-bottom depressions, and frost hollows and mounds, frost mounds. VGC types classes are identified based on the ranges of slope: 1.1 – flat surfaces (0º), 1.2 – slightly sloping surfaces (0-1º).
-
2. Gently rolling, gently hilly, hilly glacial accumulative plains with runoff channels, thermokarst lakes and hollows, frost mounds, and bogged depressions (59-128 m a.s.l.). VGC types classes: 2.1 – flat bogged surfaces (0º), 2.2 – slightly sloping weakly dissected surfaces (0-1º), 2.3 – gentle slopes and interfluves (1-2º), 2.4 – ridge and hill slopes and tops (2-5º).
-
3. Elevated (129-226 m a.s.l.), hilly and ridged hilly, accumulative-denudation and denudation-erosional plains and plateaus with runoff channels, thermokarst lakes and hollows, frost mounds, bogged depressions, farewell rocks, and other structural forms. VGC types classes: 3.1 – weakly dissected flat surfaces (0-1º), 3.2 – soft slopes (1-3°), 3.3 – moderate slopes (3-5°).
Fig. 1. DEM-based layers of VGC for the test site: a – the raster layer of VGC groups (See the description (1-3); b – the layer of VGC types (See the description (1.1-3.3))
cover classes and VGC raster layers were used as input variables for the expert classification. The classes, belonging to defined VGC type, were distributed using the appropriate preliminary classification of VGC and associated vegetation types. The obtained vegetation types and their complexes are shown in Fig. 2 b .
Also, we created a map of soil carbon stock for the test site on the base of the produced maps of VGC, vegetation cover types and field data. Soil samples measurements were converted to the carbon stock values (kgC/m2) for organic and mineral soil layers. Than we extrapolated the carbon stock volumes using tabular reclassification approach. We overlaid available field sample points with combined layers of vegetation types and DEM-based VGC types. The resulted allocation table allowed us to link the carbon stock values from the field sample database (carbon pools parameters with values in kgC/m2) to combined vegetation types and VGC maps. The example of the resulted allocation table is shown in Table. The resulting raster layer of spatial distribution of mineral soil pool for the test site is presented in Fig. 3.
Conclusions
Using the algorithm of the conjugate analysis of satellite imagery, DEM, thematic maps and field data and the widespread software (ArcGIS, ERDAS), the maps of potential VGC, vegetation
a)
b)
1. Forest-bog complexes: spruce-larch, larch-spruce, and larch-birch (with aspen) open woodlands among moss-grass bogs. 2. Forest-bog permafrost-hillocky complexes: larch-subshrub-moss stands on hillocks among grass-moss bogs larch-birchgrass-dwarf birch-sphagnum open stands of depressions. 3. Grass-moss and dwarf birch-moss bogs. 4. Waterlogged open larch-grass (or tall grass-)-sedge stands, with spruce and birch, combined with wet grass-dwarf birch-sphagnum complexes of ridges and hollows. 5. Larch-subshrub-feather moss stands with spruces, larch-subshrub-moss stands combined with open birch-horse tail-sedge and open birch-sedge-moss woodlands. 6. Forest complexes on ridges and in depressions: larch-subshrub-feather moss stands, with spruce, on ridges, combined with larch-birch stands of grass bogs and with moss bogs. 7. Forest-bog permafrost-hillocky complexes: larch-feather moss-lichen stands on hillocks combined with larch-subshrub-sphagnum stands and moss bogs in depressions. 8. Larch-subshrub-feather moss stands with spruce and larch-grass- subshrub-feather moss stands combined with larch-grass-moss stands and grass-moss bogs of depressions. 9. Spruce-larch-grass- subshrubfeather moss stands combined with birch-larch stands of grass bogs and with dwarf birch sites. 10. Larch-subshrub-feather moss stands with spruce and larch- grass- subshrub-feather moss stands combined with larch stands of depressions and with tall-grass, or grass, or grass-moss bogs. 11. Bog-forest complexes of ridges and depressions: spruce-larch-grass-feather moss stands combined with birch-larch stands of grass bogs, dwarf birch, and dwarf birch-moss bogs. 12. Tundra complexes of hillocks and depressions: moss-lichen tundra on hillocks and shrubby tundra in runoff channel depressions.
Fig. 2. Landsat-based land cover classes for the test site: a – initial land cover classes; b – vegetation cover types map (1-12 – classes of vegetation cover types and complexes)
Table 1. Field site allocation based on VGC types and vegetation types classes
|
VGC groups (see Fig. 1 a ) |
VGC types (slope interval) (see Fig. 1 b ) |
Vegetation cover type (see Fig. 2 b ) |
Field sample name |
Mineral soil pool (kgC/m2) |
|
2. Low (0-58 m a.s.l.), flat and rolling, and alluvial-accumulative, waterlogged plains with flat-bottom depressions, and frost hollows and mounds, frost mounds |
slightly sloping weakly dissected surfaces (0-1º) |
1 |
K2ПП17 |
4,99 |
|
4 |
K2ПП24 |
4,10 |
||
|
12 |
K2ПП24_2 |
4,48 |
||
|
gentle slopes and interfluves (1-2º) |
2 |
K2ПП25 |
6,65 |
|
|
5 |
K1ПП23 |
6,56 |
||
|
12 |
K1ПП16 |
4,52 |
||
|
9 |
K1ПП24 |
3,63 |
||
|
4 |
K1ПП24_1 |
9,55 |
||
|
3. Gently rolling, gently hilly, hilly glacial accumulative plains with runoff channels, thermokarst lakes and hollows, frost mounds, and bogged depressions (59-128 m a.s.l.) |
weakly dissected flat surfaces (0-1º) |
1 |
К2ПП33 |
2,07 |
|
soft slopes (1-3°) |
1 |
К2ПП31 |
3,32 |
|
|
5 |
K3ПП32 |
4,30 |
||
|
3 |
K3ПП21_1 |
4,31 |
||
|
12 |
K3ПП11 |
3,36 |
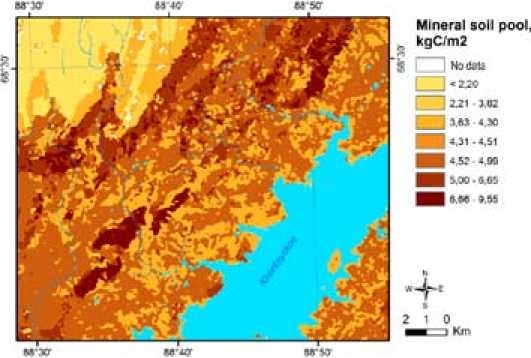
Fig. 3. Map of soil carbon stock (soil layer 0-20 cm) for the test site cover types and carbon stock characteristics were obtained for the test site in the northern part of near-Yenisei Siberia. The vegetation map is the result of spatial analysis of various environmental factors, that have an influence on the vegetation, and the vegetation itself. We determined the environmental properties of an ecosystem, where groups of plant communities coexist among the relatively homogenous landscape, using digital elevation model, topographic profiles, thematic maps, literature data, field information and expert knowledge. Current vegetation was based on satellite classification. Resulting map of vegetation cover types was constructed on the basis of combined analysis of environmental factors and current vegetation with help of expert decision tree system. The spatial layers of vegetation parameters was used in the complex models of carbon pools estimation.
The synergy of automated methods and expert interpretation allowed us to identify and map the useful qualitative and quantitative ecosystem characteristics. The applied algorithm permit us to efficiently update and adapt the obtained maps in the case of changes in the input data or the algorithm of their processing. The spatial analysis of two maps (VGC and vegetation cover) with ground observation data are being used to model different ecosystem parameters and thematic maps.
Acknowledgments
This work was funded by the Russian Foundation of Basic Research (Grant 15-04-04013) and by the Russian Federation Government Grant 14.25.31.0031.
References Mapping of vegetation cover and soil carbon stock using geographic information system tools, remote sensing data and digiatal elevation model
- Hansen M., Potapov P., Moore R., Hancher M., Turubanova S., Tyukavina A., Thau, D., et al. High-resolution global maps of 21st-century forest cover change. Science. 2013, 342, (6160), 850-853, DOI: 10.1126/science.1244693
- Gong P., Wang, J., Yu L., Zhao Y.C., Zhao Y., Liang L., Niu Z.G., Huang X.M., Fu H.H., Liu S., et al. Finer resolution observation and monitoring of global land cover: First mapping results with Landsat TM and ETM+ data. Int. J. Remote Sens. 2013, Vol. 34, 2607-2654.
- Bock M., Xofis P., Mitchley J., Rossner G., Wissen M. Object-oriented methods for habitat mapping at multiple scales -Case studies from Northern Germany and Wye Downs, UK. Journal for Nature Conservation. 2005, Vol. 13, 75-89.
- Clerici N., Weissteiner C., Gerard F. Exploring the Use of MODIS NDVI-Based Phenology Indicators for Classifying Forest General Habitat Categories. Remote Sens. 2012, Vol. 4, 1781-1803, DOI: 10.3390/rs4061781
- Данилова И.В., Рыжкова В.А., Онучин А.А. Использование спутниковых данных, цифровой модели рельефа и наземной информации для картографирования восстановительной динамики лесов. Геодезия и картография, М., Изд-во «Картгеоцентр», 2013, 9, 25-32.
- Колесников Б.П. Кедровые леса Дальнего Востока. М.-Л, 1956, 262 с.
- Korets M.A., Ryzhkova V.A., Danilova I.V., Prokushkin A.S. Vegetation Cover Mapping Based on Remote Sensing and Digital Elevation Model Data, Int. Arch. Photogramm. Remote Sens. Spatial Inf. Sci., XLI-B8, 699-704, , 2016 DOI: 10.5194/isprs-archives-XLI-B8-699-2016
- SRTM (Shuttle Radar Topography Mission) 3 arc second (90 meter) SRTM DTED (r) Level 1. 2002.
- Richards J.A., Xiuping J. Remote Sensing Digital Image Analysis: An Introduction. Birkhäuser, 2005. 439 р
- Корец М.А., Черкашин В.П., Рыжкова В.А. Оценка лесных территорий на основе сопряженного анализа ГИС и спутниковой съемки. Лесные экосистемы Енисейского меридиана, Новосибирск: Изд-во СО РАН, 2002, 173-180.
