Mapping Urban Expansion Due to Special Economic Zones in the United Arab Emirates Using Landsat Archival Data (Case Study Dubai)
")
Author: Naeema Alhosani
Journal: International Journal of Image, Graphics and Signal Processing(IJIGSP) @ijigsp
Article in issue: 4 vol.9, 2017.
Free access
There are presently about 40 special economic zones (SEZs) across the seven federating emirates of the United Arab Emirates. These SEZs include businesses technology hubs, science cities, recreational parks, and media parks. This study aims to document how the SEZs change or affect the transformation of urban expansion and land use practices in the UAE. The study aims to show the new industrial growth and expansion related with land use that emerge around the SEZs compared to before their establishment. The research is based on sequential analysis of temporal geospatial digital maps generated from archival Landsat TM in 2000 and Landsat 8 OLI of 2015. The study area is located around Alqouz and Albarsha localities situated in the western side of the city of Dubai with a vibrant SEZs. The analysis results show remarkable expansion of 23.6% of industrial and warehouse infrastructure coupled with major residential expansion of 18.6%. The findings of this research would help local authorities and corporation in planning for the future of these global businesses and local sustainability in the context of environmental planning and sustainability.
Special economic zones, urban expansion, Land use analysis, Landsat data
Short address: https://sciup.org/15014178
IDR: 15014178
Text of the scientific article Mapping Urban Expansion Due to Special Economic Zones in the United Arab Emirates Using Landsat Archival Data (Case Study Dubai)
Published Online April 2017 in MECS DOI: 10.5815/ijigsp.2017.04.03
-
I. Introduction
Land cover and land use changes have dependably been a range of enthusiasm for geographers and urban planners for the investigation of spatial patterns in urban areas. In recent decades, research on land use/land cover change has turned into an essential part of worldwide changes become an important aspect of global change, and global warming studies , because of its associations with atmosphere, biological system forms, biogeochemical cycles, biodiversity, and, much more vital, human exercises (L'opez et al., 2001; Aguilar et al., 2003). In the last 10 years, much more consideration has been paid to urban area use/land spread change since biological communities in urban regions are unequivocally influenced by human exercises and have close relations with the life of almost half of the total population (Stow and Chen, 2002.) The way of the urban
extension is not just by the development of the built-up areas, additionally has observed strikingly by industrial expansion, economic developmental and social developmental exercises and common assets utilization. Hence the direction of any growing urban society involves cautious analysis, precious planning and timely implementation of different strategic plans, keeping in view the constraints imposed by resources, space and time (Sebastian et al., 1998). Forecasting and understanding urban development and change are basic to city planners and administrators particularly in quickly changing situations (Knox 1993, Turner et al 1993).
There are many factors influencing the urban expansion of an area such as historical factors, cultural factors, social values, site factors, economic forces, economic accessibility, and influence of government. SEZs have been distinguished as one of the vital factors for urban landscape change in Asian nations, particularly China and middle east countries. Since the 1980s, the Asian mainland areas have been related to extension and development of SEZs of various sizes and economic advancement an growth targets (Farole and Akinci 2011). The SEZs are created of acquiring the accompanying mainly four four policy purposes (FIAS 2008, such as attract foreign direct investment (FDI): To serve as "pressure valves" to mitigate expansive scale unemployment, In support of a more extensive monetary change procedure, As experimental laboratories for the utilization of new strategies and methodologies.The expansion of the SEZs in Asia to a great extent takes after approaches and goals of different nations to attract the foreign investment to actuate national development and advancement (Wan et al. 2014).
Special economic zone established applying a different of institutional structures across the world ranging from fully public (government operator, government developer, government regulator) to 'fully' private (private operator, private developer, public regulator). For certain, the SEZs have implemented a niche for themselves by virtue of being vehicles for sustainability stresses and economic transformation in Asia (Chaudhuri and Yabuuchi 2010, Wang 2013). Interestingly, a portion of the SEZs are being created in view of enthusiasm for sustainability and communicated support for standards of green development (Sheng and Tang 2013).
Dubai is the highest crowded city and emirate in the United Arab Emirates (UAE), and the second largest emirate after the emirate of Abu Dhabi. It is located on the southeast coast of the Persian Gulf on the Arabian peninsula and is one of the seven emirates that make up the country. The Dubai metropolis is fast rising as global entertainment destination with its media friendly cosmopolitan life style. Over the last decades Dubai Emirate has seen an extraordinary financial restoration bringing about gigantic urbanization that transformed the desert into residential, commercial, industrial, sports and tourism ventures. (Ahmed et. al. 2012). Furthermore, Dubai has the largest number of SEZs in the UAE. There 21 free zones in Dubai itself.
This large number of SEZs within the emirate has lead to significant urban, economic and industrial expansion of impressively larger magnitude that transformed the desert surface forever. The primary focus of this study is to identify and map the urban and land use changes that occurred within the vicinity of an SEZ in the city of Dubai using remotely sensed data. Resulting information from such analysis are primarily thought by city and urban planners to be incorporated in the planning of future development of economic and commercial zones. Remote sensing and remotely sensed data provide an ideal suite of tools and information sources for mapping urban and land use changes due to many factors. Firstly, earth observation data comes in high quality with various levels of spatial and temporal resolutions. Secondly, space satellite provides global repetitive coverage making it easier to observe a phenomenon or a surface at different times to help analyze temporal changes within such phenomenon or surfaces. Satellite observations also come in various spectral measurements making such data ideal for different kinds of applications.
-
II. Study Area
Alqouz and Albarsha are located in the western part of Dubai and are bordered toward the north by Alwasl and Dubai business straight, the west by Umm Alsheif, Almanara and Alsafa, Alsouf, and in East Alkhaleel street and in South Hassa road street and Jabel Ali Race Course, framing a long rectangle. Alqouz comprises of mainly industrial region in the south with four sub communities each and residential area in the north east.
Alqouz industrial zones 1, 2, 3 and 4 are created by Dubai Municipality as an industrial and mass accommodation area. It contribute the service development projects of Dubai city, such as Dubai Marina and the free zone in Jebel Ali and also numerous Dubai hotel by facilitating offices, for example, labour camps that can house around 2,000 workers or staff. Albarsha is an collection of sub-groups of Dubai. It is a recently created communities that is near Dubai Internet City, Dubai Marina and the Palm Jumeirah. The major landmarks in Albarsha is Mall of the Emirates, Dubai American Academy, American School of Dubai and Dubai Autodrome. The selected area a has experienced drastic industrial and human settlement in the last 10 years..
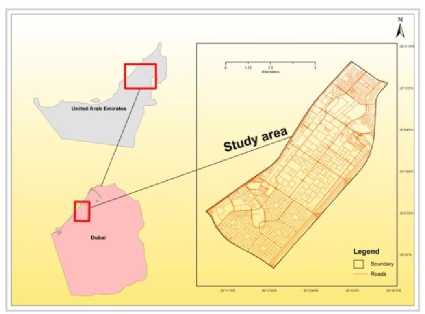
Fig.1. Study Area.
-
III. Data and Methodology
The data used for this study comes from the Landsat series, both Landsat 8 Operational Land Imager and
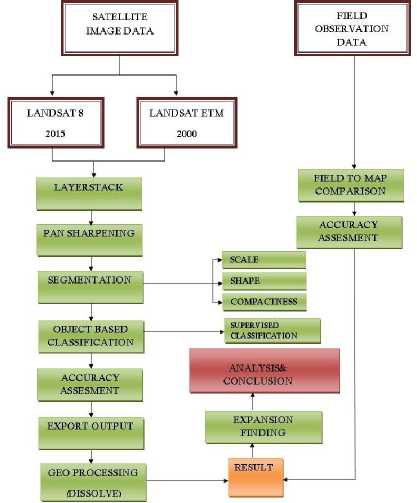
Fig.2. Methodology flowchart
Landsat ETM+. The Landsat 8 data have been acquired in February 2015 and Landsat ETM+ acquired in April 2000. A pan sharpening process to 15 m spatial resolution has been applied for all the multispectral data. Figure 2 describes the image processing methodology followed.
-
A. Step by Step Classification Process
-
1) Create / modify project
This is the first step to be followed for the classification. The purpose of this step is to insert image and thematic layers into a project and to define specific project settings.
-
2) Prepare configuration
The second step for this classification is configuration on the complete satellite image or selection of subsets. Subsets are needed for large images, to speed up the configuration of segmentation and classification actions.
-
3) Multi-resolution segmentation
-
4) Supervised classification
Supervised Classification has performed here after the segmentation process its purpose is to train and apply a classifier using samples. On the help of aerial photo of the study area six types of training sites are collected from the 2015 February segmented image and five types from the 2000 April segmented image and inserted as new classes.
-
5) Apply analysis to image
The major purpose is to apply the analysis configuration of segmentation and classification of actions on the whole image for workflow.
-
6) Object merge
Object Merge is a default system action. The aim of this process is merge object that are in the same class in to large object.
-
7) Accuracy assessment
Accuracy assessment is the process it validates the classification to ground truth data.
-
8) Export
The final output has exported in the form of shape file. It generates and saves a thematic layer with the classification results.
-
B. Object based classification
Urban structures in satellite images can be easily identified and classified using their rooftops rather than individual pixels at fine spatial resolutions. In such situations object oriented classification might be an extremely useful approach in mapping urban changes within the study area. An object classification approach was followed for generating land cover and land use maps for the study area. Yoon, G. W et al (2003) pointed out that object oriented classification of Landsat images can be used for the extraction of land use features. They extracted seven classes from the image using this classification technique. The classes are rural, agriculture, forest, grass, wetland, barren land, water. The purpose of his classification was to show the advancement of new classification technique such as object oriented classification and its application for moderate resolution images like Landsat. The concept of object oriented classification is that information necessary to analyze and interpret an image is not represented in single pixels, but in meaningful image objects and their mutual relations. Image analysis is based on homogeneous image regions that are generated by initial image segmentation. Connecting all the regions, the image content is represented as a network of image objects rather than pixels. These objects are more meaningful than the traditional pixel-based image classification.
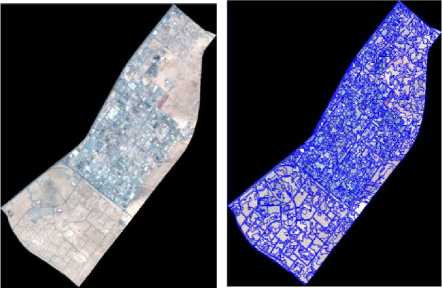
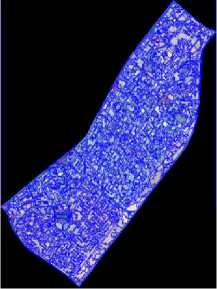
a. Study Area-Landsat-ETM+ 2000 b. Segmented Image Landsat ETM+ 2000
E. Field data collection
A field campaign was conducted in July 2015 to assess the accuracy of the classified maps. The field data collection involved identifying 54 points in the classified map in the lab with reference to the training sites collected earlier. Field visit was later conducted to confirm, or not, the accuracy of the classified map label. The selected verification points encompassed all the different land cover types in the map. Forty five points were correctly classified based on field observation resulting in an overall accuracy of 83%.
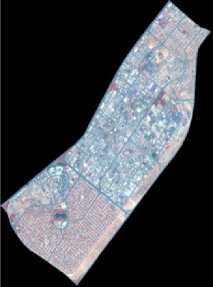
c. Study Area-Landsat-ETM+ 2015
d. Segmented Image Landsat 8- 2015
Fig.3. Segmentation output-2000 and 2015 Landsat Images
-
IV. Results and Discussions
Table 1. Segmentation criteria and its role of classification
|
Segmentation criteria |
Role of classification |
|
Scale |
Image segmentation is affected by the scale value parameter by determining the size of image objects. The variability allowed within each object is high when the scale value is high and image objects will be relatively large. On the other hand small scale values create relatively small segments as it allows less variability within each segment. |
|
Color/ Shape |
Object creation during segmentation is affected by color and shape factors. The resulting objects will be optimized for spectral or spatial homogeneity based on how high the value or shape criteria is. Color factor and shape factor balance each other therefore if color value is low then shape value will be high with high influence and vice versa. Similarly the segmentation outcome is affected in relatively equal amount by color and shape parameters when they both are equal. |
|
Smoothness/Co mpactness |
The image object is optimized with smooth border when the smoothness value is high. Similarly higher the compactness value more compact the resulting object will be. |
-
A. Land use expansion
Figures 4 and 5 show that the study area has changed dramatically in the period 2000 to 2015. There has been remarkable urban growth related to residential and economic activities. Six land cover types have been generated from the object oriented classification process. Namely, buildings and houses, industries and ware houses, roads, open sand and soil, vegetation, and water. The total study area is about 42.9 km2. Within the study area roads and highways made approximately 6.1 km2 which makes 14.2% of the total study area in the year 2000. By the year 2015 and due to the massive urban development and expansion roads and highways total area rose to 8.2 km2 making about 19.1% of the study area. The increase in transportation infrastructure is due to the increase of industrial and commercial urban development.
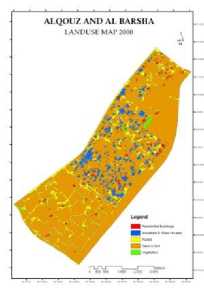
Fig.4. Land us map 2000
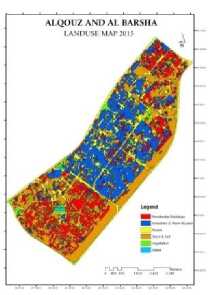
Fig.5. Land us map 2015
-
D. Image classification
Ecognition essential software provides various types of classification algorithms under the object based classification techniques. A supervised classification technique was followed. The K-Nearest Neighbor (KNN) has been applied here in this study where an object is classified by a majority vote of its neighbors.
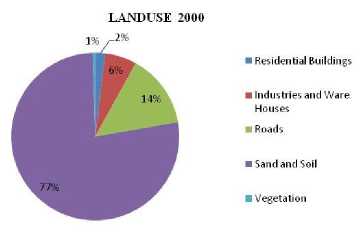
Fig.6. Land Use 2000
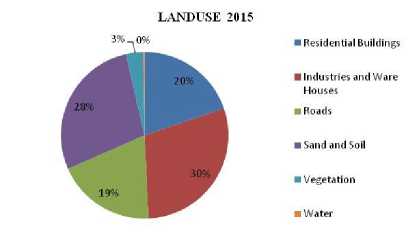
Fig.7. Land Use 2015
Table 2. Spatial extent of land use/land cover classification 2000
|
2000 Land Use |
Percentage |
Area In km2 |
|
Residential Buildings |
1.9 |
0.8 |
|
Industries and Ware Houses |
6.1 |
2.6 |
|
Roads |
14.2 |
6.1 |
|
Sand and Soil |
77.2 |
33.1 |
|
Vegetation |
0.5 |
0.2 |
|
Total |
100 |
42.9 |
Table 3. Spatial extent of land use/land cover classification 2015
|
2015 Land Use |
Percentage |
Area In km2 |
|
Residential Buildings |
19.8 |
8.5 |
|
Industries and Ware Houses |
29.5 |
12.6 |
|
Roads |
19.1 |
8.2 |
|
Sand and Soil |
28.0 |
12.0 |
|
Vegetation |
3.3 |
1.4 |
|
Water |
0.3 |
0.1 |
|
Total |
100 |
42.9 |
Table 4. Relative Changes of Land use
|
Land Use |
Growth Rate/Relative Changes |
Area In km2 |
|
Residential Buildings |
18.6 |
7.7 |
|
Industries and Ware Houses |
23.6 |
10 |
|
Roads |
5.2 |
2.1 |
|
Sand and Soil |
-49.2 |
21.1 |
|
Vegetation |
3.2 |
1.2 |
|
Water |
0.2 |
0.1 |
|
100 |
42.9 |
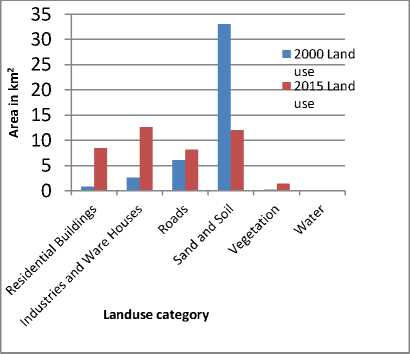
Fig.8. Land Cover Change in Alqouz Albarsha Region (2000-2015)
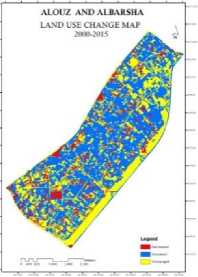
Fig.9. Land Use Change Map
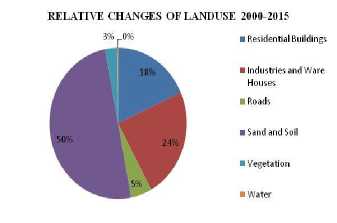
Fig.10. Relative Changes of Land Use Land Cover
The 2000 classified image shows a vast area under open sand and soil contributing of around 77.2% of the total area. By 2015 this area has shrunk to mere 28% of the total area to pave the way for the building of new different types of structures. In 2015 the open sand and soil class is located within the eastern part of the study area. The government’s initiative for environment sustainability and vast plantation resulted in an increase of vegetation cover to about 3.3% in the year 2015 with comparison of 0.5% in 2000. A new layer of waterbody is also introduced in this comparison as can be seen in 2015 classified image with an increase of 0.3% from zero in the year 2000. The comparison shown in table 1 and 2 depicts the difference in percentage of the layers participating in this classification schema for the year 2000 and 2015. This landuse/ landcover classification is also shown in fig 6 and 7 with additional graphical representation in figure 8 to portray the result.
Figure 9 is the land use change map and explaining the rate of relative change for the different land cover types in the year of 2000 and 2015. The most noticeable is the abundance of industries, ware houses, and lack of residential building in Alqouz region in the year of 2015. However, in Albarsha region the opposite is noticed. Industries are low and residential building are high. The increasing rate of residential buildings and industries and ware houses between the years 2000 and 2015 is 18.6 and 23.6 percentage respectively. The relative change of vegetation is 2.8 percentage or about 1.2 km2. The water is new land use feature in the 2015 image and it represent 0.2 % and 0.1 km2. The features such as residential building, industries and warehouses, roads, and vegetation, water are showing the positive change but in the case of sand it is negative change during the period of 2000-2015. Table 3 and figure 10 describe the relative changes happened within this time period. The area that has been converted from sand to building and industries is around 21.1 km2 showing the developmental progress of the area thus highlighting the intensity of urbanization. The landuse change and its diagram has been depicted in figure 9 and 10. Also the change rate of different land use features is shown in Table 3.
-
B. Residential building expansion
In the year 2000 residential areas represented by large apartment complexes and houses represented only 1.9% or 0.8 km2 of the total study area and was mainly distributed in the Alqouz region. However, by 2015 this area has expanded significantly to make up approximately 19.8% of the area scattered in Albarsha and north of the Alqouz area, figures 11 and 12. This indicates a remarkable expansion in the study area due to the expansion of population and economic growth. In 2000 the buildings and houses occupied a smaller portion of Albarsha area, however in Alqouz zone this was more since there were few established industries and warehouses at that time. Because of this rapid establishment of industries, warehouses and environmental pollution in Alqouz area, the people who stayed in here during the early 2000 period shifted their residence to Albarsha area. Also, Al Barsha area is more comfortable to stay due to the influence of vegetation, artificial ponds and good transportation facilities. For the same area, it has been noticed that there is an opposite tendency with an increase of more building and housing facilities showing the migration of residents to Albarsha 2 and Albarsha 3 from Alqouz area in the year 2015 due to the rapid establishment of industries and warehouses.
The north-eastern portion of the Alqouz region is being considered for the houses and buildings for those who work in this industrial area. The people who live here can be classified as top high ranking employees working in the industrial area. The extreme north portion of the Alqouz region is also seeing large commercial buildings and houses as these regions are not much of industries and warehouses compared to other parts of the area. The major commercial centres in the Albarsha area are the Albarsha mall and Mall of the Emirates and the people who work in these commercial centres are staying nearby its surroundings.
There is huge difference showing the residential buildings in the year of 2000 and 2015 as well as the growth rate of the residential building expansion is 18.6 percentage In the year 2000, the expansion of buildings and houses were scattered because there is not much industries and ware houses in this period But by 2015, the settlement has compacted and is focused on the either sides of the study area such Albarsha and North of the Alqouz region. Because the industrial expansion in the study area. This industrial expansion has occurred due to the establishment and growth of the special economic zone. The reason for the expansion of the residential blocks in Alqouz region, is the people those who are woking in the SEZs surrounding the study area and have an accomodation in there.
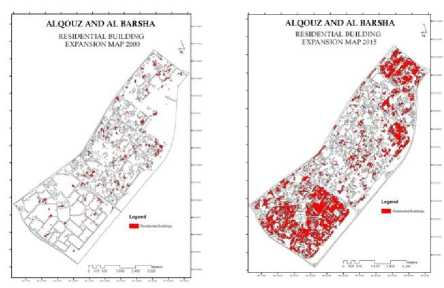
Fig.11. Residential Building Expansion 2000
Fig.12. Residential Building Expansion 2015
-
C. Industries and ware house expansion
According to the classified images of the years 2000 and 2015 the expansion of the industries and warehouses in the study area has changed intensely. Due to lack of SEZ and its influence in the year of 2000 only 6.1 % of the total area are industries and warehouses. This are mainly situated in the Alqouz region in a scattered pattern. But in 2015 industries and warehouses increased by 29.5% of the total area and are mainly situated in Al Alqouz region in a compacted pattern. There is huge difference showing the industries and warehouses in the year of 2000 and 2015. The growth rate of the industries warehouses expansion is 23.6 percentage. In figure 13 and 14 we can see the expansion of the industries and warehouses in the year of 2000 and 2015.
The major reason for this intensive changing of the industries and warehouses during this period is the establishment of the special economic zones surrounding of study area. The building material needed for the construction of this special economic zone IT hubs, other multinational ventures are produced from this Alqouz industrial zone. There is a good correlation between industries, and residential buildings in the study area. When the industries are increasing, buildings and houses are also increasing and are spreading on both sides of the Alqouz industrial zone such as Albarsha and northern side of the Alqouz. Figure 15 and 16 shows the relationship between industries and residential building in the year of 2000 and 2015.
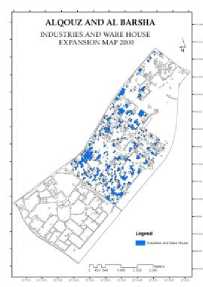
Fig.13. Industries and Ware House Expansion 2000
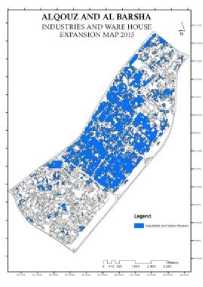
Fig.14. Industries and Ware House Expansion 2015
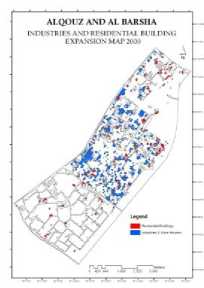
Fig.15. Industries and Residential building Map 2000
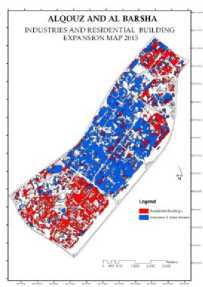
Fig.16. Industries and Residential building Map 2015
-
D. Future expected expansion
It is believed that in the future the urban development will continue towards the south eastern side of the study area. This is primarily due to two main reasons. First, the availability of large area of open land space, and secondly the existing transportation infrastructure suffice the future expected transportation demands for urban expansion in this region.
-
V. Conclusions
Urban growth is usually considered as one of the essential indicators of economic development and growth of any country. The process of urbanization and economic development in Dubai in the last three decades has generally brought about significant changes in the landscape pattern, land use practices and land cover.
The result from this study shows that in the year 2000, the expansion of buildings and houses were randomly scattered within the study area. However, due to the creation of SEZs by the year 2015, the settlements have been reorganized, compacted and expanded on the either sides of the study area to make full use of the available space. The economic incentives of the newly created SEZs lead to remarkable expansion of industries and warehouses in the area. In the year 2000, industries were concentrated mainly in the Alqouz area in a randomly scattered form. By 2015, the industries got compacted and are concentrated mainly in the Alqouz zone. There is seems a strong correlation between industries, buildings and houses in the study area. When the industries are increasing, buildings and houses are also increasing and are spreading on both sides of the Alqouz industrial zone such as Albarsha and northern side of the Alqouz. The residential building class increased from 1.9 % in the year of 2000 to 19.8% in 2015. The same growth can be in seen in industries and warehouses highlighting the positive growth of 6.1% to 29.5% from the year 2000 to 2015.
The findings of this research would help local authorities of municipalities and urban planners in the planning for the future such global businesses and their impact on urban growth and development. Furthermore, remotely sensed data proved to be quite useful in studying spatial urban expansion. This work can be further improved through the use higher spatial resolution data preferably resolutions 5m or lower to improve the accuracy of the land cover maps. The application of object oriented segmentation and classification can be significantly improved through the use of high spatial resolution data. This would result in much more accurate land cover maps that can provide accurate statistical measures for the areal urban expansion.
Acknowledgements
The author acknowledges Dr Abdelgadir Abuelgasim, Assistant Professor, Department of Geography and Urban Planning for their valuable contributions to improving the draft . Also acknowledges Mr.Safwan, research assistant, who kindly helped to prepare the maps for the study. The author thanks Geographic Information Department Dubai Municipality for providing the aerial photo of the study area to perform this work.
References Mapping Urban Expansion Due to Special Economic Zones in the United Arab Emirates Using Landsat Archival Data (Case Study Dubai)
- Abbas, K., & Rydh, M. (2012). Satellite Image Classification and Segmentation by Using JSEG Segmentation Algorithm. International Journal of Image, Graphics and Signal Processing, 4(10), 48.
- Aguilar, A.G., Ward, P.M., Smith Sr., C.B. (2003). Globalization, regional development, and mega-city expansion in Latin America: analyzing Mexico City’s peri-urban hinterland. Cities., 20, 3–21.
- Ahmed, N., Blackburn, A., and Whyatt, D. (2012). Quantifying Urban Growth in Dubai Emirate: A Geoinformatics Approach., 375-382.
- Bovik, A. C. (2006). Handbook of image and video processing. Beijing: Publishing House of Electronics Industry.
- Chaudhuri S, Yabuuchi S. (2010). Formation of special economic zone, liberalized FDI policy and agricultural productivity. International Review of Economics & Finance,19(4):779–788.
- Ecognition essential user guide 1.0 Published by: Trimble Germany GmbH, Arnulfstrasse 126, D-80636 Munich, Germany.
- Farole T, Akinci G. (2011). Special economic zones progress: emerging challenges, and future directions. The World Bank, Washington DC.
- FIAS. (2008). Special Economic Zones: Performance, Lessons Learned, and Implications for Zone Development. World Bank, Washington, DC.
- Knox, P. L. (Ed.). (1993). The restless urban landscape. Pearson College Division.
- L´opez, E., Bocco, G., Mendoza, M., Duhau, E. (2001).Predicting land-cover and land-use change in the urban fringe: a case in Morelia city, Mexico. Landsc. Urban Plan., 55, 271– 285.
- Sebastian M., Jayaraman V. and Chandrasekhar M.G. (1998). Facilities management using remote sensing data in a GIS environment. Acta Astronautica, , 43 (9-10), 487-491.
- Sheng N, Tang UW, Zhuhai. (2013) Cities. 32:70–79.
- Stow, D.A., Chen, D.M. (2002). Sensitivity of multitemporal NOAA AVHRR data of an urbanizing region to land-use/landcover changes and misregistration. Remote Sens. Environ., 80, 297–307.
- Turner, B., Moss, R. H., & Skole, D. L. (1993). Relating land use and global land-cover change. In International Geosphere-Biosphere Programme, Stockholm; Report, 24/Human Dimensions of Global Environmental Change Programme, Barcelona; Report 5.
- Yoon, G. W., Cho, S. I., Jeong, S., & Park, J. H. (2003). Object oriented classification using Landsat images. Forest,. 47(5.89), 37-50.
- Wang, J. (2013) The economic impact of Special Economic Zones: Evidence from Chinese municipalities Journal of Development Economics, Volume 101 March, Pages 133–147.
- Wan Z, Zhang Y, Wang X, Chen J. (2014). Policy and politics behind Shanghai’s Free Trade Zone Program. Journal of Transportation Geography, 34:1–6.
