Mask Region-based Convolution Neural Network (Mask R-CNN) Classification of Alzheimer’s Disease Based on Magnetic Resonance Imaging (MRI)
 Classification of Alzheimer’s Disease Based on Magnetic Resonance Imaging (MRI)")
Author: Anil Kumar Pallikonda, P. Suresh Varma, B. Vivekanandam
Journal: International Journal of Image, Graphics and Signal Processing @ijigsp
Article in issue: 6 vol.15, 2023.
Free access
Alzheimer's disease is a progressive neurologic disorder that causes the brain to shrink (atrophy) and brain cells to die. A recent study found that 40 million people worldwide suffer from Alzheimer's disease (AD). A few symptoms of this AD disease are problems with language understanding, mood swings, behavioral issues, and short-term memory loss. A key research area for AD is the classification of stages. In this paper, we applied both binary and multi-class classification. In this paper, proposed is a Mask-Region based Convolution Neural Network (R-CNN) for classifying the stages including MCI, LMCI, EMCI, AD, and CN of Alzheimer's Disease. First performing pre-processing by using the skull-stripping algorithm for removing the noise. Second, the patch wise U-Net has been employed to segment the images for improving the classification process. After that, the system's efficiency is examined using MATLAB-based experiments, utilizing images from the Alzheimer's disease Neuroimaging Initiative (ADNI) dataset to evaluate the efficiency in terms of accuracy, precision, recall, specificity, and sensitivity. Our proposed approach to classifying the stages achieves about 98.54%,94.2%, 98.25%, 99.2%, and 99.02%in terms of accuracy with EMCI, CN, MCI, AD, and LMCI respectively. Proposing mask R-CNN with segmentation to classify from CN to AD subjects successfully improved classifier accuracy significantly on the ADNI datasets.
Alzheimer's disease (ad), multiple stages, principal component analysis, a neurodegenerative disorder, and feature dimension
Short address: https://sciup.org/15018847
IDR: 15018847 | DOI: 10.5815/ijigsp.2023.06.05
Text of the scientific article Mask Region-based Convolution Neural Network (Mask R-CNN) Classification of Alzheimer’s Disease Based on Magnetic Resonance Imaging (MRI)
The most typical form of dementia is Alzheimer's disease, which results in a brain or neurological disorder this leads to progressive memory loss and cognitive decline as a result of the death of brain cells [1,2]. Typically, AD disease patients experience slow-onset symptoms that eventually become severe enough to interfere with their everyday lives [3,4]. Although this disease's primary cause is not just a problem with aging but also occurs in its early stages, although they have relatively mild memory loss, they have significantly changed skills and abilities [5]. A potentially successful treatment for AD is early diagnosis [6]. It might be difficult to diagnose AD, especially at an early stage. According to earlier research, the majority of AD patients no longer have language functions. To diagnose AD early, a neuropsychological evaluation is typically employed [7]. The clinician's skill and expertise are entirely responsible for the reliability of psychological cognition tests [8]. It will require more money and time to conduct this test on a significant number of AD patients. Therefore, it is essential to create automatic methods for detection and classification [9]. The explanation and evaluation of medical data is the responsibility of medical specialists; nevertheless, highly subjective and complexity of the images, and it is very challenging and limited for an expert to interpret images [10]. The disease is in different phases, as follows: Alzheimer's disease (AD), late mild cognitive impairment (LMCI), mild cognitive impairment (MCI) early mild cognitive impairment (EMCI), and cognitively normal (CN) [11 , 12]. There are no signs of dementia or depression in CN subjects. An EMCI, MCI, or LMCI indicates the stage at which the disease has advanced and started affecting daily activities. Symptoms include difficulty in reading and writing, memory problems, speech problems as well as loss of motor functions. MCI is determined by a neuropsychological test known as Wechsler Memory Scale (WMS) [13,14]. The final stage of AD is death. The cognitive decline in AD can still be slowed down since the disease cannot be cured. It is hence highly desirable to detect AD in the early stages to improve a patient's life span and develop drug trials successfully [15 ,16]. There was a lot of progress made in object detection and image classification due to a large number of labeled datasets. For example, an ImageNet database is a popular database that has millions of images and can be used to learn models. On significant image datasets, convolutional neural networks (CNNs) performed effectively [17]. A widely-known deep learning algorithm, CNN is notable for its accuracy when it comes to labeling medical images. Different models use CNN to categorize AD scans. In comparison to machine learning algorithms, CNNs offer the advantage that they do not require manual feature extraction because they can classify the stages of AD and effectively extract useful features [18]. From scratch, the previous deep learning and machine learning models are trained, however, they have drawbacks, including (1) For deep learning models to be trained, massive computational resources are needed; (2) The model is trained by requiring significant standard training datasets, which are expensive and pose ethical concerns in medical imaging; (3) the model requires more attention and time to tune during training due to the size of images, which causes the model to suffer from overfitting problems and is, therefore, less effective [19,20]. Multiclass characterization of five Promotion stages is directed in this review including Advertisement, CN, MCI, EMCI, and LMCI. Characterizing information with comparative qualities across various classes can challenge. Ground truth marks can likewise be hard to acquire for huge datasets. As profound learning has acquired wide notoriety in virtually all areas of PC vision and picture handling lately, this paper zeroed in on profound learning procedures to group the phases of Promotion. Via preparing our models over the ADNI dataset and logically characterizing the dataset, we assessed their presentation. The outcomes show that the profound component based technique outflanks different strategies.
Contribution of this research:
• First, the pre-processing is performed for removing the noise by using a skull stripping algorithm.
• After that, the patch wise U-Net has been employed to segment the images for the model's robustness and generalization ability.
• For the classification problem, a novel Mask R-CNN-based multitask learning system is created. We conduct the best results on binary and multi-class classifications such as AD, CN, MCI, EMCI, and LMCI.
2. Literature Review
The ADNI dataset is utilized for the characterization of different phases of Promotion, the trials are performed on the MATLAB stage. It's utilized to look into the proposed and existing techniques. As indicated by the exploratory outcomes, the Cover R-CNN beats the past strategies.
Numerous research methodologies have recently been developed for classifying Alzheimer's disease. In this subsection, some of the key contributions to the literature are evaluated.
Using a deep learning approach, Mahmoud et al [21] presented a model for determining the AD stage classes. VGG-16 was suggested as the source of the SCNN model. The OASIS dataset was used to validate their model. In addition, they investigate how to reduce model overfitting and reduce the effect of regularization on our application. They used a Gaussian noise and three types of normalizations for this purpose. The suggested model has outperformed five existing methods.
Liu et al. [22] presented multi-model deep CNNs to learn the Segmentation of hippocampal and classification of the disease concurrently. Segmentation of hippocampal and classification of the disease are done by using the multi-task deep CNN model. A 3D DenseNet was created based on information from rich and detailed images of the hippocampal region to predict the diseases. A combination of the DenseNet and multi-task CNN models was used to classify the disease. This framework provided the disease status, as well as hippocampal segmentation results. For the processing of MR images, there was no need for tissue segmentation and nonlinear registration.
MRI Images
Classified AD Stages

Preprocessing Stage
Classification
Mask R-CNN
Input Skull stripped image

Segmentation (Patchwise U-Net)
Fig. 1. Proposed Methodology
For AD detection, a deep convolutional neural network (DCNN) is used by Ajagbe et al. [23], which is the combination of CNN and transfer learning based on VGG(19) and VGG (16) using MRI. In their study, AD images are classified by neurologists into four different types and evaluated by multiple methods. To classify AD, this research primarily used DCNN and transfer learning algorithms. An evaluation was done based on six metrics including computational time, precision, recall, F1-Score, the area under the curve (AUC), and accuracy.
Suh et al. [24] developed an innovative deep learning-based algorithm. With the help of convolutional neural networks, they developed a two-step algorithm to predict disease, followed by 3 different classification methods including XGBoost. The classification tests employed a 5-fold cross-validation process.
An algorithm developed by Tuan et al. [25] used 3D brain MRI to diagnose AD. The suggested approach comprises two stages,(1) Deep learning-based segmentation and (2) deep learning-based classification. Following the brain, tissues were segmented by SVM and XGBoost classifiers. Based on comparisons, Dice scores of 0.96 were gotten in both datasets for segments and accuracy scores of 0.88, and 0.80 for classification, respectively, for the new method.
Resnet50 model was developed by Yildirim et al. [26]. Alzheimer's disease is diagnosed by using CNN architectures in this research. Based on the architecture, the disease is divided into four stages. Performances were determined with Alexnet, Vgg16, Densenet201, and Resnet50 architecture. Later, the hybrid model was used to implement the classification operation. The presented ensemble method achieved the highest performance rate. Based on Resnet50, this hybrid model was developed. Resnet50 has been simplified by removing some layers. Additionally, new layers were added to the Resnet50 model.
For diagnosing Promotion, Zhang et al. [27] introduced another profound learning model that actuates the clinician's analytic cycle. A clinician for the most part alludes to different neuroimaging and neuropsychological tests while diagnosing Promotion. This paper consolidated X-ray and PET with a clinical neuropsychological evaluation. By utilizing profound learning, multimodal clinical pictures were broke down. Also, the clinical neuropsychological finding is contrasted and the multimodal neuroimaging conclusion. By applying profound learning, a model can break down both the pathology and brain research of a patient, which prompts a better helper conclusion.
3. Problem Statement
Elderly people with cognitive problems like Alzheimer's and related dementias will become more prevalent as the world's population ages, putting unnecessary stress on local healthcare and social systems. Alzheimer's disease and similar dementias are mental illnesses with cognitive problems that are significantly impaired a person's capacity to carry out daily responsibilities. Constantly 2050, when around 14 million Americans are supposed to be impacted, the quantity of people with Alzheimer's illness is supposed to have duplicated ten times. Thus, it is trying to group various phases of Promotion because of covering highlights. Promotion diagnostics as a rule takes care of the 3 issues with parallel grouping: Advertisement versus MCI, CN versus MCI, and Promotion vs.CN, and multi-characterization issues.
4. Methodology
An improved computer-aided design system for Alzheimer's disease classification was developed in this study. This methodology is used for classifying Alzheimer's subjects into three major phases: image acquisition, preprocessing, segmentation, and classification followed by evaluation. A widely-known database on Alzheimer's disease contains neuroimaging data. In pre-processing, artifacts and noise are removed from data. Preprocessed data is then fed into U-Net for segmentation and for classification of Alzheimer's stages proposed is the Mask R-CNN. Figure 1 shows a graphic representation of these computational stages. The proposed method is briefly described below
-
4.1 Data Acquisition
The image collection is the first step in the detection of AD. On the ADNI website ( http://www.loni.ucla.edu/ADNI ), which is accessible to the general public, the data were taken from the ADNI database. In 2003, the ADNI was introduced by the Food and Drug Administration (FDA). ADNI was designed to measure MCI and early AD progression by combining other biological markers, comprehensive treatment evaluations.
-
4.2 MRI Pre-processing
A Gaussian Filter is a low pass filter used for reducing noise (high frequency components) and blurring regions of an image. The filter is implemented as an Odd sized Symmetric Kernel (DIP version of a Matrix) which is passed through each pixel of the Region of Interest to get the desired effect .After the acquisition of data, the noise is removed by using a skull-stripping algorithm. For skull stripping, a set of steps has been described. Noise is decreased by applying a Gaussian filter before skull stripping. A 3 x 3 filter is used to convolve the improved voxels according to equation (1).
- 1
1/2
k ( x , y ) = 1 1 1
11 1
Gaussian blur is used as a preprocessing step in many cases like canny edge detection. Gaussian blur the image to reduce the amount of noise and remove speckles within the image. A Gaussian Filter is a low pass filter used for reducing noise (high frequency components) and blurring regions of an image. The filter is implemented as an Odd sized Symmetric Kernel (DIP version of a Matrix) which is passed through each pixel of the Region of Interest to get the desired effect.
-
4.3 Segmentation
-
4.4 U – Net Architecture
-
4.5 Patch-wise U-net segmentation technique
-
4.6 Classification
Image segmentation involves converting an image into a collection of regions of pixels that are represented by a mask or a labeled image. By dividing an image into segments, you can process only the important segments of the image instead of processing the entire image The next stage is to segment the preprocessed image. The digital images are segmented into different segments by using the process of segmentation. This method simplifies image analysis to obtain more accurate information. Grey matter (GM), white matter (WM), and cerebrospinal fluid (CSF) are segmented using patch-wise U-net segmentation.
Image segmentation is a method in which a digital image is broken down into various subgroups called Image segments which helps in reducing the complexity of the image to make further processing or analysis of the image simpler. The simplest method for segmentation in image processing is the threshold method. It divides the pixels in an image by comparing the pixel's intensity with a specified value (threshold). It is useful when the required object has a higher intensity than the background (unnecessary parts).
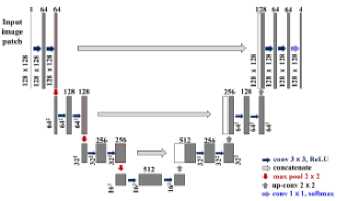
On the left side of U-Net are the encoders (contracting paths) and the decoders on the right side (expanding paths). To extract the features, the encoder uses a CNN, which is responsible for down sampling. Two layers of convolutional down-sampling are presented in each module. Up-sampling is done by the decoder. Up-sampling modules have a deconvolution layer (2×2) and two layers of convolution (3×3, without padding). Skip connections are used to join the shallow layer's feature maps to the deep layer's feature maps. Since the shallow and deep layers are concatenated, deep information and shallow information will be taken into account simultaneously, leading to better segmentation results of medical images.
For large images, however, more GPU memory would need to be allocated to the training process. The nonoverlapping patch-wise U-net model is developed to overcome the mentioned limitations. Our proposed architecture has the main advantage of patch-wise slicing of MRI images.
First, the input image is split into non-overlapping regions to train the U-net model. Patches help retain local information about an image. The smaller patches that result are also simpler to train than those with larger sizes since they consume less memory to train and test. Segmenting the brain structure into categories is a challenging task. Hence, the conventional U-net is unable to handle multi-class segmentation, where segmentation can only be done in binary. By using the U-net, the segmentation is done to address this issue. Using preprocessed input images, binary segmentation maps are generated for each class. Three of these channels make up a 3-channel target map, which is used as input for training in the model.
There are four patches of 128x128 pixels each based on 256x256 pixel input slices. This is also done for the preprocessed image. The MRI images and the skull-stripped images of each scan are divided into several patches, which are then used as training images. Thus, each input slice is divided into three patches to fit the 256*256 dimension. This results in each patch being half the size of an input slice. The input patches sent to the network during training are shown by the arrows. Two successive 3×3 convolutions with 128×128 input patches are followed by two rectified linear units (ReLUs). These are the contracting paths of the network. The feature maps are up-sampled following a 2×2 convolution ("up-convolution"), which reduces the feature channels in half. Following this, two 3×3 convolutions are computed, each with a ReLU, and from the contracting path, it is concatenated with the appropriate feature map. Each of the 64 component feature vectors is then mapped to three classes (in our case), using the 1×1 convolution.
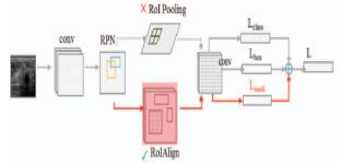
Mask R-CNN extends Faster R-CNN's application to image classification. Faster R-CNN and Mask R-CNN extract features, classify, and tighten bounding boxes by employing region proposal networks (RPNs). By using R-CNN, Faster R-CNN calculates ROI sizes at different scales with RoIPool, along with the size of RoI features at each scale using the maximum pooling method. ROI and features from the original image are misplaced due to the loss of spatial information. Mask R-CNN solves this problem by replacing RoI pooling with ROI alignment.
A multiclass and binary classification was done with the ADNI dataset. The performance of features extracted in the classification of AD was evaluated using mask R-CNN. Features that are extracted are trained and tested individually and are classified based on their stages as; AD, LMCI, MCI, EMCI, and CN for detection. Cases were split randomly into training and validation sets for the training process, and the validation sets were used for ensuring the strength of the model.
Therefore, Mask R-CNN minimizes the loss function. The new data is analyzed and predicted using the trained model as a part of the validation set.
Mask R-CNN's loss function can be expressed as:
LFmask = LFclass + LFbox + L^nask(2)
In which LFdass + LF bo x are detected similarly to Faster R-CNN,
LFclass + LFbox are defined as:
L' + LFbox = 1- Z LFci. (Pi,P*) + 77- Z P LF™"h (t — t)
5. Experimental Setup and Results
5.1 Tools and Software
N cls i
LFcls ({Pi , P*}) = — P* log P* — (1 — P* — (1 — P* )log(l — P*)
And the LF is the average binary cross-entropy loss:
LFmask = — -1 2 Z [ У ч lO g o У У +( 1 - У ч ) 1О д ( 1 - oy ik )1 m 1 < i , j < m
During training on the dataset, the loss function is minimized almost to zero, which shows that there is no overfitting issue with the model.
The developed technique utilized a Mask R-CNN model to classifying AD in patients. It is executed on MATLAB R2018a for the implementation on NP5SHR9 workstation Intel(R) Core(TM) CPU @ 2.60GHz with 8 GB RAM.
-
5.2 Dataset
-
5.3 Assessment Criteria
Neuroimaging data is acquired from Alzheimer’s disease Neuroimaging Initiative (ADNI) about/ADNI) database. It has been applied to classify AD in different researches. Developing clinical, neuroimaging, biochemical, and genetic biomarkers for disease prediction, diagnosis, and control is the goal of the comprehensive multisite ADNI research. Neuroimages from different modalities, such as MRI, PET, fMRI, and DTI are included in ADNI. Brain MRI scans from ADNI were utilized for this research. There are more than 800 subjects in the ADNI database including 493 CN, 204 EMCI, 61 LMCI, 198 MCI, and 145 AD. The input image size is 224*224. For training process,560 (70%) images are used. And for testingprocess,240 (30%) images are used. Approximately 800 images in the dataset. By carrying out research at the University of Southern California's Laboratory of Neuro-Imaging (LONI), MRI brain images are obtained at the ADNI.
On MRI images, experiments on deep learning models were conducted to detect AD. Table 1 summarizes the performance evaluation of the methods. The proposed model was compared to the other different model’s accuracy, specificity, sensitivity, precision, and recall. MRI images were classified using the neural network. Evaluation parameters include:
Accuracy ( AC) =
TP + TN
TP + FP + TN + FN
Pr ecision( PR ) =
TP
TP + FP
TP
R ecall ( RC) =--------
TP + FN
TN
S pecificity( SP) =--------
TN + FP
TP
SensitivitySN) =--------
TP + FN
The FN, FP, TN, and TP are the False Negative, False Positive, True Negative, and True Positive respectively. Performance metrics are evaluated on the ADNI MRI dataset.
-
5.4 Result Analysis
Fully connected CNN consists of two main components: Segmenting the brain images using a patchwise U-network, and identifying the detected areas by using the classification layer. First, input images will be processed by contracting and then by expanding, which will produce the final segmented image. Objects detected in segmented images would then be classified to improve the adaptability of the network model. Through the application of kernels and filters, the CNN layer in the proposed technique assists in turning the input image into a feature map. 800 images are presented in the dataset with various classes. For training process, 560 (70%) images are used. And for testing process, 240 (30%) images are used.
As part of the first experiment, MRI images were used for training and validating the model. Various evaluations were conducted after training. Our initial training was enriched by new examples. During this phase, the segmentation result was compared with the classifying of detected objects in cerebral images. Brain damage can be detected by the network. Different problems may occur as a result of the cases affecting brain functions. A patient may display similar symptoms to AD in these cases, yet the lesions can be treated. In Early-stage, both Alzheimer's disease and brain damage can be found in some cases. Some cases of AD can be observed, which show differences from a healthy brain.
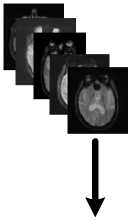
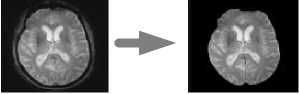
In the second experiment, we tested the results of the network, as well as methods that were not dependent on a prior learning domain. These methods all rely on convolutional structures. Figure 2 shows the sample images of the skull stripped image obtained in the preprocessing stage.
AD
LMCI
MCI
EMCI
NC
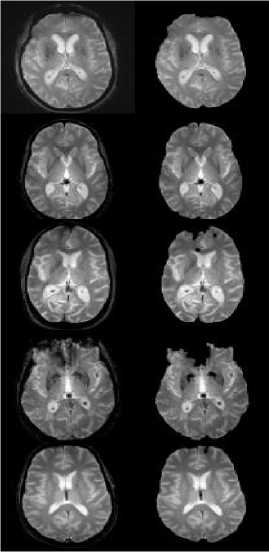
(a) (b)
Fig. 2. (a) Input image (b) Preprocessed result for the proposed method
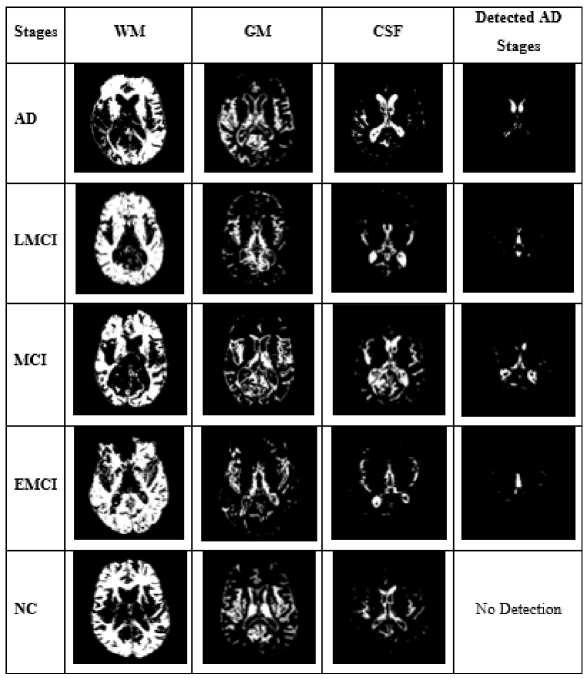
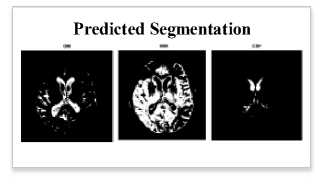
Fig. 3. Segmented and detected result for the proposed method
To test the proposed model, we chose images with clearly visible objects. Figure 3 shows all the differences between these images in terms of segmentation performance. Even though our model employs a better classification, training the network with an improved classification remains critical to achieving a high level of global segmentation accuracy. The proposed model achieved a high-performance efficiency in segmentation, detection, classification.
-
5.5 Comparison of classification results with existing techniques
To assess the models' performance, the experiment was evaluated with five different metrics. The following performance metrics were used namely: accuracy, precision, recall, specificity, and sensitivity. Comparative analysis and classification results are presented in Table 1. Figure 4-8 analyzes five AD stages graphically. It is not obvious to select algorithms for comparison, because ensemble methods and because ensemble methods and neural networks are overwhelmingly better at solving complex problems as it is already proven concept.
Table 1. Performance evaluation of several models using MRI images.
|
METRICS |
DT |
KNN |
CNN |
Proposed |
||||
|
CN |
EMCI |
MCI |
LMCI |
AD |
||||
|
Accuracy |
88.52 |
84.5 |
98.2 |
98.5 |
98.54 |
98.25 |
99.02 |
99.2 |
|
Precision |
88.52 |
82.22 |
84.15 |
83.25 |
85.25 |
88.32 |
86.54 |
93.25 |
|
Recall |
72.33 |
79.22 |
69.33 |
90.21 |
95.24 |
96.23 |
96.25 |
97.21 |
|
Sensitivity |
86.23 |
84.52 |
97.45 |
91.2 |
98.12 |
98.25 |
97.51 |
99.28 |
|
Specificity |
92.23 |
90.15 |
95.45 |
95.47 |
96.1 |
97.45 |
96.39 |
98.47 |
Compared to other existing models, our model performed better. By comparing the results of Decision tree learning (DT), Convolution Neural Network (CNN), and K-Nearest Neighbor (KNN), the proposed model's classification accuracy increased for each AD stage on comparing with the overall average of other existing techniques. Specifically, the proposed model improved accuracy with AD, MCI, CN, LMCI, and EMCI. Among the three models experimented with, the proposed approach achieved better performance by having 99.2(%) for accuracy, 93.25(%) for precision, 97.21(%) for recall, 99.28(%) for sensitivity, and 98.47(%) for in specificity respectively in detecting the AD stage. It was closely followed by KNN has the least performance. However, DT performed better than KNN and CNN having achieved 98.2(%) and followed by DT while KNN has the least performance.
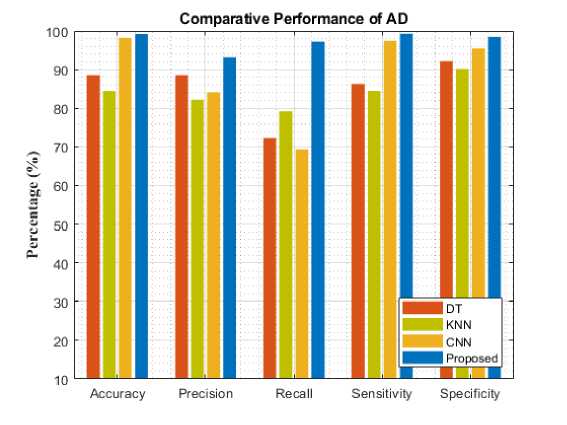
Fig. 4. Comparative analysis of different models for AD
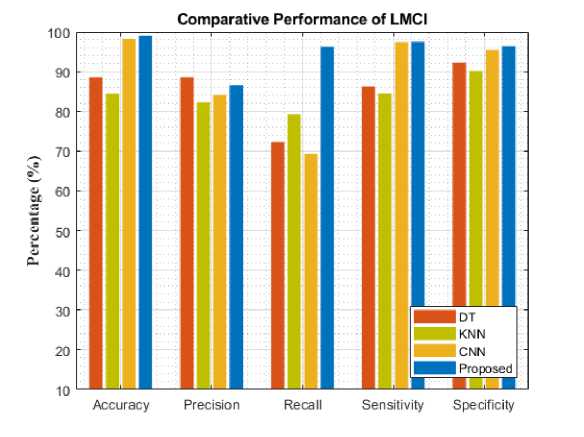
Fig. 5. Comparative analysis of different models for LMCI
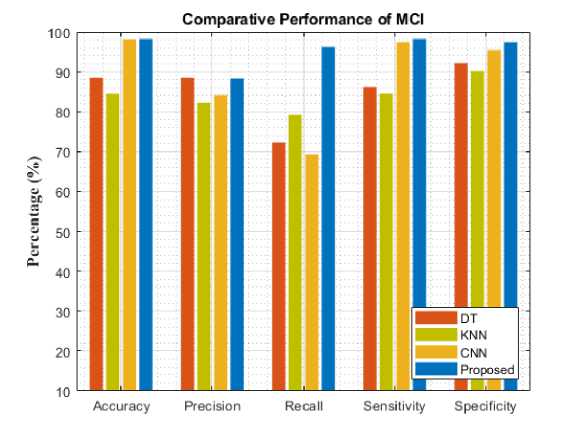
Fig. 6. Comparative analysis of different models for MCI
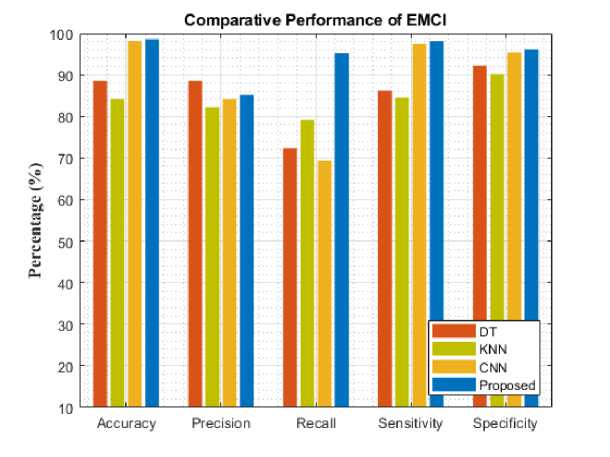
Fig. 7. Comparative analysis of different models for EMCI
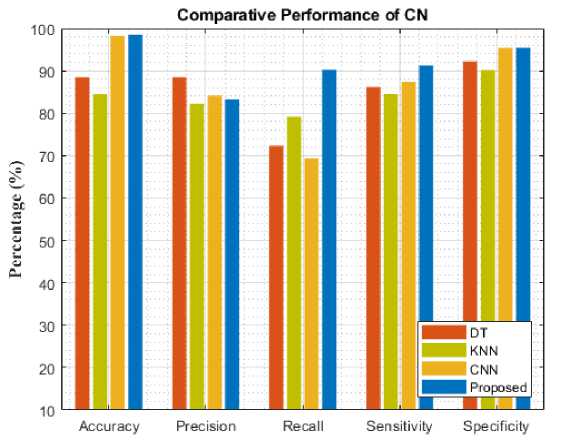
Fig. 8. Comparative analysis of different models for NC
In our experiments, we found that image segmentation of the brain can provide effective detection and classification for diagnosing stages reporting Alzheimer’s. In addition, our proposed classification technique (Mask R-CNN) can classify the subject's AD, MCI, and NC, and accurately from the structural MRI images of the brain.
Table 2. Comparative Analysis with different models
|
Classifier |
AD vs. CN |
MCI vs. CN |
AD vs. MCI |
|
Auto Encoder + 3D CNN |
95.39 |
86.84 |
92.11 |
|
3D CNN |
97.6 |
95 |
90.8 |
|
Proposed |
98.47 |
97.45 |
98.47 |
Table 2 compares the classification results of AD vs. MCI, MCI vs. CN, and AD vs. CN using various models. While compared to the previous models like Ensemble and 3D-CNN, the proposed modal performance is high. In addition, the same loss function was used for training these models for 50 epochs. The proposed model achieved an accuracy of 98.47%, 97.45%, and 98.47% for AD vs CN, MCI vs CN, and AD vs MCI in the binary classifications. Figure 9-11 shows the performance comparison of binary stages.
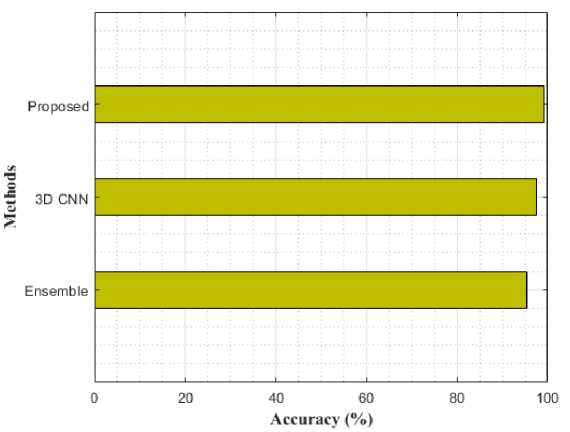
Fig. 9. Performance comparison for AD vs. CN using various models in terms of accuracy
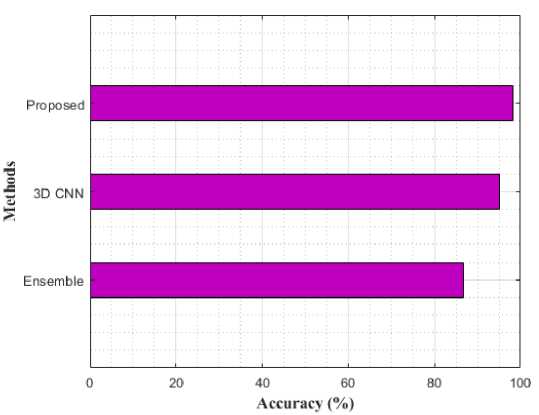
Fig. 10. Performance Comparison for MCI vs. CN using various models in terms of accuracy
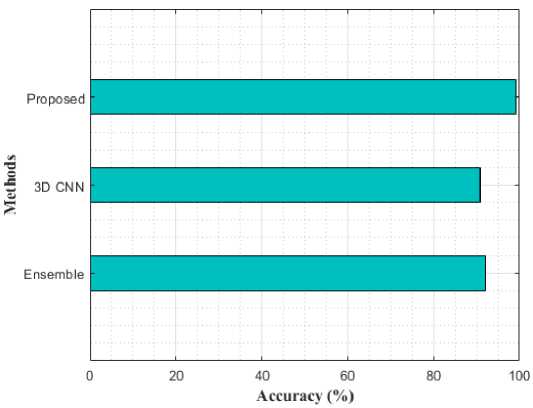
Fig. 11. Performance Comparison for AD vs. MCI using various models in terms of accuracy
Our model can classify Alzheimer's disease into different stages rather than just binary classification like most existing approaches and obtains superior performance in the case of both binary and multi-classification.
6. Conclusion
An extremely serious neurological disease is Alzheimer's disease affecting a large number of people around the world. With the help of brain MRI data analysis, we developed an effective model for the diagnosis of AD. The majority of previous research is concentrated on binary classification, whereas our model improves multi-class classification significantly. The study proposed to use Mask Regional Based Convolution Neural Network (Mask R-CNN) for performing the classification of 5 AD stages. In the medical field, the proposed model has only been evaluated on the AD dataset, but we hope it can be utilized well for other classification issues. Various metrics were calculated for the performance of the model and compared with existing methods to illustrate its accuracy. We intend to test the proposed framework in the future using various datasets related to Alzheimer's disease and other diagnosis of brain disorders.
References Mask Region-based Convolution Neural Network (Mask R-CNN) Classification of Alzheimer’s Disease Based on Magnetic Resonance Imaging (MRI)
- Ramzan, F., Khan, M. U. G., Rehmat, A., Iqbal, S., Saba, T., Rehman, A., &Mehmood, Z. (2020). A deep learning approach for automated diagnosis and multi-class classification of Alzheimer’s disease stages using resting-state fMRI and residual neural networks. Journal of medical systems, 44(2), 1-16.
- Raju, M., Gopi, V. P., Anitha, V. S., & Wahid, K. A. (2020). Multi-class diagnosis of Alzheimer’s disease using cascaded three dimensional-convolutional neural network. Physical and Engineering Sciences in Medicine, 43(4), 1219-1228.
- Basheera, S., & Ram, M. S. S. (2019). Convolution neural network–based Alzheimer's disease classification using hybrid enhanced independent component analysis based segmented gray matter of T2 weighted magnetic resonance imaging with clinical valuation. Alzheimer's & Dementia: Translational Research & Clinical Interventions, 5, 974-986.
- Basheera, S., & Ram, M. S. S. (2020). A novel CNN based Alzheimer’s disease classification using hybrid enhanced ICA segmented gray matter of MRI. Computerized Medical Imaging and Graphics, 81, 101713.
- El-Sappagh, S., Abuhmed, T., Islam, S. R., &Kwak, K. S. (2020). Multimodal multitask deep learning model for Alzheimer’s disease progression detection based on time series data. Neurocomputing, 412, 197-215.
- Eroglu, Y., Yildirim, M. and Cinar, A., (2022). MRMR‐based hybrid convolutional neural network model for classification of Alzheimer's disease on brain magnetic resonance images. International Journal of Imaging Systems and Technology, 32(2), pp.517-527.
- Jiang, X., Chang, L., & Zhang, Y. D. (2020). Classification of Alzheimer’s disease via eight-layer convolutional neural network with batch normalization and dropout techniques. Journal of Medical Imaging and Health Informatics, 10(5), 1040-1048.
- Salehi, A. W., Baglat, P., & Gupta, G. (2020). Alzheimer’s disease diagnosis using deep learning techniques. Int. J. Eng. Adv. Technol, 9(3), 874-880.
- Kumar, P. R., Arunprasath, T., Rajasekaran, M. P., &Vishnuvarthanan, G. (2018). Computer-aided automated discrimination of Alzheimer's disease and its clinical progression in magnetic resonance images using hybrid clustering and game theory-based classification strategies. Computers & Electrical Engineering, 72, 283-295.
- Maqsood, M., Nazir, F., Khan, U., Aadil, F., Jamal, H., Mehmood, I., & Song, O. Y. (2019). Transfer learning assisted classification and detection of Alzheimer’s disease stages using 3D MRI scans. Sensors, 19(11), 2645.
- Surendran, N. and Ahammed Muneer, K.V., (2017). Multistage Classification of Alzheimer ’s disease. International Journal of Latest Technology in Engineering, Management & Applied Science (IJLTEMAS), 6.
- Fulton, L. V., Dolezel, D., Harrop, J., Yan, Y., & Fulton, C. P. (2019). Classification of Alzheimer’s disease with and without imagery using gradient boosted machines and ResNet-50. Brain sciences, 9(9), 212.
- Yao, D., Calhoun, V. D., Fu, Z., Du, Y., & Sui, J. (2018). An ensemble learning system for a 4-way classification of Alzheimer’s disease and mild cognitive impairment. Journal of neuroscience methods, 302, 75-81.
- Cui, X., Xiang, J., Guo, H., Yin, G., Zhang, H., Lan, F., & Chen, J. (2018). Classification of Alzheimer's disease, mild cognitive impairment, and normal controls with subnetwork selection and graph Kernel principal component analysis based on minimum spanning tree brain functional network. Frontiers in computational neuroscience, 12, 31.
- Jo, T., Nho, K., &Saykin, A. J. (2019). Deep learning in Alzheimer's disease: diagnostic classification and prognostic prediction using neuroimaging data. Frontiers in aging neuroscience, 11, 220.
- An, N., Ding, H., Yang, J., Au, R., &Ang, T. F. (2020). Deep ensemble learning for Alzheimer's disease classification. Journal of biomedical informatics, 105, 103411.
- Bi, X. A., Cai, R., Wang, Y., & Liu, Y. (2019). Effective diagnosis of alzheimer’s disease via multimodal fusion analysis framework. Frontiers in genetics, 10, 976.
- Wang, H., Shen, Y., Wang, S., Xiao, T., Deng, L., Wang, X., & Zhao, X. (2019). Ensemble of 3D densely connected convolutional network for diagnosis of mild cognitive impairment and Alzheimer’s disease. Neurocomputing, 333, 145-156.
- Feng, C., Elazab, A., Yang, P., Wang, T., Zhou, F., Hu, H., ...& Lei, B. (2019). Deep learning framework for Alzheimer’s disease diagnosis via 3D-CNN and FSBi-LSTM. IEEE Access, 7, 63605-63618.
- Jain, R., Jain, N., Aggarwal, A., &Hemanth, D. J. (2019). Convolutional neural network based Alzheimer’s disease classification from magnetic resonance brain images. Cognitive Systems Research, 57, 147-159.
- Mehmood, A., Maqsood, M., Bashir, M., &Shuyuan, Y. (2020). A deep siamese convolution neural network for multi-class classification of alzheimer disease. Brain sciences, 10(2), 84.
- Liu, M., Li, F., Yan, H., Wang, K., Ma, Y., Shen, L., ...& Alzheimer’s Disease Neuroimaging Initiative. (2020). A multi-model deep convolutional neural network for automatic hippocampus segmentation and classification in Alzheimer’s disease. Neuroimage, 208, 116459.
- Ajagbe, S. A., Amuda, K. A., Oladipupo, M. A., AFE, O. F., &Okesola, K. I. (2021). Multi-classification of alzheimer disease on magnetic resonance images (MRI) using deep convolutional neural network (DCNN) approaches. International Journal of Advanced Computer Research, 11, 53.
- Suh, C. H., Shim, W. H., Kim, S. J., Roh, J. H., Lee, J. H., Kim, M. J., ... & Alzheimer’s Disease Neuroimaging Initiative. (2020). Development and Validation of a Deep Learning–Based Automatic Brain Segmentation and Classification Algorithm for Alzheimer Disease Using 3D T1-Weighted Volumetric Images. American Journal of Neuroradiology, 41(12), 2227-2234.
- Tuan, T. A., Pham, T. B., Kim, J. Y., & Tavares, J. M. R. (2020). Alzheimer’s diagnosis using deep learning in segmenting and classifying 3D brain MR images. International Journal of Neuroscience, 1-10.
- Yildirim, M., &Cinar, A. C. (2020). Classification of Alzheimer's Disease MRI Images with CNN Based Hybrid Method. Ingénierie des Systèmes d Inf., 25(4), 413-418.
- Zhang, F., Li, Z., Zhang, B., Du, H., Wang, B., & Zhang, X. (2019). Multi-modal deep learning model for auxiliary diagnosis of Alzheimer’s disease. Neurocomputing, 361, 185-195.
