Mass Detection in Lung CT Images Using Region Growing Segmentation and Decision Making Based on Fuzzy Inference System and Artificial Neural Network

Author: Atiyeh Hashemi, Abdol Hamid Pilevar, Reza Rafeh
Journal: International Journal of Image, Graphics and Signal Processing(IJIGSP) @ijigsp
Article in issue: 6 vol.5, 2013.
Free access
Lung cancer is distinguished by presenting one of the highest incidences and one of the highest rates of mortality among all other types of cancers. Detecting and curing the disease in the early stages provides the patients with a high chance of survival. This work aims at detecting lung nodules automatically through computerized tomography (CT) image. Accordingly, this article aim at presenting a method to improve the efficiency of the lung cancer diagnosis system, through proposing a region growing segmentation method to segment CT scan lung images. Afterwards, cancer recognition are presenting by Fuzzy Inference System (FIS) for differentiating between malignant, benign and advanced lung nodules. In the following, this paper is testing the diagnostic performances of FIS system by using artificial neural networks (ANNs). Our experiments show that the average sensitivity of the proposed method is 95%.
Segmentation, Fuzzy Systems, Artificial neural networks, Cancer Detection
Short address: https://sciup.org/15012864
IDR: 15012864
Text of the scientific article Mass Detection in Lung CT Images Using Region Growing Segmentation and Decision Making Based on Fuzzy Inference System and Artificial Neural Network
Published Online May 2013 in MECS DOI: 10.5815/ijigsp.2013.06.03
-
A. Lung Cancer
-
2.1, Pre-processing technique is presented. In section
-
2.2, image segmentation technique is introduced. Section 2.3, deals with decision making based on Fuzzy Inference System and in the section 2.4 testing result by using artificial neural network (ANN) are presented. Finally, in section 3, the conclusion and the analysis phase is discussed and the accuracy is determined, then, the future works are listed.
Lung cancer is also called cancer of the bronchus which is produced as a result of uncontrolled growth of the lung tissues, especially the cells which line the air passages. The resulting cells will not develop into healthy ones; they divide to form tumors which are considered as the main cause of death from cancers. The symptoms begin to appear after almost a long period which explains why the cancer is difficult to detect [1]. Medical statistics shows that the number of the cases breast, prostate and colon cancer is totally less those of lung cancer [2]. More than one third of the British population will be diagnosed with the cancer in their lifetime and one fourth of the cases will die from the disease [3]. Approximately 60% of patients are men and 33% of all death-leading cancers in men are because of lung cancer. However, awareness of the common symptoms of this disease makes the treatment possible in the primary phases. A type of disease in which the malignant tissue grows in one or both lungs, lung cancer kills more than 80 % of patients within 5 years of the diagnosis. Many of them notice their disease when it’s too late and the surgery is not simply possible. In USA, lung cancer has been the main cause of death from cancers with 14% of cases in 2011, and the major cause of 27% of the death from cancers. In the recent three decades, we have failed to increase much to the live of the patients suffering from the cancer. While, in the late 1970s, around 37% of patients had the chance of survived for one year or longer after the diagnosis, today 42% of them have the chance [4-7]. Today several techniques are used to diagnosis of the disease, such as Computerized Tomography (CT), Chest Radiograph (x-ray), Magnetic Resonance Imaging (MRI scan). Nevertheless, these techniques can detect the disease only in its advanced stages, which leads to the death of a number of the patients. Hence, we need the technique to diagnose in its early stages [1]. This will certainly enhance the speed and the quality of the diagnosis. Different software for representing and processing have been designed, such as 3D-Doctor, workstation, analyze, vitrea2-fusion7D, 3dviewnix, 3D slicer and Julius. Some of these software tools as image viewers support some visual formats like Dicom and analyze. Some of other tools provide features such as processing and visualization for instant registration, noise suppression, analyzing images for diagnosis purposes, applying conventional segmentation methods and representing 2D and 3D data using regular visualization methods. One of the most important feature of medical images is their quick and easy use of data [8].
Currently, the most effective image for early detection of lung cancers is CT, which is regarded as a more reliable tool. In this study, we have developed a tool for diagnosing the disease which works with fuzzy rules.
The first step of proposed method is Pre-Processing. In the field, image enhancement includes contrast and intensity manipulation, noise removal, filtering and etc. In this paper, Linear-Filtering technique is used for enhancement of the input image. The second step is image segmentation, which refers to the partitioning a digital image into different segments. In this work, we use image segmentation based on region growing techniques. The third step is decision making based on FIS, which plays a crucial role in providing medical assistance to the radiologist in diagnosing the abnormality in the medical images [9] . In this study, a new decision support system for lung cancer diagnosis is developed and assessed. A fuzzy set technique is used to determine the type of the mass diagnosed in the preview step. This system uses a rule base derived from knowledge of an expert, which is basically a set of statements or facts used for decision making [10] .
Rest of the article is organized as follows: In section
-
B. Previews Work
In a recent study, three tracking algorithms are given to find the best path between the nodes of the graph and a comparison is made with others. The study concludes that the method based on the Minimum Cost Path (MCP) method is the best and creates the most optimal route [5]. Despite the great need for such a technique to evaluate large 3D datasets, unfortunately little study has been done in this area. Another study tries to enhance the efficiency of the lung cancer diagnosis system by proposing the segmentation of the abnormal lung nodules, and this is carried out by region based segmentation and cancer identification using FIS. The accuracy of this proposed system is estimated 92.3% [9]. Another study applied the same method and arrived at an accuracy of 90% [11]. In the first step, the input image was preprocessed and the cancerous nodule areas were segmented and in the second step, involved the diagnosis of the nodal points based on the fuzzy system. Another researcher [1] presented two segmentation methods, FCM (Fuzzy C-Mean) and HNN (Hopfield Neural Network) clustering algorithm. These two methods are designed to classify the image of X pixels among Y classes. The results showed that the HNN segmentation results are more reliable than FCM clustering. Another researcher [12] is formed FCM as one of the most applicable fuzzy clustering algorithms. Nevertheless, this paper mentions two limitations with the methods: a predefined number of clusters which have to be given in advance and the FCM property which can be get stuck in sub-optimal solutions. Another researcher [13] attempt to evaluate the diagnostic power of a fuzzy classifier and a marker panel for the detection of lung cancers in comparison to asbestosis patients at high-risk of developing lung cancer. Finally the positive predictive value was 77.7%, and the negative predictive value amounted to 94.8%. Conclusion: With the fuzzy classifier and a marker panel, a reliable diagnostic tool for the detection of lung cancers in a high risk population is available. Another article [14] presents a genetics-based machine learning approach that performs feature extraction on data from a lab to help increase the classification performance of an existing classifier. The classifier was built using the data from a different laboratory which uses the same protocols, while learning about the shape of the fractures between data that motivate the bad behaviors. In a recent study [15] was compared the diagnostic performances of artificial neural networks and LR (multivariable logistic regression) analyses for differentiating between type of nodules (malignant and benign) in lung on CT scan images. For this purpose, morphologic features such as size, margins, contour, internal characteristics on images and the patient’s sex, age and history of bloody sputum were considered. At the end, ANNs outperformed LR models in both clinical and discrimination usefulness. In another paper [16] the analysis of medical image with artificial neural networks are presented. These techniques are illustrating: (1) how a known NN (neural networks) with fixed structure and training procedure could be applied to resolve the problem of a medical imaging; (2) how medical images could be processing and analyzing by using NN (3) how NN could be expanded rather to resolve this problems. At the end, a comparing between many neural network applications is done.
-
II. THE PROPOSED METHOD
The main purpose of the suggested model is to diagnose the lung cancer diseases trough image segmentation and decision making by using Fuzzy Inference System (FIS) and testing result by using artificial neural network. The methodology proposed for lung nodule detection consists of the acquisition of computerized tomography images of the lung.
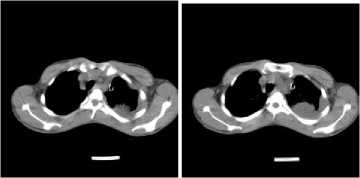
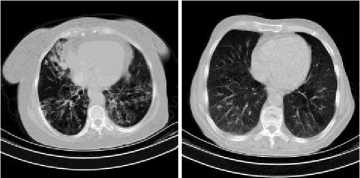
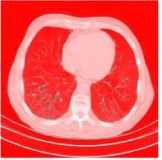
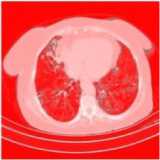
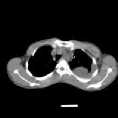
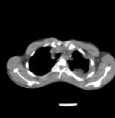
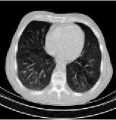
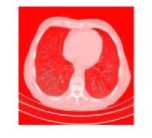
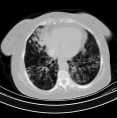
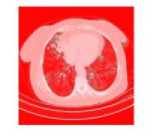
The method starts with pre-processing the image to enhance contrast and remove noise in order to make the image suitable for further processing. Linear filtering was used to remove the noise, in this study. After preprocessing the process of image segmentation was accomplished. The process of segmentation of the lungs is also a result of the region growing algorithm. Next, decision making was done by using FIS to classify tumors as benign, malignant or advanced. Then, by using artificial neural network the result of the FIS system is testing and the accuracy of model is calculated. Fig1 shows the steps involved in the proposed method. This method has been applied on a variety of provided images in MRI center in Hamedan that a number of which are displayed in Fig 2. These images taken from HRCT (high-resolution computerized tomography) scanning that is associated with Siemens.
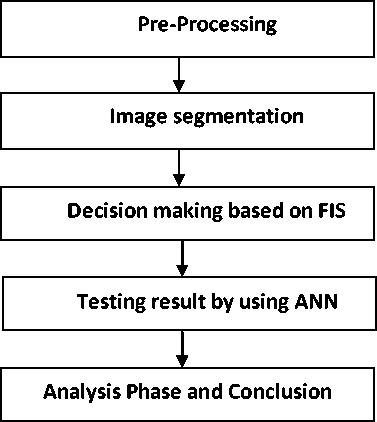
Fig1. The diagram of the method
(a) (b)
(c) (d)
Fig 2. Examples of MRI image and the mass in the lung
-
A. Pre-Processing
The images were pre-processed to adjust the colors for better segmentation. Pre-processing deals with techniques for increasing contrast and removing undesirable noises [11] . Filtering is a neighborhood operation, in which the value of any given pixel in the output image is determined by applying some algorithm to the values of the pixels in the neighborhood of the corresponding input pixel. In this article Linear-Filtering technique is used for enhancement of the input CT images. Linear filtering is a type of filtering in which the value of the output pixel is a linear combination of the values of the pixels in the input pixel's neighborhood.
So that, B = Linear-Filtering (A, H) filters the multidimensional array A with the multidimensional filter H. The array A can be a member of any class or dimension and can also be logical or an array of any non sparse numeric type. The result B is the same as A in terms of size and class. After preprocessing, the image segmentation is done by using region growing segmentation.
-
B. Image Segmentation
Segmentation refers to the process of partitioning a digital image into different classes. based on the application, different methods have been used for image segmentation, such as edge detection, histogram thresholding, ANN, stochastic models, region growing and clustering techniques [10] . In medical imaging, segmentation has a major role, since it helps in the delineation of anatomical structures.
A region growing based approach is utilized in segmentation process in the existing works. Region Growing is an approach in which neighboring pixels are examined and added to a region class as long as no edges are found between them [11] . We start with segmentation by finding boundaries through finding coherent regions.
This approach has certain merits over boundary based methods [17] :
-
• It is guaranteed to produce coherent regions. Linking edges and gaps produced by missing edge pixels, and the like, are not an important issue.
-
• It works from the inside to the outside. Notice that, selecting of the initial point is important.
However, it also has disadvantages [17] :
-
• Choosing region membership is more difficult than applying edge detectors.
-
• It can’t search objects that span different disconnected regions.
We start with a pixel p and want to expand from that pixel to fill a coherent region. Let’s define a certain measure D(i, j) which it produces a high result, if pixels x and y are similar and a low one otherwise. First, consider a pixel m adjacent to pixel n. We can add pixel m to the region of pixel n, if D(n, m) < T for some threshold T. We can also proceed to the other neighbors of n. Suppose that D(n, m) < T, and we can added pixel m to the region of pixel n. We can now also consider the neighbors of m and add them again if they are similar.
1. The Proposed Algorithm
The learning algorithm of the proposed algorithm consists of 7 phases:
Phases 1:In the region growing segmentation, the first aim is to determine the initial seed points and threshold value.
Phases 2:The size of the image is calculated for checking the condition of the loop.
Phases 3:Compare the first initial seed point with neighboring pixels according to threshold value.
Phases 4: We can add neighboring pixels to the region, if these are similar to seed point. For example, we can add pixel q to the region of pixel p, if (p-q) < T for some threshold T.
Phases 5 : Region growing should stop when no more pixels are found to meet the criteria for inclusion in that region. Then, another seed point is selected which does not belong to any other region.
Phases 6:This process is continued until all pixels (equal to the size of the image) belong to one region.
Phases 7: Finally, the area of the regions is calculated.
Indeed, segmentation is a process that partitions an image like R into ‘n’ sub regions, like R1, R2, and R3, …, Rn, such that:
n R i = R (1)
i = 1
R i R j = ø for all I and j, i≠j (2)
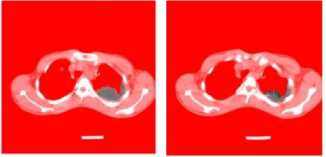
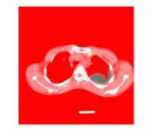
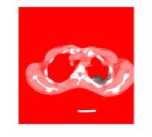
The first condition indicates that the segmentation is completed, which occurs when each pixel belongs to a region. The second condition indicates that the region must be disjoint. The presented region growing segmentation algorithm is applied for four different lung images and the outcome results are displayed in Fig 3.
(a) (b)
(c) (d)
Fig 3. The results of the region growing segmentation algorithm
-
C. Decision Making Based on Fuzzy Inference System (Fis)
Clustering is the process of dividing the data into sub classes. Different kinds of clustering algorithms have been developed in the literature. Fuzzy Clustering has been utilized in various fields such as pattern recognition and Fuzzy identification. Diagnosis plays a major role in medical care. The aim of this step is to determine the diagnostic power of a fuzzy classifier and a marker panel for detecting lung cancers in comparison to asbestosis patients at high-risk of developing lung cancer [13].
A FIS is regarded as a method of mapping an input space to an output one with the aid of fuzzy logic (by IF-THEN rules). FIS can be designed by using different architectures to enhance the performance of the system. Three points must be considered: finding the optimal number of the rules, selecting the appropriate membership functions, and tuning of both [18] . Fig 4 illustrates the architecture of our designed FIS. This Fuzzy system has two inputs of ‘color’ and ‘area’, and one output of ‘diagnosis’.
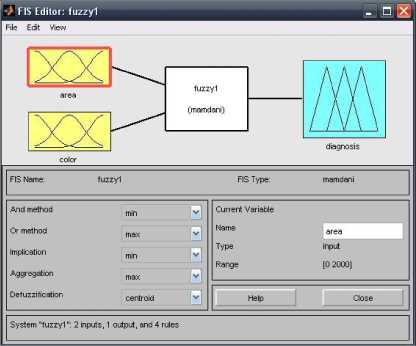
Fig4. The architecture of Fuzzy system
In this article, an expert system has been developed which works with fuzzy rules. An expert system is a system which simulates the knowledge of a human expert. An expert system:
-
• Works with a large database of knowledge.
-
• Allows the database to be accessed.
-
• Has a set of rules and, with its inference engine, makes deductions [19] .
For example, in this research, expert systems are being used for lung cancer diagnosis. The details of the image such as color and area are input, and the output of the system is the diagnostic type of the tumor, like Benign, Malignant or Advanced. The system cannot to get facts wrong or forget. The computer can have access to the expertise that a doctor may not possess or may be wrong.
As is shown in Fig 4, the fuzzy system has three layers. The first layer displays the input variables. The second displays fuzzy rules and the third displays the output variables. Hence, Fuzzy inference system is used to recognize the nodule based on fuzzy membership functions, the input and output. This Fuzzy system has two inputs, ‘color’, and ‘area’ with one output, ‘diagnosis’, and the rule base containing four fuzzy if-then rules.
As is shown in Fig 5, the range of the ‘color’ is taken from 1 to 255 which are separated into two sections, 'low' and 'high' that are in the form of triangle and trapezius. So, the range of the ‘area’ is taken from 1 to 5000 that are also separated into two sections, 'low' and 'high', in the form of trapezius. the range of the output ‘diagnosis’ is taken from 1 to 2 that are again separated into four sections ‘None’ , 'Benign', ‘Malignant’ and ‘Advanced’, in the form of triangle, as shown in Fig 6.
One of the most important problems in fuzzy clustering algorithms is how to design membership functions. According to research done, one comes across with some the membership functions (IF-THEN rules) that are used to detect the lung nodules (Fig 7) and the rule viewer (Fig 8). The rule viewer shows that the given CT scan image is of the malignant type, because the output is 1.75, which is in the range of 1.5 to 2. The area input of fuzzy inference system is 2800 (high) and the color (grey value) is 127.5 (low), hence, the output is of malignant type.
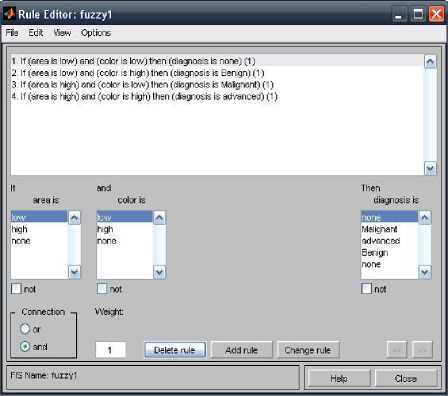
Fig7. The membership function (IF-THEN rule)
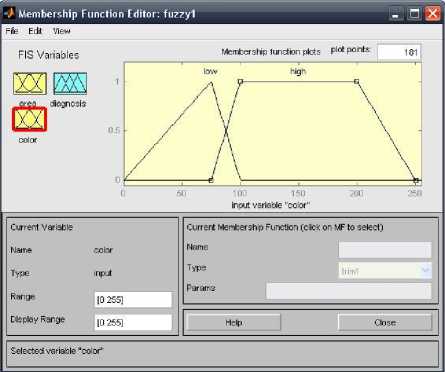
Fig5. The input ‘color’
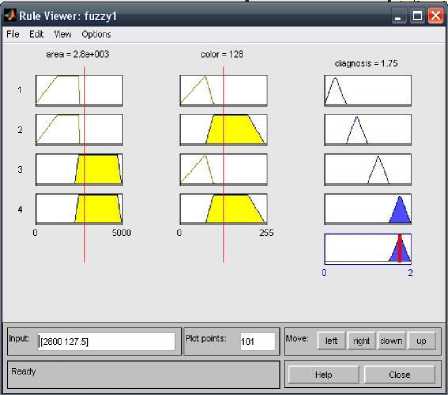
Fig8. The rule viewer
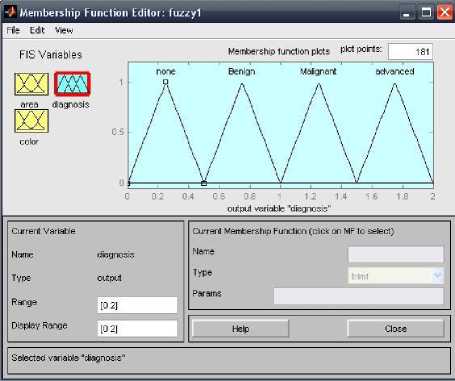
Fig6. The output ‘diagnosis’
-
D. Testing Result by Using Artificial Neural Network (Ann)
To obtain the accurate of the fuzzy system the artificial neural network are using. In this method, based on the input and output of the fuzzy system, a neural network is trained. After the testing phase, system error is measured. It is worth noting that, this phase of the work has been done with the help of an expert.
A neural network is a powerful data modeling tool that is able to capture and represent complex input/output relationships. The motivation for the development of neural network technology stemmed from the desire to develop an artificial system that could perform "intelligent" tasks similar to those performed by the human brain. Neural networks resemble the human brain in the following two ways:
-
1. A neural network acquires knowledge through learning.
-
2. A neural network's knowledge is stored within inter-neuron connection strengths known as synaptic weights.
The true power and advantage of neural networks lies in their ability to represent both linear and non-linear relationships and in their ability to learn these relationships directly from the data being modeled. Traditional linear models are simply inadequate when it comes to modeling data that contains non-linear characteristics. Artificial neural networks represent a type of computing that is based on the way that the brain performs computations. Neural networks are good at fitting non-linear functions and recognizing patterns. Consequently, they are used in the aerospace, automotive, banking, defense, electronics, entertainment, financial, insurance, manufacturing, oil and gas, robotics, telecommunications, and transportation industries.
neural networks are tools that have application in many areas, the course could be of interest to students from a variety of disciplines: students in electrical engineering who have an interest in signal or image processing, or control systems, students in CS with interests in data mining, AI, biometrics or computer vision, students in math with interests in nonlinear modeling, students in neuroscience with interests in computational neuroscience, students in finance with interests in financial modeling and prediction, students in biology with interests in bioinformatics [20] .
The most common neural network model is the multilayer perceptron (MLP). This type of neural network is known as a supervised network because it requires a desired output in order to learn. The goal of this type of network is to create a model that correctly maps the input to the output using historical data so that the model can then be used to produce the output when the desired output is unknown. In other words, artificial neural network are generally known as highly sophisticated analytical techniques being able to model complex non-linear functions. A graphical representation of the MLP using in this paper is shown below (Fig9). ANN is widely used in various fields such as image processing, system modelling, control and recognition. The development of multi layered model for a particular field involves many issues that affect its performance [21] .
This model is a three-layer feed forward ANN with a 2-3-1 nodal architecture. As is shown, this system has two inputs (feature) of ‘color’ and ‘area’, and one output of ‘diagnosis’. The input layer contained two neurons for the two clinical features findings on CT. The hidden layer contained three neurons with tansig function. The number of neurons in hidden layer was decided experientially, as is commonly done in applications of ANNs [15] . Finally, the output layer had one neuron with the purelin function, giving the value of output in the range of 0 to 2.
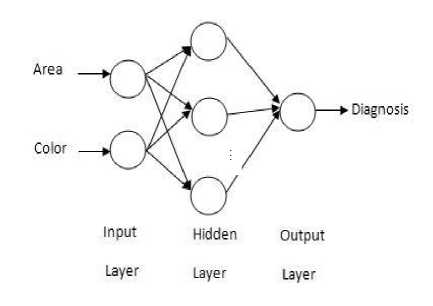
Fig9. Architecture of the MLP (three layer artificial neural network)
The following of system identification (function approximation) and after the feature extraction phase, the model generation phase is done. This phases are known train phase because the system is trained how to recognize the data sample class and use them later. Then, the test phase is done and Percentage of test error and train error is calculated. The graphical representation of this phase, which is known Classification phase, is shown below (Fig10).
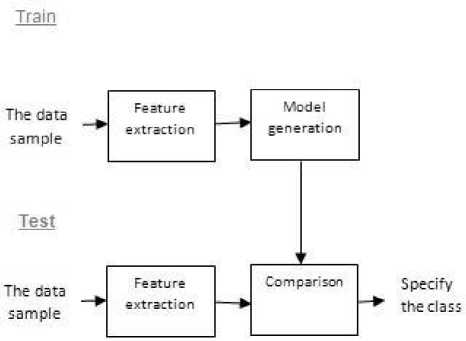
Fig10. Classification phase
The result of the system is shown in Fig 11. Since the Circular points are close to the color lines, represents a good performance in the system. As is known, the system is 95% accurate. Fig 12 represents the performance of the neural network. Indeed, one of the major advantages of neural nets is their ability to generalize. This means that a trained net could classify data from the same class as the learning data that it has never seen before. In real world applications developers normally have only a small part of all possible patterns for the generation of a neural net. To reach the best generalization, the dataset should be split into three parts:
-
1. The training set is used to train a neural net. The error of this dataset is minimized during training.
-
2. The validation set is used to determine the performance of a neural network on patterns that are not trained during learning.
-
3. A test set for finally checking the overall performance of a neural net.
Fig12 shows a typical error development of a training set (lower curve) and a validation set (upper curve). The learning should be stopped in the minimum of the validation set error. At this point the net generalizes best. When learning is not stopped, overtraining occurs and the performance of the net on the whole data decreases, despite the fact that the error on the training data still gets smaller. After finishing the learning phase, the net should be finally checked with the third data set, the test set. Finally, percentage of test error is 0.0542 and percentage of train error is 0.0038.
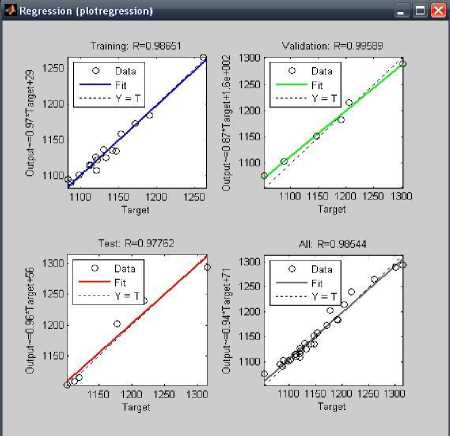
Fig11. The regression of the neural network
After preprocessing of the image, image segmentation was done by using region growing segmentation for detection of lung cancer. The method was employed to segment an image into different regions, using a set of seeds. As we know, diagnosis plays a major role in medical care.
Also differentiating between benign and malignant abnormality is difficult. The aim of this work is to minimize the human errors in catching and interpreting points that may be neglected by the radiologist. A decision making systems based on FIS was utilized for this purposed. This step was done by extracting the features such as area and color (gray values) and was given as the input to the system. The systems employ membership functions that may be expressed in the form if-then rules to find the type of the abnormality. Afterwards, this paper is comparing the diagnostic performances of FIS system by using ANNs. This method is applied to 1000-tumor contained 10000 CT slices from 1000 lung tumor patients. The experimental results for 4-tumor images are shown in Table 1. The accuracy of the proposed systems was 95%, which means that this system can help the radiologists to increase their diagnostic confidence. In the future, we are trying to obtain the more accurate method for image segmentation. Also, for future development method, we can focus on the better threshold selection, appropriate filtering method and better membership functions.
TABLE 1. The result of the proposed method
Shape
After region growing segmentation
The result
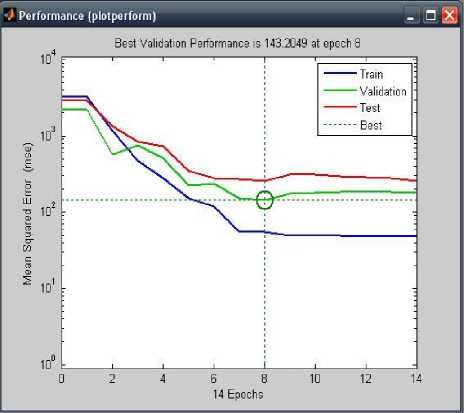
Fig 12. The performance of the neural network
1.75 Advanced
1.47 Malignant
0.25 None
III. ANALYSIS PHASE AND CONCLUSION
In this section, we will present the results obtained from our proposed method. To prepare the image for segmentation, pre-processing was carried out by contrast enhancement and removing undesirable noises. Linear-filtering was used for noise removal in this paper.
0.75 Benign
References Mass Detection in Lung CT Images Using Region Growing Segmentation and Decision Making Based on Fuzzy Inference System and Artificial Neural Network
- F. Taher1, N. Werghi, H. Al-Ahmad, and R. Sammouda, "Lung Cancer Detection by Using Artificial Neural Network and Fuzzy Clustering Methods," American Journal of Biomedical Engineering, vol. 2, pp. 136-142, 2012.
- G. DeNunzio, A.Massafra, R.Cataldo, I.DeMitri, M.Peccarisi, M.E.Fantacci, et al., "Approaches tojuxta-pleural nodule detection in CT images within the MAGIC-5 Collaboration," Nuclear Instruments and Methods in Physics Research, pp. 5103-5105, 2011.
- X.-Y. Wang and J. M. Garibaldi, "Simulated Annealing Fuzzy Clustering in Cancer Diagnosis," Department of Computer Science & Information Technology, vol. 29, pp. 61–70, 2005.
- K. KW and V. B, "Genetic Basis of Human Cancer.McGraw-Hill," 2002.
- M. F and F. CHG, "Molecular Biology of Cancer.Springer-Verlag New York, Incorporated," 1997.
- L. MS and S. GV, "Genetics of Cancer: Genes Associated With Cancer Invasion, Metastasis and Cell Proliferation. Academic Press , London.," 1997.
- K. R and T. M, "Molecular Biology in Cancer Medicine.Pearson education, Harlow," 1999.
- S. E. Mahmoudi, A. Akhondi-Asl, R. Rahmani, S. Faghih-Roohi, V. Taimouri, A. Sabouri, et al., "Web-based interactive 2D/3D medical image processing and visualization software," computer methods and programs in biomedicine, vol. 9 8, pp. 172–182, 2010.
- T. Manikandan and N. Bharathi, "Lung Cancer Diagnosis from CT Images Using Fuzzy Inference System," Communications in Computer and Information Science vol. 250, pp. 642-647, 2011.
- J. Quintanilla-Dominguez, B. Ojeda-Magaña, M. G. Cortina-Januchs, R. Ruelas, A. Vega-Corona, and D. Andina, "Image segmentation by fuzzy and possibilistic clustering algorithms for the identification of microcalcifications," Sharif University of Technology Scientia Iranica, vol. 18, pp. 580–589, Received 21 July 2010; revised 26 October 2010; accepted 8 February 2011 2011.
- S. A. Kumar, Dr.J.Ramesh, Dr.P.T.Vanathi, and Dr.K.Gunavathi, "ROBUST AND AUTOMATED LUNG NODULE DIAGNOSIS FROM CT IMAGES BASED ON FUZZY SYSTEMS," IEEE, pp. 1-6, 2011.
- X.-Y. Wang and J. M. Garibaldi, "Simulated Annealing Fuzzy Clustering in Cancer Diagnosis," Automated Scheduling, Optimisation and Planning (ASAP) Research Group, Department of Computer Science & Information Technology, The University of Nottingham, Jubilee Campus, Wollaton Road, United Kingdom, vol. 29, pp. 61-70, 2005.
- J. SCHNEIDER, N. BITTERLICH, N. KOTSCHY-LANG, W. RAAB, and H.-J. WOITOWITZ, "A Fuzzy-classifier Using a Marker Panel for the Detection of Lung Cancers in Asbestosis Patients," ANTICANCER RESEARCH, vol. 27, pp. 1869-1878, 2007.
- J. G. Moreno-Torres, X. Llorà, D. E. Goldberg, and R. Bhargava, "Repairing fractures between data using genetic programming-based feature extraction: A case study in cancer diagnosis," Contents lists available at ScienceDirect Information Sciences, pp. 1-19, 2010.
- H. Chen, J. Zhang, Y. Xu, B. Chen, and K. Zhang, "Performance comparison of artificial neural network and logistic regression model for differentiating lung nodules on CT scans," Expert Systems with Applications, vol. 30, pp. 11503–11509, 2012.
- J. Jiang, P. Trundle, and J. Ren, "Medical image analysis with artificial neural networks," Computerized Medical Imaging and Graphics, vol. 34, pp. 617–631, 2010.
- B. S. Morse, Lecture 18: Segmentation (Region Based), 1998-2000.
- E. Al-Daoud, "Cancer Diagnosis Using Modified Fuzzy Network," presented at the Universal Journal of Computer Science and Engineering Technology, 2010.
- A. Keles, A. Keles, and U. u. Yavuz, "Expert system based on neuro-fuzzy rules for diagnosis breast cancer," Contents lists available at ScienceDirect: Expert Systems with Applications, vol. 38, pp. 5719–5726, 2011.
- P. M. Hagan, Neural Network Design vol. Session A, June 4 to July 6, 2007.
- D.K.chaturvedi, "Factors Affecting the Performance of Artificial Neural Network Models," Soft Computing techniques and its application in electrical engineering. Studies in Computational Intelligence (SCI), vol. 103, pp. 51-85 2008.
