Measurement of temperature distribution using a three-wire system of sensors based on thermistors

Author: Derevyanko V.A., Makukha A.V.
Journal: Сибирский аэрокосмический журнал @vestnik-sibsau
Section: Авиационная и ракетно-космическая техника
Article in issue: 3 т.20, 2019.
Free access
Improving the reliability and increasing the avionics resource is associated with possibility of continuous control of temperature fields of printed circuit boards. This problem can be solved only with the use of a large number of temperature sensors. It raises the problem of connecting the measuring elements and recording equipment. Several methods with their own advantages and disadvantages are proposed. One of the implemented and patented methods is using a set of resistive diode sensors installed in series on a threewire line. The temperature sensors are pairs of counter - connected diodes with a sequential survey when applying sawtooth voltage. The system is simple and easy to implement, but its main drawback is the method of determining the temperature by measuring the amplitude of the total reverse currents of diode pairs. It determines the large measurement errors, especially in the temperature range less than 20°C. The article deals with a similar design of a three-wire circuit, but with a fundamentally different approach to temperature measurement. The temperature sensor here is not diode pairs, but thermistors with a well-known dependence of resistance on temperature and high accuracy, and diode pairs record only the moment of coincidence of the sawtooth voltage with the voltage on the thermistors. This approach allows using mathematical methods of signal processing to accurately determine the voltage drop on the thermistor, and this ensures the accuracy of the resistance/temperature and the expansion of the temperature range. Given the fact that thermistors are increasingly used to measure temperature, simplifying their inclusion in a large number will allow to register the temperature field of electronic units, which is extremely important for spacecraft. The proposed version of a three-wire circuit for connecting temperature sensors at several points was tested experimentally, including at negative temperatures.
Thermistor, counter-connected diodes, three-wire temperature measurement circuit
Short address: https://sciup.org/148321926
IDR: 148321926 | UDC: 53.072.8 | DOI: 10.31772/2587-6066-2019-20-3-334-343
Измерение распределения температуры с помощью трехпроводной системы датчиков на основе термисторов
Повышение надежности и увеличение ресурса радиоэлектронной аппаратуры космических аппаратов связывают с возможностью непрерывного контроля температурных полей печатных плат. Такая задача может быть решена только с использованием большого количества датчиков температуры. При этом возникает проблема подключения измерительных элементов и регистрирующей аппаратуры. Предложено несколько способов, имеющих свои достоинства и недостатки. Одним из реализованных и запатентованных способов является использование набора резистивно-диодных датчиков, установленных последовательно на трехпроводной линии. Датчиками температуры являются пары встречно включенных диодов с последовательным опросом при подаче пилообразного напряжения. Система простая и легко реализуемая, но её основной недостаток заключается в способе определения температуры по измерению амплитуды суммарных обратных токов диодных пар. Именно этим определяются большие погрешности измерения, особенно в области температур меньше 20 °С. В статье рассматривается аналогичная конструкция трехпроводной цепи, но с принципиально иным подходом к измерению температуры. Датчиком температуры здесь являются не диодные пары, а термисторы с хорошо известной зависимостью сопротивления от температуры и высокой точностью, а диодные пары фиксируют только момент совпадения величины пилообразного напряжения с напряжением на термисторах. Такой подход позволяет использовать математические методы обработки сигналов для точного определения падения напряжения на термисторе, а это обеспечивает и точность определения сопротивления / температуры и расширения температурного диапазона измерений. Учитывая то, что термисторы все чаще используются для измерения температуры, упрощение схемы их включения в большом количестве позволит регистрировать температурное поле радиоэлектронных блоков, что крайне важно для космических аппаратов. Предложенный вариант трехпроводной схемы подключения датчиков температуры в нескольких точках проверен экспериментально, в том числе и при отрицательных температурах.
Text of the scientific article Measurement of temperature distribution using a three-wire system of sensors based on thermistors
Introduction. Many years of experience in testing electronic equipment in the space industry showed that 80 % of electromechanical failures are associated with various thermal effects on the equipment and 20 % of failures are caused by various types of vibrations and impact, therefore the close attention is paid to monitoring the thermal operating conditions of avionics.
The method currently used provides for temperature control with help of temperature sensors installed in the immediate vicinity of radio electronic components.
To get real information about the temperature field distribution of electronic components and to monitor the thermal conditions of avionics in real time a large number of temperature sensors are required [1–5] (several dozen sensors on each board and several hundred ones in the device).
There are devices for measuring temperature fields with thermoelectric sensors in the form of paired heterogeneous conductors [6]. The disadvantages of these devices include the complexity of their implementation (the need to isolate electrical conductors from the object and stabilize the temperature of the sensors leads).
Widespread resistance thermometers [7] have a complex system of separate power supply and registration which complicates to use a large number of these sensors on an electronic circuit board. This is due to the complexity of the connector wiring as well as sensor addressing and interrogation.
There are devices for measuring the temperature fields using a thermoelectric sensor in the form of a grid with quadrangular cells of m and n heterogeneous conductors connected at the intersection and forming columns and rows, respectively, by measuring thermal electromotive force between the output ends of conductors [8].
In [9] it was proposed to use distributed resistive diode sensors which allow installing up to tens of sensors with a sequential survey in series on a three-wire line. This method is based on the measurement with temperature-sensitive elements Ti consisting of counter-connected identical diodes DDi and two equal resistors R (fig. 1). The number of lead wires in this measurement scheme is three. The constant voltage source 1 is connected to the thermal sensitive elements via wires U 1 and U 3. The harmonic voltage source 2 and the signal recorder 3 are connected via wires U 1 and U 2.
The principle of temperature measuring is as follows: since the constant voltage source 1 is connected to a voltage divider of 2 N identical resistors with resistance R the total differential resistance of the on-board diodes becomes minimal when the harmonic signal from the source 2 increases at the moment when the voltage across the diode pair DDi is equal to zero. The change in current through the diode pair is measured by the recorder 3 and processed. The signal is differentiated and the temperature of the thermal sensitive element Ti which number is determined by the order of the following peaks is calculated by the peak amplitude of the derivative. The measuring tool in this case is a diode pair. This construction highly facilitates the sensors placement and simplifies the system of interrogation and registration.
However, semiconductor diodes act here as a thermal sensitive element and its reverse saturation current depends on temperature. The main disadvantage of this method is the need of preliminary calibration of diode pairs and nonlinear dependence of the temperature on the signal magnitude. Radiation-resistant silicone or galliumarsenide diodes are used in space industry. Their reverse currents are much smaller than germanium diodes ones and therefore they can be used in the amplitude measurement method on resistive-diodes circuits only in the temperature range above 20 ° C. Measurements errors are larger at lower temperatures.
Problem formulation. An undoubted advantage of distributed resistive-diodes temperature sensors is the possibility of their sequential polling on a three-wire line with the temporary addressing. The disadvantage is the amplitude method for recording the total saturation current of diodes which magnitude depends on many factors: the type of diode, the recorded temperature, the coincidence of the diode pair reverse currents, the influence of parallel-connected diode pairs and the interference taking into account large values of the diodes inverse resistance.
Taking into account all the problems of the semiconductor diodes the thermistors were considered as temperature sensors [10–12] Rx 1 , …, Rx N (fig. 2), and diode pairs are used to fix the moment when the harmonic signal voltage Up i coincides with the voltage Ux i in the corresponding point of the voltage divider [13]. The Rx 0 resistor (with minimal temperature resistance coefficient) acts as a calibration resistance.
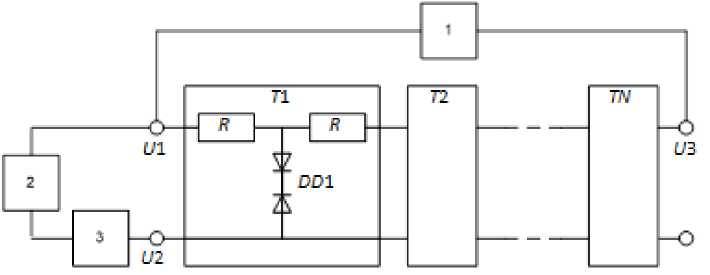
Fig. 1. Measurement scheme in the patent
Рис. 1. Схема измерений в патенте
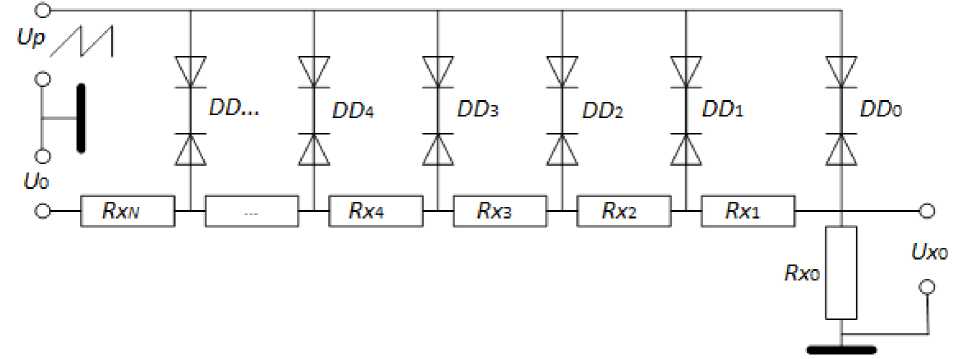
Fig. 2. Measurement scheme in the experiment
Рис. 2. Схема измерений в эксперименте
The constant voltage U 0 is supplied through one wire to a divider composed of N thermistors Rxi . The sawtooth voltage Up is supplied through the second wire to diode pairs DDi which are connected to the voltage divider. The signal Ux 0 from the resistor Rx 0 on the third wire is differentiated and the voltage between the two thermistors is determined by the maximum peak amplitude of the derivative. The number of thermistor is determined by the order of the following peaks. Thus, the thermistor voltage is determined by the time of the diode pair peaks and it significantly increases the measurement accuracy.
Experiment results. To verify the method effectiveness an installation based on the measuring complex LTR was assembled. Series connected thermistors operating in the temperature range from +20 to +80 °С were replaced by calibrated resistances measured to the fourth digit. For definiteness the values of calibrated resistances and the corresponding temperature calculated for MF521021k thermistors with resistance R 0 = 1.0 kilo-ohm ± 1.0 % when Т 0 = 25 °С or R 0 = 510 ohm ± 1.0 % and the temperature coefficient В = 4000 1/°К are shown on tab. 1. The temperature value Tx N for each Rx N is calculated by the formula
Tx N
= 1 +1 Ln [ R N ] . T o B I R 0 )
The sawtooth voltage Up and the constant voltage to the divider U 0 = 10 V came from the LTR34-8 digital-to-analog converter. The Up and Ux 0 voltage at the calibration resistance was measured by a 14-bit LTR11 AD converter (fig. 3).
The figure also shows the time derivative dUx 0 / dt of the measured signal on an enlarged scale as well as Ux 0 . Each peak of the derivative dUx 0 / dt is marked with the corresponded diode pair DD i on which the signal increment Ux 0 and the sawtooth voltage value Upi = Uxi at a given time passed.
Since the current through the diode pairs was three orders of magnitude less than the current through the divider they were neglected in the calculations. Therefore, from the constancy of the current through the thermistors and the calibration resistance, the thermistor resistance was calculated by the formula
Rx i =
Ux i - UX - 1
Ux 0
Rx 0 . .
Table 1
Temperature matching for experimental resistors
|
Rx 1 |
Rx 2 |
Rx 3 |
Rx 4 |
Rx 5 |
Rx 6 |
Rx 7 |
||
|
R 0 |
911.7 |
121.4 |
702.8 |
391.8 |
452.4 |
217.4 |
453.5 |
|
|
1 kilo-ohm |
Tx N (°C) |
27.1 |
80.6 |
33.0 |
47.4 |
43.7 |
63.3 |
43.7 |
|
510 ohm |
Tx N (°C) |
12.6 |
60.7 |
18.0 |
31.0 |
27.7 |
45.2 |
27.6 |
As diode pairs germanium and silicone diodes of different purposes were used (tab. 2). The reverse current J D was measured at a reverse voltage of 20 V and an ambient temperature of +20 °С.
In the tab. 3 the results of five measurements, the average measured value of resistance and the deviation from the exact value are shown.
The selection of diode pairs exerts a great influence on the measurement accuracy. A preliminary selection for the same reverse current is required. At different currents with differentiation Ux 0 asymmetric peaks were obtained at Ux i = Up i . Because of this there was a shift in one or another direction from the peak maximum and, accordingly, a distortion of measurement results. It is clearly demonstrated by the data given in tabl. 2 and 3. An imbalance of reverse currents in the diode pair DD 1 affects the Rx 1 , Rx 2 and DD 4 as well as Rx 4 measurement accuracy.
Temperature range check. Testing of the proposed temperature measurement scheme was carried out in a narrow temperature range of the board and diodes from 20 to 25 °С. Of special interest is the measurement of devices thermal regimes at negative temperatures. For this purpose in fig. 2 all diodes were replaced by diode pairs from D311А with the same reverse current according to tab. 4.
TP018-02 thermistor was glued to the board base. Its resistance was measured by the H-27R-100 submodule and converted to temperature by a computer. In range from 10 to 20 °С all measurements were carried out according to the well-functioning scheme. At lower temperatures the voltage gain Δ Ux 0 = Ux 0( t ) – Ux 0 min is reduced by repeatedly reducing the reverse current of diode pairs. Thus, the signal itself decreased many times and the peaks of the derivative dUx 0 / dt couldn’t be distinguished against the background of interference due to the discreteness of digitalization (fig. 4).
In this case it is necessary to apply averaging over K measurement. Random noise during averaging decreased
K times and the useful signal was clearly distinguished. The averaging results over 16 and 1024 measurements and the temperature TR = 9.2 °C and TR = –10.3 °C, respectively, are shown on fig. 5 and 6.
Experimental data processing was reduced to the time derivative dUx 0 / dt transition, to the dependence not on time but on the sawtooth voltage F ( Up ) = dUx 0 / dt with the received signal post-processing. Since, due to a small change in the signal Ux 0 and the discreteness of its digitalization large interference noise arose and there were problems with determining the exact voltage value Uxi = Upi , a special technique was used [14; 15].
ЛОДв)
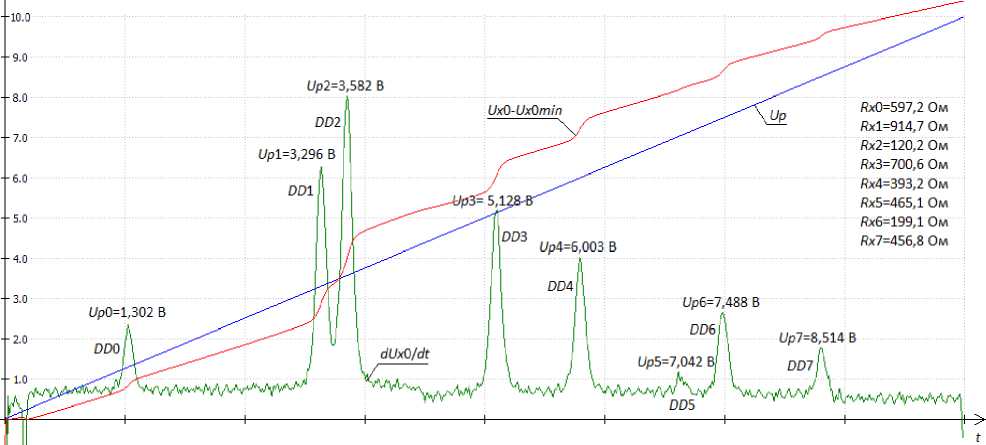
Fig. 3. Results of measurement of Up and Ux 0 (µV) versus time
Рис. 3. Результаты измерения Up и Ux 0(мкВ) в зависимости от времени
Table 2
|
DD 0 |
DD 1 |
DD 2 |
DD 3 |
DD 4 |
DD 5 |
DD 6 |
DD 7 |
|
|
Type |
IN5819 |
D311А |
D311А |
D311А |
SR360 |
IN5819 |
2D213А |
D223 |
|
JD (μA ) |
5.3 |
12.4 |
16 |
15.0 |
7.9 |
2.5 |
4.8 |
1.8 |
|
5.1 |
20.2 |
15.1 |
14.8 |
4.5 |
2.6 |
5.2 |
4.6 |
Table 3
|
Exact value |
Experimental value |
Average value |
Error, % |
|||||
|
Rx 0 |
597.2 |
№ 1 |
№ 2 |
№ 3 |
№ 4 |
№ 5 |
‹ Rx i › |
|
|
Rx 1 |
911.7 |
926.2 |
924.5 |
928.1 |
934.3 |
929.2 |
928.46 |
1 84 |
|
Rx 2 |
121.4 |
119.2 |
118.8 |
118.7 |
118.2 |
118.4 |
118.66 |
–2,26 |
|
Rx 3 |
702.8 |
705.2 |
704.6 |
705.9 |
710.1 |
707 |
706.56 |
0.54 |
|
Rx 4 |
391.8 |
400.8 |
399.7 |
400.6 |
402.3 |
402.1 |
401.1 |
2.37 |
|
Rx 5 |
452.4 |
455.9 |
457.2 |
456.7 |
458.7 |
458 |
457.3 |
1,08 |
|
Rx 6 |
217.4 |
214.4 |
212.9 |
214.2 |
216.5 |
213.2 |
214.24 |
–1.45 |
|
Rx 7 |
453.5 |
453.9 |
454.4 |
456.1 |
455 |
457.4 |
455.36 |
0.41 |
Types and characteristic of diode pairs
Accurate and measured characteristics of experimental resistors
Table 4
Diode pairs with the same reverse current
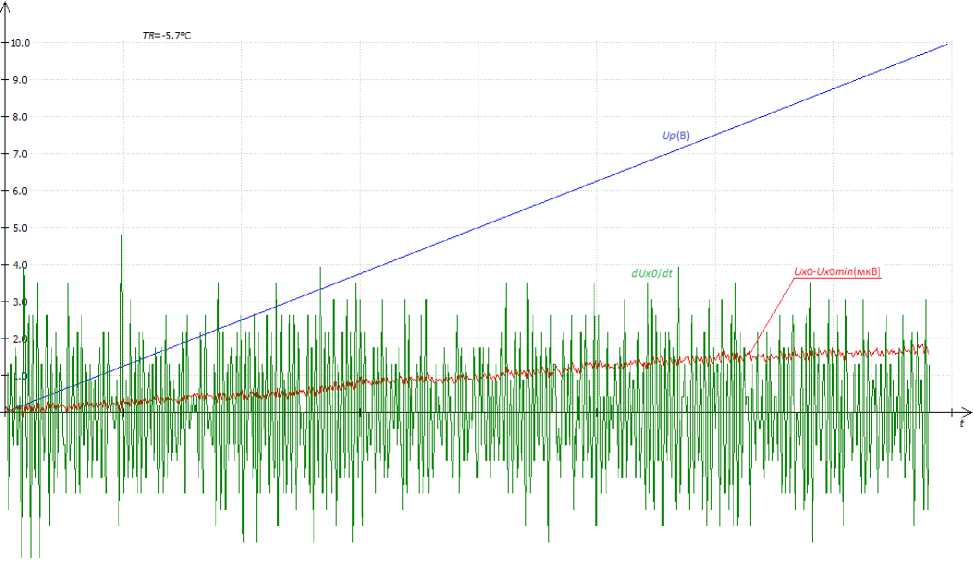
Fig. 4. The results of Ux 0 measurement and processing depending on the time at the board temperature TR = –5.7 °C. The scale for Ux 0 and dUx 0 / dt is increased 10 times
|
DD 0 |
DD 1 |
DD 2 |
DD 3 |
DD 4 |
DD 5 |
DD 6 |
DD 7 |
|
|
Type |
D311А |
D311А |
D311А |
D311А |
D311А |
D311А |
D311А |
D311А |
|
JDD (μA ) |
18.5 |
18.5 |
24.0 |
16.0 |
17.2 |
19.2 |
20.0 |
21.5 |
Рис. 4. Результаты измерения и обработки Ux 0 в зависимости от времени при температуре платы TR = –5,7 °C. Масштаб по Ux 0 и dUx 0/ dt увеличен в 10 раз
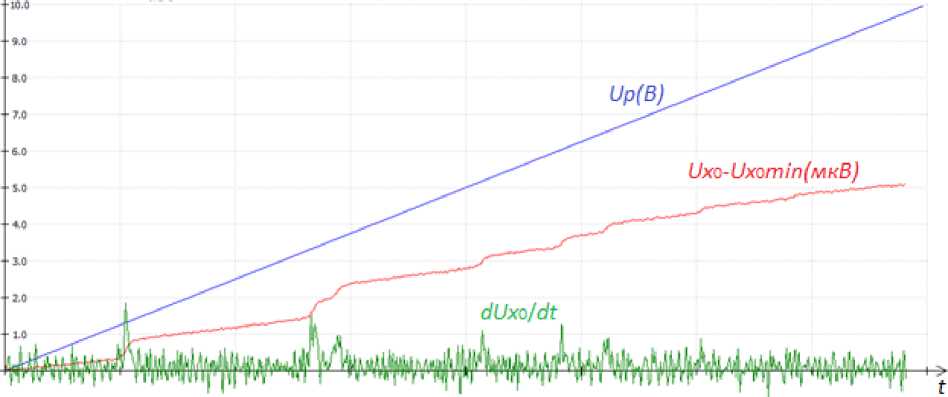
Fig. 5. Averaging results Δ Ux 0 = Ux 0 ( t ) – Ux 0min and dUx 0 / dt over 16 measurements
Рис. 5. Результаты усреднения Δ Ux 0 = Ux 0( t ) – Ux 0min и dUx 0/ dt по 16 измерениям
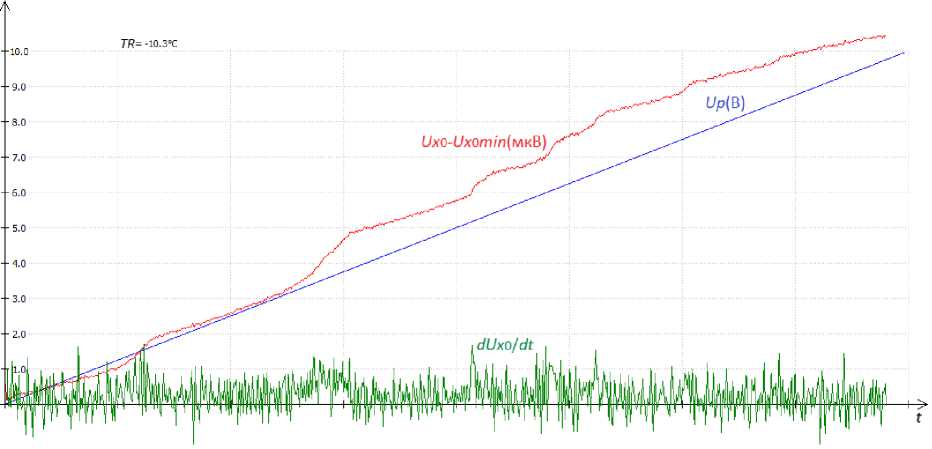
Fig. 6. Results of averaging Δ Ux 0 = Ux 0 ( t ) – Ux 0min and dUx 0 / dt over 1024 measurements. The scale for Ux 0 and dUx 0 / dt is increased 100 times
Рис. 6. Результаты усреднения Δ Ux 0 = Ux 0( t ) – Ux 0min и dUx 0/ dt по 1024 измерениям.
Масштаб по Ux 0 и dUx 0/ dt увеличен в 100 раз
|
For this, cross-correlation function k FG ( Up ) between F ( Up ) and G ( Up i - Up ) = e ''U i - Up , (2) was estimated by the formula Z ( F (Up ) - ( F (Up )) ) x kF0 ( Up ) = x ( G(Up i - Up )-( G ( UP - Up ») . (3) Z ( F(Up) - ( F(Up )}) 2 x \ x £ ( G(Up i - Up ) - ( G(Up i - Up )}) 2 |
Where the function G ( Up – Up ) looked like the peak in the derivative of voltage Ux 0 , and j< G (Up i - Up) = ^ = 1 GUN Up k ), \u (Up )) = t FUl , L k = 1 N is average values of correlating functions over the summed range and Up i is the voltage at which dUx 0 / dt reaches maximum for each peak. |
The variable α in the function (2) changed during the method development for more accurate determination of thermistor resistance. It has been experimentally established that the best value for 1/α in the formula (2) is a value in range 0,1 ÷ 0,2 V.
At lower values the peaks broaden and, accordingly, the exact determination of the maximum worsens. In addition, at low values of thermistor resistance an overlap of two adjacent peaks is observed which leads to the de-
crease in the calculated value Rx i . At larger values false peak arise due to interference in the numerical determination of the signal Ux 0 .
For checking purposes the cross-correlation function k FG ( Up ) was constructed according the measurement results (fig. 4).
The maximum value kFG ( Up ) didn’t exceed the value 0.15 (fig. 7), and it was later used as a criterion for the results reliability (fig. 8, 9).
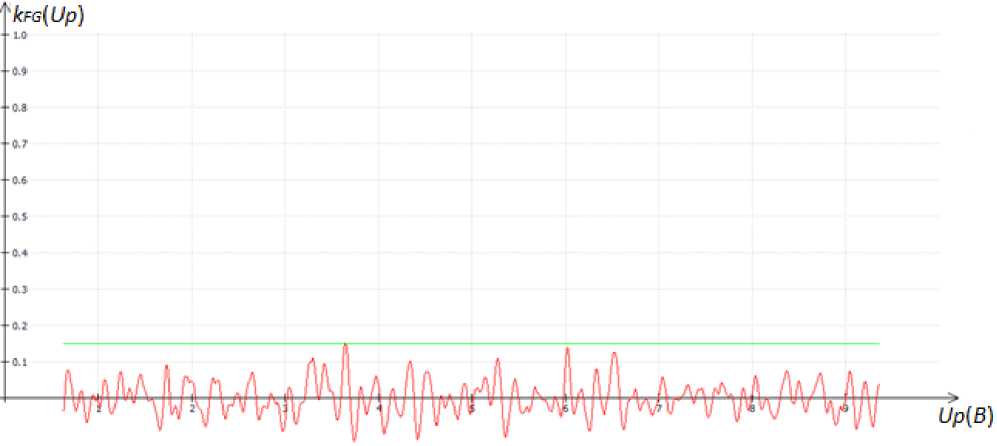
Fig. 7. Cross-correlation function according to the measurement results in fig. 4
Рис. 7. Кросскорреляционная функция по результатам измерения рис. 4
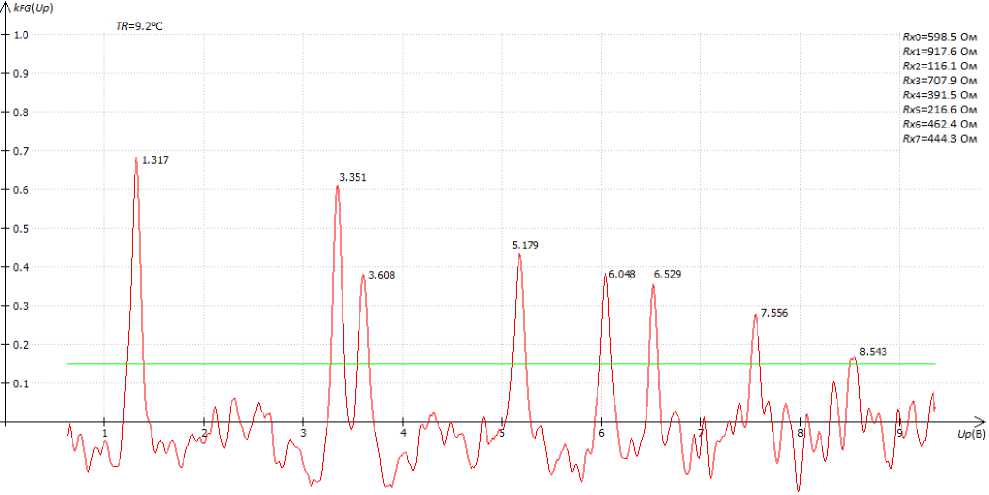
Fig. 8. Cross-correlation function according to the measurement results in fig. 5
Рис. 8. Кросскорреляционная функция по результатам измерения рис. 5
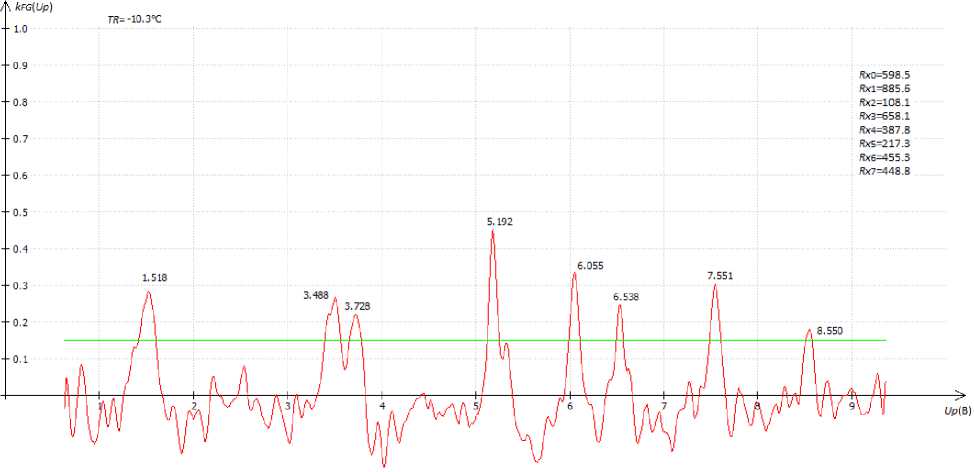
Fig. 9. Cross-correlation function according to the measurement results in fig. 6
Рис. 9. Кросскорреляционная функция по результатам измерения рис. 6
Statistical processing results for 7 thermistors
Table 5
|
N |
16 |
32 |
64 |
128 |
512 |
1024 |
|
|
T R (°C) |
9.2 |
7.6 |
3.8 |
–3.3 |
–3.9 |
–10.3 |
|
|
Rx 1 |
914.6 |
917.6 |
910.9 |
911 |
889.7 |
892.4 |
885.6 |
|
Rx 2 |
119.2 |
116.1 |
116.9 |
117.4 |
112.2 |
114.9 |
108.1 |
|
Rx 3 |
703.9 |
707.9 |
707.8 |
703.2 |
698.7 |
703.5 |
658.1 |
|
Rx 4 |
393.9 |
391.5 |
391 |
391.8 |
397.4 |
394 |
387.8 |
|
Rx 5 |
224.5 |
216.6 |
220.4 |
217.3 |
218.5 |
215.1 |
217.3 |
|
Rx 6 |
453.4 |
462.4 |
458.2 |
454.8 |
470.5 |
459.5 |
455.3 |
|
Rx 7 |
454.4 |
444.3 |
443.8 |
456.7 |
427.5 |
451.2 |
448.8 |
|
Δ Rx 1/ Rx 1 |
0.328 % |
–0.405 % |
–0.394 % |
–2.723 % |
–2.427 % |
–3.171 % |
|
|
Δ Rx 2/ Rx 2 |
–2.601 % |
–1.930 % |
–1.510 % |
–5.872 % |
–3.607 % |
–9.312 % |
|
|
Δ Rx 3/ Rx 3 |
0.568 % |
0.554 % |
–0.099 % |
–0.739 % |
–0.057 % |
–6.507 % |
|
|
Δ Rx 4/ Rx 4 |
–0.609 % |
–0.736 % |
–0.533 % |
0.889 % |
0.025 % |
–1.549 % |
|
|
Δ Rx 5/ Rx 5 |
–3.519 % |
–1.826 % |
–3.207 % |
–2.673 % |
–4.187 % |
–3.207 % |
|
|
Δ Rx 6/ Rx 6 |
1.985 % |
1.059 % |
0.309 % |
3.772 % |
1.345 % |
0.419 % |
|
|
Δ Rx 7/ Rx 7 |
–2.223 % |
–2.333 % |
0.506 % |
–5.920 % |
–0.704 % |
–1.232 % |
|
|
δ ср (N) |
1.690 % |
1.263 % |
0.937 % |
3.227 % |
1.765 % |
3.628 % |
|
The lower the temperature the greater number of N averages must be carried out in order to get a correct result. The lowest temperature at which it was still possible to process the signal was –10 °С at K = 1024 (fig. 6, 9).
Tab. 5 shows the measurement of thermistor simulators resistance at different temperatures TR (°C) of the board depending on the number of N averages and the relative measurement error Δ Rx i / Rx i . The last line shows the absolute average relative measurement error
5 ср ( N ) = Z >xW /7
depending on N measurements. It is clearly seen that at N = 128 and N = 512 and approximately equal temperature
5 ср (128) ~ 3,227 ~ /512 = 2
5ср (512) * 1,765 * \128 1"
This example confirms the correctness of the chosen statistical averaging method.
Conclusion. Thus, the use of thermistors as temperature sensors and diode pairs determining the addressing of the measuring elements allows the three-wire temperature measurement scheme in the range from –10 °С and above with an error of less than 4 % to be implemented.
Acknowledgments. The study was carried out with the financial support of the Russian Foundation for Basic Research, the Government of the Krasnoyarsk Territory, the Krasnoyarsk Regional Fund for Support of Scientific and Technological Activities in the framework of the project No. 18-47-242005.
References Measurement of temperature distribution using a three-wire system of sensors based on thermistors
- Деревянко В. А., Латыпов А. Ф. Восстановление распределения температуры среды в двумерной области томографическим методом по результатам измерений электрического сопротивления ориентированных проводников // Вычислительные технологии. 2018. № 23 (3). С. 31-38.
- Васильев Е. Н., Деревянко В. А. Анализ эффективности применения термоэлектрических модулей в системах охлаждения радиоэлементов // Вестник СибГАУ. 2013. № 4 (50). С. 9-13.
- Korneeva A., Shaidurov V. Computational algorithms for analysis of data from thin-film thermoresistors on a radioelectronic printed circuit board // Conference Proceeding of American Institute of Phisics. 2016. No. 1759. Art. 020048.
- Корнеева А. А., Шайдуров В. В. Численный анализ температурных данных с пленочных резисторов электронных плат // Вычислительные технологии. 2017. № 22 (3). C. 32-44.
- Шайдуров В. В., Корнеева А. А. Численный метод анализа нелокальных данных с пленочных терморезисторов электронных плат // Сибирские электронные математические известия. 2017. № 14. C. 914-926.
