Measuring Corporate Social Responsibility Based on a Fuzzy Analytical Hierarchy Process

Author: Shouming Chen, Jiasi Fan
Journal: International Journal of Computer Network and Information Security(IJCNIS) @ijcnis
Article in issue: 5 vol.3, 2011.
Free access
With increasing social awareness on the issue of corporate social responsibility (CSR), the measurement of CSR has received considerable attention in both academic literature and managerial practice. Following a review of CSR theory development and the literature on measures of CSR, this paper proposes a systematic approach to measure CSR using fuzzy analytical hierarchy process (FAHP). In addition, a preliminary investigation is presented to explain how the approach can help in evaluating CSR in practice.
Corpoarate social responsibility, FAHP, measurement, MCDM
Short address: https://sciup.org/15011035
IDR: 15011035
Text of the scientific article Measuring Corporate Social Responsibility Based on a Fuzzy Analytical Hierarchy Process
Published Online August 2011 in MECS 'll1 and Computer Science у ркея
The role that businesses play in our society has been a matter of discussion since the middle of the last century. The increasing pressures of business on humanity and the natural environment have raised concerns among people all around the world considerably. In current days, more responsible use of increased business power is anticipated by various stakeholders toward businesses. The term corporate social responsibility (CSR) may provide a general framework to describe the responsible behavior of a business and its social involvement. However, it is still problematic to find a commonly accepted definition of CSR, not to mention the evaluation of CSR. But, evaluating CSR is not only important for researchers to investigate the relationship between different organizational variables and CSR, but also crucial for stakeholders to employ social responsibility information during their decision making process. Therefore, in the rest sections, a) we first give our understanding to the CSR concept by reviewing the evolution of definition of CSR over time and; b) then we discuss the existing empirical efforts addressing the evaluation or measurement of CSR; c) we propose a new methodology for the measurement CSR.
-
II. Literature Review
-
A. The definition of CSR.
In the past 60 years, CSR have been serving as a core construct both in theory and practice throughout the world.
Tracing back into the 1950s which marks the modern era of CSR, it was mentioned more often as social responsibility (SR) rather than CSR due to the absence of modern corporation’s prominence and dominance in business sector. In 1953, Bowen [1] set forth a definition of the social responsibility of businessmen in his landmark book Social Responsibilities, considered by many as the initial definitive book on the subject. He defined the SR of businessmen as the obligations of businessmen to pursue those policies, to make decisions, or to follow those lines of action which are desirable in terms of the objectives and values of our society.
In 1960, Davis gave his definition of CSR as businessmen’s decisions and actions taken for reasons at least partially beyond the firm’s direct economic or technical interest [2].
A real debate raised by Friedman in 1962 argued that few trends could so thoroughly undermine the very foundations of our free society as the acceptance by corporate officials of a social responsibility other than to make as much money for their stockholder as possible [3].
However, McGuire stood in line with Davis and argued social responsibility as not only including but also extending beyond economic and legal obligations. By that, he elaborated corporation must take the responsibility in the politics, for the well-being of the community, in education, for the welfare of employees and in the whole world about it as a proper citizen should [4].
Davis revisited the concept of CSR in 1967 by adding how social responsibility gets one beyond the limited application of person-to-person contract and broadens one’s view to the whole social system [5]. At the same year, Walton, in his book Corporate Social Responsibility, presented many facets of CSR based upon his definition of social responsibility which indicates the intimacy relationship between the corporation and society. And a new ingredient of SR that he emphasized was a link with a degree of voluntarism which may not possible to bring any measurable economic returns [6].
In the 1970s, the definition of CSR had a proliferation. Beginning from Heald, who understood the term in the similar vein as presented in the 1960s and earlier [7]. Then, Johnson defined the CSR by saying that a responsible firm is one whose managerial staff balances multiplicity of interests. Instead of striving only for larger profits for stockholders, a responsible enterprise also takes into account employees, suppliers, dealers, local communities, and nations. Here, Johnson referred to “multiplicity of interests” hinting at the possibility of the stakeholder approach to understand the CSR definition [8].
Committee for Economic Development (CED) contributed to the evolution of CSR concept by suggesting a “three concentric circles” model in 1971. Specifically, the inner circle includes the clear-cut basic responsibilities for the efficient execution of the economic function — products, jobs, and economic growth. The immediate circle encompasses the responsibility to exercise this economic function with a sensitive awareness of changing social values and priorities, for example, with respect to environmental conservation, hiring and relations with employee, more rigorous expectation of customers for information, fair treatment, and protection from injury. The outer circle outlines newly emerging responsibilities that business should assume to become more broadly involved in actively improving the social environment [9].
In 1972, a major debate over the understanding of CSR was sponsored by American Enterprise Institute. The idea that CSR involves only pure voluntary acts was held by some economic professors such as Manne and Wallich [10]. Davis again entered the debate and discussed the argument to date both for and against business assumption of social responsibility. Then he gave the definition of CSR as social responsibility which begins with the law ends. Apparently, the definition was restricted to excluding the legal obedience, as part of corporate citizenship, of social responsibility [11].
Backman proposed another approach to the question what the social responsibility means involves a definition simply listing some areas in which should be viewed as corporate social responsibility. He identified some examples as employment of minority groups, reduction in pollution, greater participation in programs to improve the community, improve the medical care, improved industrial health and safety and other programs designed to improve the quality of life [12].
Sethi’s concept of corporate social responsibility is a continuum getting from social responsibility to social responsiveness. He distinguished a three-schema state of corporate behavior to social needs: (1) social obligation, involving corporate behavior in response to market force and legal constraints; (2) social responsibility, where corporate behavior is brought to a level congruent with the prevailing social norms, values and expectations; (3) social responsiveness, refers to corporate long-run role in a dynamic system [13].
Fitch proposed a problem-solving perspective of understanding the definition. He argued that a socially responsible firm must identify a social problem and then decide what to attack first during which a firm should make a distinction between social problems and non-social problems [14].
In 1978, Frederick articulated the responsive views which are recognized as CSR2. He noted that corporate social responsibility refers to the capacities of a corporate to response to the social pressure [15].
In 1979, Carroll proposed a four-part definition of CSR which embraces a full range of responsibilities of business to society including economic, legal, ethical and discretionary categories. Economic responsibility is the first and foremost responsibility of a business. As a basic economic unit of society, it has a responsibility to produce goods and service that society wants and to sell them at a profit. Legal responsibility represents ground rules under which business is expected to operate. Ethical responsibility refers to additional behaviors that are not codified into law but nevertheless are expected of business by society’s members. Discretionary responsibility is that purely voluntary behavior left to individual judgment and choice, not required by law and even in an ethical sense. These discretionary activities are analogous to the CED’s third circle. Each responsibility is one part of the total social responsibility, and a given business may simultaneously involve several these kinds of responsibilities [16].
In 1980s, there were fewer new definition but more empirical research and alternative themes such as CSP. Among the few, Jone presented an interesting perspective based her definition of CSR as an obligation to a constituent groups other than stockholders and beyond the law and union contract. She emphasized CSR as a process that how a firm could make CSR decision of what should constitute CSR behavior [17].
In 1983, Carroll elaborated on his 1979 four-part definition of CSR by discussing profitability and obedience to the law is foremost condition to evaluate the firm’s ethics. That is, the four part of the CSR have their priorities in terms of the importance. Besides, he also reoriented the discretionary responsibility as involving voluntarism and philanthropy [18].
Peter F. Drucker proposed a “new meaning” of CSR which stated the compatibility of profitability and responsibility. Maybe, his newer idea is that business ought to convert its social responsibilities into business opportunities [19].
Among a number of the empirical studying in the 1980s, one excellent example was the study seeking the relationship between CSR and profitability that published by Aupperle, Carroll, and Hatfield [20]. In the study, they separated “economic” form the “legal, ethical and discretionary”, with acknowledge that not everyone sees the economic responsibility as social responsibility but rather considers it as something that business do for themselves.
In 1990s, very few contributions to the definition CSR occurred. It seems that CSR served as a base point for other related concepts and themes. Among the few, maybe two perspectives should be noted.
First, in 1991, Carroll revisited his four-part definition of CSR. By that time, he not only suggested the philanthropic component embraced “corporate citizenship”, but also depicted the four components of CSR as a pyramid which should be fulfilled at all times. This change indicated that ethical and philanthropic functions have taken a significant place in that time [21].
Since the stakeholder concept popularized by Freeman [22] in his book entitled Strategic Management: A Stakeholder Approach, it has been widely used for providing a useful context for the analysis for CSR. For example, in 1999, Carroll proposed that there is a natural fit between the idea of corporate social responsibility and organization’s stakeholder. By that, he meant the stakeholder theory can provide CSR with a “theoretical framework” under which social responsibility should be considered specifically to whom the corporation should be responsible. Put it another way, the stakeholder concept presents “names and facets” on the groups or societal members who are most important to business and thus must be responsive [23].
The connection between CSR and the stakeholder theory is still prevailing in this century. The stakeholder theory can specify whom the business must be responsible for, if it can’t replace the CSR concept.
In sum, corporate social responsibility has been defined and conceptualized in a number of different ways. In this study, we accept the proposition about separating the economic responsibility ,which is more likely to be seen as something that business do for themselves, from non-economic responsibilities. And, we also construct our CSR concept under the stakeholder theory framework by specifying whom that business must be responsible for. So in our research, the scope of CSR include environment, employee welfare, products, community involvement and others.
-
B. The existing measurement of CSR
Until now, there have been primary types of published research that attempt to derive usable measures of corporate social activities: (1) pollution control index; (2) social accounting; (3) reputational scales; (4) KLD database; (5) content analysis of corporation publications; (6) analytical hierarchy process.
An earlier method of measuring CSR is to use signalissue indicator. The pollution control performance, reported by the Council of Economic Priorities (CEP) has been used by several scholars [24] [25]. Obviously, the primary limitation of this method is the unidimensionality.
The reputational scale method usually asks business students, corporate staffers or experts to evaluate a sample of large corporations in the form of questionnaire. The responses are recorded on a Likert-type scale ranging from 1(very poor) to 5 (extremely outstanding). Zero means “no option”. The mean score represents the firm’s social involvement score and be used as an evidence of the final ratings. As a method to obtain responses of a public to corporate social involvement, it must ensure that the respondents have a good knowledge about the corporation in question. But how much confidence can be put on knowledge about the inner workings of a large corporation by an outsider public [26]? Besides, the reputational method limits the number of corporation to be rated. Usually, the respondents can rank only 20 to 40 objects in one time. Both of two have limited the use of the reputational method.
More recent research on CSR uses a reputational survey conducted by Fortune magazine [27]. The Fortune ranks a number of large companies with four social indicators and four financial indicators. However, studies have demonstrated high correlations between the Fortune’s social and financial dimensions. Fombrun and Shanley performed a factor analysis of Fortune’s ratings and found that a single factor accounted for 84% of variance suggesting that one single dimension dominates the final ratings [28].
Another method is the content analysis of corporation publications. Generally, annual reports are selected as a reliable source for this method use. The corporate social involvement score is derived from the percentage of the space (lines, words, or pages) in annual reports pertaining to corporate responsibilities and activities. However, based on the self-disclosure information in the annual reports, the analysis is more or less further from objectiveness.
In fact, the problem with measuring CSR is very similar to a multiple-criteria decision making (MCDM) problem with many quantitative and qualitative attributes. Arrington, Wokutch and Fahey have suggested the use of the AHP for measuring social performance [30]. Ruf followed the study, proposing the AHP as an aggregate measure of corporate social responsibility which incorporates both an independent assessment of actual performance and the individual value judgments of the stakeholder [29]. In his study, the dimensions and their definitions are based on the KLD social rating service. By illustrating the application of the procedure, the study reported the relative importance of the eight dimensions for CSR. We should realize the inherent limitations relating to the methodology while we admire the progress the writer made in developing the measurement of CSR. The AHP approach gives reasonably good approximation only when the decision-makers’ preferences are consistent. It is ineffective when applied to ambiguous problems [31].
However, CSR is an inherently fuzzy notion since it is hard to obtain or extract precise data concerning measurement indicators of CSR. Fuzzy logic offers a systematic base in dealing with situations, which are ambiguous, or not well defined [32]. Since there is no fuzzy method aimed at measuring corporation social responsibility, the purpose of this study is to develop a systematic measure of CSR based on the Fuzzy Analytical Hierarchy Process (FAHP) to narrow down the gap to some extent. In addition, a preliminary investigation is presented to make our approach more understandable.
-
III. Methodology
-
A. Assessing criteria
The assessing criteria distinguish five social responsibility domains including environment, employee, products for customers, community involvement, and others such as good relationships with suppliers or banks. A synopsis of this is summarized in Table I.
TABLE I.
A ssessing criteria
Criteria Sub-criteria
Pollution control(C11)
Environment(C1) Energy saving(C12)
Recycling of waste materials(C13)
Employee health and safety(C21)
Employees welfare (C2) Training (C22)
Welfare(C23)
Products (C3) Quality(C31)
Cmmunity involvement(C4)
Other (C5)
Safety(C32)
Techinical improvement(C33)
Public education(C41)
Community activities(C42)
Charity donation(C43)
Bank relation(C51)
Creditors relation(C52)
Supplyer relation(C53)
-
B. Hierarchical structure
Fig. 1 illustrates the hierarchical structure: initially, the overall goal of the decision, evaluating the best companies in assuming CSR, is presented in the top level of the hierarchy. The second level consists of five major criteria that are identified to achieve the overall goal. The third level contains sub-criteria of five major criteria in second level. These sub-criteria play a role of recommendation for decision-makers to carry out pairwise comparison of five major criteria. The coding for the criteria and sub-criteria are given in Table 2. The fourth level of the hierarchy represents the alternative companies.
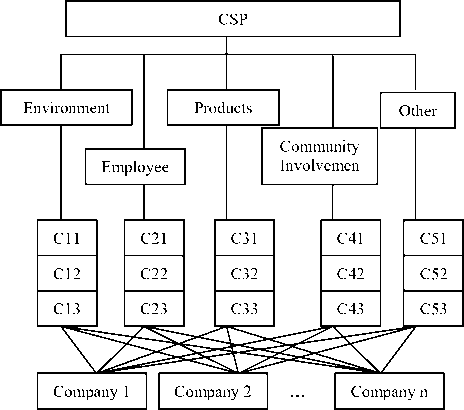
Figure 1. The hierarchical structure for selecting the best alternatives
-
C. Analytical hierarchy process
The analytical hierarchy process (AHP) was first introduced by Saaty in 1971. Since its introduction, the AHP has become one of the most widely used in multiple-criteria decision making (MCDM) problems [33]. The method decomposes a complex system into a hierarchical system of elements [34]. In each hierarchical level, pair-wise comparisons are made by means of a nominal scale to establish a comparison matrix. The eigenvector of the matrix corresponding to the largest eigenvalue signifies the comparative weights of the elements in this level. Then, the consistency ratio is calculated using the eigenvalue to assess the strength of the inner consistency of the comparative matrix and
determine whether to accept the information generated from the model. If the consistency ratio is accepted, the last procedure is to aggregate the relative weights of decision elements to obtain an overall rating for the alternatives.
The traditional AHP has been widely used across the industry in many applications [35], such as strategic planning [36], setting priorities [37], allocating resources [38], choosing the best policy alternatives[39] [40], evaluating performance [41] and ensuring system stability [42].
However, the AHP has its drawbacks, Cheng and Mon noted that AHP cannot include uncertainty factors of people toward objects [43]. This conventional AHP approach is ineffective when applied to ambiguous problems. For example, sometimes the AHP criteria (such as CSR assessing criteria) are difficult to clearly define or describe, so it is not easy for the decision makers to make correct judgments between the criteria. To overcome this shortcoming of AHP and to solve the vagueness of the AHP criteria, a fuzzy version of these techniques should be developed.
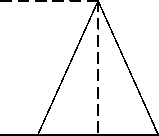
In formulae (1), 1 < m < u , 1 and u stand for the lower and upper value bounds of the fuzzy number M respectively, and m for the modal (mid) value, as shown in Fig.2.
When 1 = m = u , it is a non-fuzzy number by convention.
M m ( x ) .
1 m m
X
Figure 2. A triangular fuzzy number M
Assume two triangular fuzzy numbers :
M 1 = ( 1 1 , m 1 , u 1 ) , M 2 = ( 1 2 , m 2 , u 2 ).
The main operational laws for two triangular fuzzy numbers M 1 and M 2 are as follows [48]:
M 1 ® M 2 = ( 1 1 + 1 2 , m 1 + m 2 , u 1 + u 2 )
D. Fuzzy AHP method
In 1965, Zadeh introduced fuzzy set theory, trying to deal with the uncertainty due to imprecision or vagueness [44]. Laarhoven and Pedrycz proposed a hybrid method, called fuzzy-AHP (FAHP) that combined the benefits of both the fuzzy set theory and AHP methods. The FAHP inputs the triangular fuzzy numbers into a pair-wise comparison matrix to support decision makers’ assessments on alternatives with respect to each attribute or criteria [45]. With this step, FAHP reinterprets decision makers’ assessments from “extract values” to “interval values,” which can better represent the decision alternatives, as compared to the conventional AHP method [46]. Finally the comparative importance of decision alternatives can be identified by aggregating the fuzzy utilities of each alternative and comparing their ranks.
Fuzzy number
A fuzzy number is a special fuzzy set F = { ( x , ц Р ( x ) ) , x e R } , where x takes its value on
M 1 ® M 2 = ( 1 1 1 2 , m 1 m 2 , u 1 u 2 )
XM1 = X( 11, m1, u1) = (211, Xm1,Xu1), X > 0, X e R m= — = (—,—,1)
-
1 M 1 u 1 m 1 l 1
The degree of possibility of M 1 > M 2 is defined as :
V ( M 1 > M 2 ) = sup(min( M M 1 ( x ), M m 2 ( У ))) . x > y
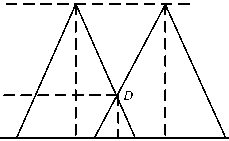
Note V ( M 2 > M 1 ) = m ( d ), where d is the ordinate of
the highest intersection point D between mM] and mMi (see Fig. 3), and we have that:
V ( M 2 > M 1 ) =<
1,
1 1 - u 2
the real line R 1 : -» < x < +» and mf ( x ) is called the membership function which assigns to each object x a value number ranging from 0 to 1. A triangular fuzzy number, which is the most widely used membership function, can be defined to be a normal and convex fuzzy subset of X and denoted as M = ( 1 , m , u ) . Its
( m 2 - u 2) - ( m 1 - 1 1 )
0,
if m 2 > m 1
-, if 1 1 < u 2
otherwise
The degree possibility for a triangular fuzzy number to be greater than k triangular fuzzy numbers Mi (i = 1,2, l , k) can be defined by:
membership to[47]:
function ц м ( x ): R ^ [0, 1]
is
equal
V ( M > M 1 , M 2 , l Mk ) = V [( M > M 1 ),( M > M 2) , L ( M > Mk )] = min V ( M > M i ), i = 1,2, l , k .
M m ( x ) = <
x m -1
l
--, x e [ 1 , m ] m - 1
m
-----x-- m - u m
u
—, x e [ m , u ] u
0, otherwise
M 2
M 1
V ( M 2 > M 1 )
l 2 m 2 l 1 d u 2 m 1 u 1
X
Figure 3. The intersection between M1 and M2.
Determing the linguistic variables
Linguistic variables take on values defined in its term set which are subjective categories for the variables [49] . In this reseatch, linguistic variables are used to represent subjective pair-wise comparisons of experts’ judgements among the options such as equal, weakly more advantageous, not bad, preferable, good, fairly good, very good, absolutely good, and perfect. So a membership function of linguistic scale defined by Gumus (2009) is used to convert such linguistic variables into fuzzy scales. The model is shown in Table II.
The scale of fuzzy number in this paper is based the principle of the model above, but having a little difference. We thought the decision of the upper and lower bound for the triangular fuzzy number should be made in terms with the degree of vagueness which reprensented by the D-value of the two , and the more the D-value is, the higher the degree of vagueness is. For example, according to a given criterion, if element i is more perferable than element j , we can use fuzzy number (3, 4, 5) or (2, 4, 6) to indicate the membership between the two elements, and obviously, the judgement of (2, 4, 6) is more vague than (3, 4, 5).
TABLE II.
M embership function of linguistic scale
|
Fuzzy number |
Linguistic |
Scale of fuzzy number |
|
9 |
Perfect |
(8, 9, 10) |
|
8 |
Abosolute |
(7, 8, 9) |
|
7 |
Very good |
(6, 7, 8) |
|
6 |
Fairly good |
(5, 6, 7) |
|
5 |
Good |
(4, 5, 6) |
|
4 |
Perferable |
(3, 4, 5) |
|
3 |
Not bad |
(2, 3, 4) |
|
2 |
Weak |
(1, 2, 3) |
|
advantage |
||
|
1 |
Equal |
(1, 1, 1) |
Calculation steps of FAHP
In this section, we will briefly introduce that how to carry out the fuzzy AHP. Generally, FAHP calculation process can be divided into four steps after the establishment of structural hierarchy.
Step 1: Constructing original fuzzy comparison matrix. Triangular fuzzy numbers are used to indicate the relative weight of each pair of elements in the same level. Through pair-wise comparison, the fuzzy judgment matrix A is constructed, where the entry aij is a triangular fuzzy number.
Step 2: Calculating synthetic weight to obtain synthetic matrix. Assume that there are nk elements in level k which are sub-elements of an element in the immediately higher level k-1 and there are T experts take part in the evaluation on criteriaat = (lij,mt,uj), i,j = 1,2, l,п*, t = 1,2,l,T refers to the fuzzy number which represents the comparison weight of i-th criterion to j-th criterion in level k evaluated by t-th expert. The fuzzy number of the comparison weight evaluated by all experts for i-th criterion to j-th criterion in level k is calculated by the formulae:
Mk = — 0 ( a 1 + a 2 + • l + a T ) (8)
ij T ij ij ij
Through the formulae, we could obtain a synthetic matrix of relative rankings for all elements in level k. Then, the synthetic weight of each element in level k is calculated by the formulae:
n nknk
S i = Z M ik • ( ZZ M ik л i = 1,2, l , nk (9)
j = 1 i = 1 j = 1
Step 3: Rating in a single level. In this step, participants begin with computing V(Si > Sj), i, j = 1,2, — , nk, i * j , the degree of possibility of Sk > Sj . Then priority for each element in level k with respect to h-th element in the immediate higher level k-1 is calculated by:
Phi (Ai) = min V(Si > Si), i, j = 1,2, L, nk, i * j where Aik refers to the i-th element in level k. Weight vector P = (P*, Pt, ■, Pk,)T is obtained after h1h,2h,,nkh normalization.
Step 4: Calculating overall prioritization weights of final alternatives. Assume h = 1,2,•■•, n, . . Then P * is a
, , , i—1
nk X nk — 1 matrix: P ^ = ( P \ , P ^ ,■■■, P ^) T .
Suppose the global weight vector of level k-1 is wfc-1 = (W*-1, Wi-1,L, W*-1)T . Then the global 1 2
weight vector of level k calculated by the formulae:
w*=(W1i, w* ,■, wni) T = Piwk-1(11)
Hence, under the above procedures, the global weights of the final alternatives will be obtained by calculating from top level to lowest level.
-
IV. A preliminary Investigation
In this section, we present a preliminary investigation to make our approach more understandable. First, we arrange an evaluation committee consisting of corporate managers, public affairs officers and professors of statistics and fuzzy mathematics from Tongji University. They are chosen for their expertise and rich experiences in the evaluation of management performance.
In order to make our conclusion easier to explain, we assume that there are three alternative companies. Company 1 has relative advantages in environment. Company 2 has relative advantages in employee and products. Company 3 has relative advantages in community involvement and other disclosure.
Step1: Constructing original fuzzy matrix
We asked the committee members to make a fuzzy evaluation respectively on the elements in single hierarchical level with respect to the criteria of higher level, using words such as equal, weakly more advantageous, not bad, preferable, good, fairly good, very good, absolutely good, and perfect. We carefully explained the definition of terms and required procedure to the committee members in case of discrepancies occurring. Then the responses are quantified by the membership function of linguistic scale as we explained above. All entries in the cells of each original comparison matrix are replaced by single triangular fuzzy number representing the judgment of the decision group on each pair of elements (Lee, 2010).
Step2: Calculating synthetic weight to obtain synthetic matrix
Followed by calculation steps of FAHP, we use formulae (8) and (9) to calculate the synthetic weights of each original fuzzy comparison matrix to obtain synthetic comparison matrices .Matrix A shown in table 4 represents the fuzzy comparison weights of the five major criteria in the second level with respect to the overall goal in the top level. Matrix , each represents the fuzzy comparison weights of three alternative companies with respect to environment, employee, products, community involvement, other, shown in table 5.
Step3: Determining the relative importance of elements in signal level
After step 2, we also obtain the degree of possibility of, in all synthetic comparison matrices. Then the weight vector of each matrix can be attained by formulae (10). After normalization, the relative weights vector of each matrix is also shown in Table 3 and Table 4.
Take the data entered by respondent 1 as an example, the values of fuzzy synthetic extent with respect to the assessing criteria environment for three alternative companies are calculated as below:
S1= (3.606, 3.454, 3.111) ® (0.135, 0.116, 0.109)
= (0.488, 0.400, 0.339)
It means that company 1 indeed does better with respect to the environmental problem than another two companies do.
Same calculations are performed for the relative vectors.
Step4: Calculating the overall prioritization weights of final alternatives
After all relative weights vectors have been computed, we use formulae (11) to calculate the relative overall prioritization weights of the three companies.
FAHP FAHP FAHP FAHP FAHP FAHP FAHP
W W B 1 , W B 2 , W B 3 , W B 4 , W B 5 W A
= ( 0.431 0.341 0.228 ) )
The result shows that company 1 is the best CSR performer, followed by company 2 and company 3. It is corresponding to our assumption considering the relative importance of the five main criteria.
TABLE III.
S ynthetic comparison matrix A and relative weight vector W A FAHP
|
A |
C1 |
C2 |
C3 |
C4 |
C5 |
|
C 1 |
(1.000,1.000,1.000) |
(1.422,1.078,1.056) |
(1.417,0.857,0.923) |
(3.278,1.750,1.450) |
(2.278,1.333,1.641) |
|
C 2 |
(1.159,1.178,0.950) |
(1.000,1.000,1.000) |
(0.917,0.802,0.875) |
(2.111,1.611,1.356) |
(1.389,1.233,1.122) |
|
C 3 |
(1.117,1.189,0.917) |
(1.159,1.256,1.194) |
(1.000,1.000, 1.000) |
(2.667,2.028,1.578) |
(1.667,1.550,1.303) |
|
C 4 |
(1.028,0.600,0.450) |
(0.746,0.622,0.528) |
(0.655,0.557,0.528) |
(1.000,1.000, 1.000) |
(1.042,0.767,0.830) |
|
C 5 |
(0.752,0.778,0.583) |
(0.897,0.811,0.722) |
(0.786,0.651,0.667) |
(1.206,1.306,1.500) |
(1.000,1.000, 1.000) |
Relative weights vector (W A FAHP ) = (0.140 0.107 0.167 0.014 0.006) T
|
TABLE IV. S ynthetic comparison matrix B 1 and relative weight vector W B1 FAHP |
|||
|
B1 |
Company1 |
Company2 |
Company3 |
|
Company 1 |
(1.000, 1.000, 1.000) |
(1.472,1.350,1.303) |
(1.639,1.256,1.151) |
|
Company 2 |
(0.786,0.743,0.689) |
(1.000, 1.000, 1.000) |
(1.139,1.011,0.905) |
|
Company 3 |
(0.869,0.802,0.633) |
(1.133,1.011,0.944) |
(1.000, 1.000, 1.000) |
Relative weights vector (WB1 FAHP ) = (0.647 0.164 0.189) T
|
TABLE V. S ynthetic comparison matrix B 2 and relative weight vector W B2 FAHP |
|||
|
B2 |
Company1 |
Company2 |
Company3 |
|
Company 1 |
(1.000, 1.000, 1.000) |
(0.767,0.794,0.773) |
(1.128,1.122,1.063) |
|
Company 2 |
(1.310,1.278,1.317) |
(1.000, 1.000, 1.000) |
(1.522,1.217,1.373) |
|
Company 3 |
(0.960,1.000,0.933) |
(0.731,0.838,0.660) |
(1.000, 1.000, 1.000) |
|
Relative weights vector (WB 2 FAHP ) |
=(0.298 0.436 0.266) T |
||
TABLE VI.
S ynthetic comparison matrix B 3 and relative weight vector W B3 FAHP
|
B3 |
Company1 |
Company2 |
Company3 |
|
Company 1 |
(1.000, 1.000, 1.000) |
(0.783,0.838,1.042) |
(1.139,1.483,1.133) |
|
Company 2 |
(1.048,1.217,1.333) |
(1.000, 1.000, 1.000) |
(1.528,1.717,1.359) |
|
Company 3 |
(0.905,0.711,0.944) |
(0.750,0.595,0.683) |
(1.000, 1.000, 1.000) |
|
Relative weights vector (WB 3 FAHP ) |
=(0.358 0.431 0.211) T |
TABLE VII.
S ynthetic comparison matrix B 4 and relative weight vector W B4 FAHP
|
B4 |
Company1 |
Company2 |
Company3 |
|
Company 1 |
(1.000, 1.000, 1.000) |
(0.833,0.830,0.903) |
(0.783,0.683,0.649) |
|
Company 2 |
(1.114,1.206,1.222) |
(1.000, 1.000, 1.000) |
(0.933,0.8410.607) |
|
Company 3 |
(1.561,1.467,1.333) |
(1.694,1.189,1.083) |
(1.000, 1.000, 1.000) |
|
Relative weights vector (WB 4 FAHP ) |
= (0.232 0.328 0.440) T |
TABLE VIII.
S ynthetic comparison matrix B 5 and relative weight vector W B5 FAHP
|
B5 |
Company1 |
Company2 |
Company3 |
|
Company 1 |
(1.000, 1.000, 1.000) |
(1.111,1.083,0.698) |
(0.700,0.762,0.523) |
|
Company 2 |
(1.611,0.933,0.917) |
(1.000, 1.000, 1.000) |
(0.633,0.714,0.764) |
|
Company 3 |
(2.083,1.322,1.500) |
(1.325,1.439,1.639) |
(1.000, 1.000, 1.000) |
|
Relative weights vector (WB 5 FAHP ) |
= (0.254 0.269 0.477 ) T |
-
V. Conclusion and future work
The objective of this study was to construct a systematic, aggregate measurement of corporate social performance. Based on the research of Ruf (1998), we proposed a fuzzy-AHP framework in this study to evaluate corporate social performance. In contrast to the traditional AHP approach, a fuzzy version incorporated with the method enables us to deal with problems encountered in prior measures, such uncertainty or vagueness phenomenon. We also presented a case study to help explain the model. The results suggest that the FAHP method is applicable for developing such a measurement and can be used for both decision making and research.
Of course, there are some limitations about this study. With regard to the methodology, the dimensions that we selected for evaluating corporate social performance are derived from Chinese context. Whether it is suitable for other cultural context is however in doubt. When it refers to the specific results presented in this study, the limitation is that the results, which represent the judgment of a certain decision group, may not generalize to other groups. And the relative importance of the elements may change in different time or in different situations.
In conclusion, the integrated evaluation system would be possible to predict the consequences of the decisions made based upon the information provided by this assessing model, thus providing a more accurate, effective, and systematic decision support tool.
Future work for researchers may search for more commonly accepted dimensions of CSR that can suitable for different cultural context. Another area of interest is to explore the relationship between other organizational variables and CSR especially the certain aspect of corporate social performance, which may facilitate a meaningful corporate strategy. Furthermore, researchers can find more criteria that can influence corporate social performance in a significant way, and determine the relative importance of the new criteria, seeing its influence on other criteria’s relative importance.
References Measuring Corporate Social Responsibility Based on a Fuzzy Analytical Hierarchy Process
- H. R. Bowen, Social Responsibility of the Businessmen. New York, 1953.
- K. Davis, “Can businessmen afford to ignore the social responsibilities,” California Management Review, vol. 2, pp. 70-76, 1960.
- M. Friedman, “Capitalism and freedom,” Chicago, University of Chicago Press, 1962.
- J. W. Mc.Guire, Business and Society. New York, 1963.
- K. Davis, “Understanding the social responsibility puzzle: What does the businessmen owe to society,” Business Horizons, vol. 10, pp. 45-50, 1967.
- C.C. Walton, Corporate Social Performance. CA: Wadsworth, 1967.
- M. Heald, The social responsibility of business: Company and community. Cleveland, OH: Case Western Reserve University Press, 1900-1960.
- H. L. Johnson, Business and Society: Framework and issues. CA: Wadsworth, 1971.
- Committee for Economic Development, Social responsibilities for business corporations. New York, 1971.
- H.G. Manne, H.C. Wallich, The modern corporation and social responsibility. Washington, DC: American Enterprise Institution for Public Policy Research, 1972.
- K. Davis, “The case for and against business assumption of social responsibilities,” Academy of Management Journal, vol. 16, pp. 312-322, 1973.
- J. Backman, Social responsibility and accountability. New York: New York University Press, 1975.
- S.P. Sethi, “Dimensions of corporate social performance: An analytic framework,” California Management Review, vol. 17, pp. 58-64, 1975.
- H.G. Fitch, “Achieving corporate social responsibility,” Academy of Management Review, vol. 1, pp. 38-46, 1976.
- W.C. Frederick, “From CSR1 to CSR 2: The maturing of Business-and-society thought,” Graduate School of Business: University of Pittsburgh, 1978.
- A.B. Carroll, “A three-dimensional concept model of corporate social performance,” Academy of Management Review, vol. 4, pp. 497-505, 1979.
- T.M. Jones, “Corporate social responsibility revisited, redefined,” California Management Review, pp. 59-67, 1980.
- A.B. Carroll, “Corporate social responsibility: Will industry response to cutbacks in social program funding?” Vital Speeches of The Day, vol. 49, pp. 604-608, 1983.
- P.F. Drucker, “The new meaning of corporate social responsibility,” California Management Review, vol. 26, pp. 53-63, 1984.
- K.E. Aupperle, A.B. Carroll, J.D. Hatfield “An empirical investigation of the relationship between corporate social responsibility and profitability,” Academy of Management Journal, vol. 28, pp. 446-463, 1985.
- D.J. Wood, “Corporate social performance revisitied,” Academy of Management Journal, vol. 16, pp. 691-718, 1991.
- R.E. Freeman, “Strategic Management: A Stakeholder Approach,” Boston: Pitman, 1984.
- A.B. Carroll, “Corporate social responsibility: Evolution of the definitional construct” Business and Society, vol. 38, pp. 268-295, 1999.
- J.H. Bragdon, J.A. Marlin, “Is pollution profitable,” Risk Management. Vol.19, pp.9–18, 1972.
- N.Freedman, B.Jaggi, “ Pollution disclosures, pollution performance, and economic performance,” The International Journal of Management Science. Vol. 10, pp.167–176, 1982.
- W.F Abbott, R.J. Monsen, “ On the measurement of corporate social responsibility: Self-reported discolsures as a method of measuring corporate social involvement,” Academy of Management Journal, vol.22, pp.501-516, 1979.
- J. B. McGuire, A.Sundgren, T. Schneeweis, “Corporate social responsibility and firm financial performance,” Academy of Management Journal. vol. 31, pp. 854–872, 1988.
- C.Fombrun, M.Shanley, “ What's in a name? Reputation building and corporate strategy,” Academy of Management Journal. vol. 33, pp. 233-258, 1990.
- B. M. Ruf, K Muralidhar, K.Paul, “The development of a systematic, aggregate measure of corporate social performance,” Journal of Management. Vol. 24, pp.119-133, 1998.
- C.E Arrington, R. E Jensen, M. Tokutani, “ Scaling of ccorporate multivariate performance criteria: subjective composition versus the analytic hierarchy process,” Journal of Accounting and Public Policy, vol.1, pp.95-123,1982.
- S. H. Lee, “Using fuzzy AHP to develop intellectual capital evaluation model for assessing their performance contribution in a university,” Expert Systems with Applications. vol. 37, pp. 4941-4947, 2010.
- C.Kahraman, A.Beskese, D. Ruan, “Measuring flexibility of computer integrated manufacturing systems using fuzzy cash flow analysis,” Information Systems, vol. 168, pp. 77–94, 2004.
- T.L Saaty, The Analytic Hierarchy Process. New York: McGraw-Hill, 1981.
- F.T. Bozbura, A.Beskese, C. Kahraman, “Prioritization of human capital measurement indecators using fuzzy AHP,” Expert Systems with Applications, vol.32, pp.1100-1112, 2007.
- B.Nepal, O.P.Yadav, A. Murat, “A fuzzy-AHP approach to prioritization of CS attributes in target planning for automative product development,” Expert Systems with Applications. Vol. 37, pp. 6775-6786, 2010.
- K.L. Poh, B.W. Ang, “Transportation fuels and policy for Singapore: An AHP planning approach,” Computers and Industrial Engineering. vol. 37, pp. 507–5251999.
- A.Stam, S.A.P. Duarte, “On multiplicative priority rating methods for the AHP,” European Journal of Operational Research. vol. 145, pp. 92–108, 2003.
- G. Barbarosoglu, D. Pihas, “ Capital rating in the public sector using the analytic hierarchy process,” The Engineering Economist, vol.40, pp. 315–329,1995. V.Verdeyen, J.Put, B.V. Buggenhout, “A social stakerholder Model,” International Journal of Social Welfare. vol.13, pp. 325-331, 2004.
- D.H. Byun, “ The A.H.P., approach for selecting an automobile purchase model,” Information and Management. Vol. 38, pp. 289–297, 2001.
- E.W.T.Ngai, “Selection of web sites for online advertising using the AHP,” Information and Management. vol. 40, pp. 233–242, 2003.
- F. X Frei, P.T.Harker, “ Measuring aggregate process performance using AHP,” European Journal of Operational Research, vol. 116, pp.436–442, 1999.
- H.M.A. Fahmy, “Reliability evaluation in distributed computing environments using the AHP,” Computer Networks. vol. 36, pp. 597–615, 2001.
- C.H. Cheng, D. L. Mon, “Evaluating weapon system by AHP based on Fuzzy Scale,” Fuzzy Sets and Systems, vol. 63, pp.1-10, 1965.
- L.A. Zadeh, “ Fuzzy sets,” Information and Control. Vol. 8, pp. 338-353, 1965.
- Ayag˘, Z. “A fuzzy AHP-based simulation approach to concept evaluation in a NPD environment,” IIE Transactions, vol.37, pp. 827–842, 2005.
- Ying-Fu Lo, Ming-Hui Wen. “A fuzzy-AHP-based technique for the decision of design feature selection in Massively Multiplayer Online Role-Playing Game development,” Expert Systems with Applications. vol. 37, pp. 8685-8693, 2010.
- A.Kaufmann, M.M.Gupta, Introduction to fuzzy arithmetic theory and applications. New York: Van Nostrand Reinhold, 1991.
- A. Kaufmann, Introduction to fuzzy arithmetic theory and application. New York: Van Nostrand, 1991.
- C-C Sun. “A performance evaluation model by integrating fuzzy AHP and fuzzy TOPSIS methods,” Expert Systems with Applications, vol. 37,pp. 7745-7754, 2010.
