Measuring the dynamics of agglomerative processes in the regional economy

Author: Grinchel Boris Mikhaylovich, Antonova Alina Andreyevna
Journal: Economic and Social Changes: Facts, Trends, Forecast @volnc-esc-en
Section: Development strategy
Article in issue: 5 (23) т.5, 2012.
Free access
The article deals with an approach to studying agglomerations’ socio-economic characteristics on the basis of criterial indicators system. The regional agglomerative process has been measured by calculating numerical scores and generalized estimates according to 16 indicators that correspond to the criteria of agglomerative development. The calculations are based on the statistical data of the Federal State Statistics Service. Calculated estimates allow to measure the dynamics of regional agglomerative process, fix recession and growth periods, understand the specifics of this process in every region and manage it. It becomes possible to obtain information not only about the quantitative but qualitative changes in the regional agglomerative process: one can see the areas of region’s lagging or leading and use this information in developing regional policy, strategic planning and management.
Region, agglomeration, regional development, regional agglomerative process
Short address: https://sciup.org/147223397
IDR: 147223397 | UDC: 332.146.2:911.372.32
Text of the scientific article Measuring the dynamics of agglomerative processes in the regional economy
The Russian economy is trying to get away from its spatial non-concentration. The changing paradigm of regional development focuses on the agglomerative-nodal type of spatial structure, and at the moment agglomeration, which is a form of spatial organization of economy and population settlement, is a central unit. We consider the regional agglomerative process as an integral part (component) of the innovation-oriented transformation process of Russia’s socioeconomic space.
If economic space is understood as “a set of the features of region’s socio-economic environment, where the economic activity takes place and people live” [2, p. 47], then we will understand the structural, technological and institutional changes in the socio-economic space of the Russian Federation in the sphere of innovation development as a transformation of economic space in the context of the problem.
Thus, talking about the study of agglo-merative process as a component of transforming social and economic space in the regions of the Russian Federation, first of all, we mean measuring the dynamics of the regional agglomerative process.
Region’s agglomeration can not be considered only in the territorial aspect. This is a qualitative, integral feature of highly urbanized territory; this is a multilevel feature, without which such territory is only a big city that is not necessarily an agglomeration.
Today, the main obstacle to research agglomerations is the lack of a common approach to the analysis of statistics and the lack of statistics as such in some cases. In Russia, the problem is aggravated by the fact that there is no normative basis to regulate agglomerations against the background of a constant conflict field around the issues of budget flows redistribution and managers’ wage rates. According to the only today’s guidance manuals for measuring agglomerations, the method of Central Scientific-Research and Design Institute for Urban Planning of the State Committee for Civil Construction and Architecture under the State Committee for Construction of the USSR (1984) and the method of the RAS Institute of Geography (1988), “developed and developing agglomeration can be considered as a group of cities and settlements if the population of its largest city is not less than 250 thousand people, and there are at least two urban territories in its population settlement area (limited by 2-hour access isochrones by any public land and water transport)” [4].
Agglomerations are changing and evolving now, but all the methods to study them have not changed since the earliest times, or they are descriptive in nature, and sometimes researches are based only on expert judgments. The biggest challenge in their research is a fact that they do not have their statistical base, because they are not the unit of observation.
Despite the fact that the description and methodological basis stay put, regional agg-lomerative process can is continuously extending: old agglomerations are breaking up, new ones are developing, their specialization and life-supporting mechanisms are changing, but nowadays there is no efficient instrument to measure the dynamics of this process. There is a need to have a formal measuring mechanism that can be used to fix these processes, understand the specifics and manage them.
In this regard, the focus of attention can be removed from considering agglomerations as a territorial unit of economic space to studying the properties of region(s) containing it. Regional agglomerative development affects the regional statistics, so we can try to track down this process and study it by selecting the most representative statistical indicators.
Assessing the degree of regional agglomeration, we get a new concept – “agglomerated region” and, therefore, we get a possibility to study it. We have an opportunity to identify the regions that show a high level of agglomeration capacity. We can follow the dynamics of the agglomerative process on both sides – both development and decay.
The following principles were used in selecting the indicators of regional agglomerative development:
-
• indicators’ belonging to the characteristics of developed agglomeration, according to the definition of agglomeration;
-
• the availability of official statistics for 5years that allow us to calculate the dynamics in integrated assessment by the indicators;
-
• the availability of statistics on the absolute values of indicators for a target year.
According to the principles mentioned above, we have selected a number of indicators that allow us to consider the regional agglo-merative process in its complexity (tab. 1) .
Table 1.Indicators of regions’ agglomerative development
|
№ |
Indicator |
|
1 |
The share of people engaged in the economy in the total population of the region |
|
2 |
The share of urban population in the total population of the region |
|
3 |
Gross regional product per 1 employee in the economy |
|
4 |
Issuing newspapers per 1000 people |
|
5 |
Setting out passengers by public rail transport |
|
6 |
The number of registered mobile personal terminals |
|
7 |
Putting dwelling houses into service per 1000 people |
|
8 |
The share of state officials and local government officials in the total employment in the economy |
|
9 |
The share of students who are going into higher education per 1000 people |
|
10 |
The share of employees with higher education in the total employment in the economy |
|
11 |
The share of enterprises and organizations that use special org. means in the areas of activities |
|
12 |
Marker branches’ contribution to GRP per capita* |
|
13 |
Average consumer expenditure per capita per month |
|
14 |
Trapping of air pollutants from stationary sources |
|
15 |
The volume of paid services per capita |
|
16 |
Catering turnover |
|
* Marker branch is a sector that usually has a significant share in the economic structure of agglomerations. Accordingly, a high share of this branch in GRP is a sign (marker) of agglomeration in the region. Marker branches include the following industries: manufacturing; production and distribution of electricity, gas and water; construction; wholesale and retail trade; repair of motor vehicles, motorcycles, personal and household goods; hotels and restaurants; transport and communication; financial activities; real estate; renting and services; public administration and defense, compulsory social security; education; health and social services; other community, social and personal services. |
|
The attractiveness of agglomeration (the term means both the object and process) is based on a range of additional economic effects: people go to big cities to take advantage of the benefits that are caused by agglomeration as a form of production distribution and people settlement:
-
✓ a high degree ofproduction concentration and diversification, which makes it the most effective;
-
✓ the concentration of qualified personnel;
-
✓ close relationship between production, science and training centers;
-
✓ efficient using the systems of production and social infrastructure, etc.
These advantages “work” on both sides – they are provided by extensive agglomeration, and they, in turn, contribute to its further development. All of these benefits are also the prerequisites of innovation development in the region.
It is desirable for regions to have a so-called agglomerative effect; it is a term used by A. Weber in his “scheme of production distribution” and pronounced as “a savings index”.
As for today’s agglomerations, this effect reflects not only in the summation of potential of some territorial entities that are included in the agglomeration due minimizing transport costs, but also in the synergistic multiplication of these territories’ potential properties – achieving maximum efficiency by reallocating resources and minimizing costs. This is the property that turns urban agglomerations into the points of economic growth, ensuring the social and economic development of a region.
Based on this, we have identified four criteria of regional agglomeration, which are conjugated with the opinions of other authors who give the definition of agglomerations and agglomerative processes.
Criteria of regions’ agglomeration*
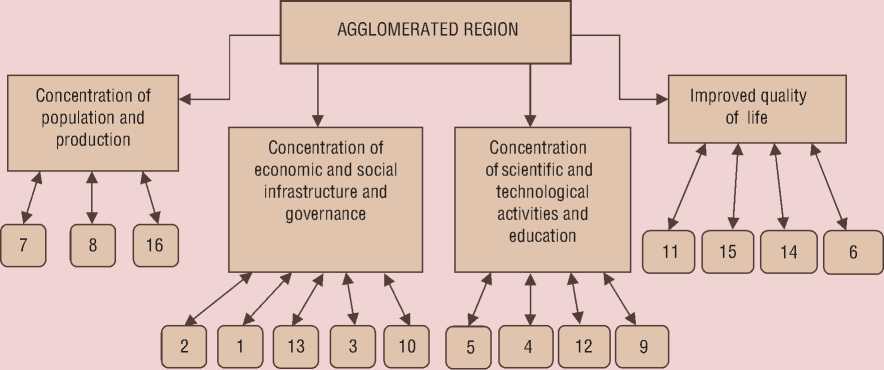
* Here “1”... “16” – indicators, showed above, in table 1.
Each indicator in table 1 can characterize one or another criterion of agglomeration, as it is shown in the figure .
The regional agglomerative process has been measured by calculating numerical scores and generalized estimates according to 16 indicators, which correspond to each criterion, on the base of the Federal State Statistics Service’s data [5].
When calculating numerical scores according to the indicators (tab. 2) , we were guided by the following principles:
-
• considering the methodological guidelines for determining agglomerations (the population of a core city ≥ 250 thousand people, there are at least 2 urban settlements in the attracted area);
-
• considering the specific features of the region (cost of living, “northern allowances”, etc.);
-
• limiting the number of statistical data by the data distribution area of 80 – 85%; limiting extreme or extraordinary values.
The calculation of numerical scores for the selected indicators was carried out by using the following formulas:
R i = (Pmax – Pmin ) / 10 , (1)
where R i – interval range of the i-th index, i Є (1.16);
Pmax and Pmin – averaged value for five best and worst regions, the maximum and minimum values of the indicator;
I j = ( ∑ K i j ) / n , (2)
where I j – normalized numerical score of agglomerative development in the each of 78 regions 1, j Є (1.78) by i-th index, i Є (1.16);
K ij – numerical score of j-th region by i -th index, i Є (1. 16);
-
n – total number of indicators.
Table 2. Groups of regions in terms of agglomerative development
|
Group |
No. |
Region |
Agglomerations that are included in the region |
The share of regions that have big agglomerations |
Rank |
|
Regions with a HIGH level of agglomerative development |
1 |
St. Petersburg and Leningrad Oblast |
St. Petersburg agglomeration |
61.5 |
10 |
|
2 |
Moscow and Moscow Oblast |
Moscow agglomeration |
10 |
||
|
3 |
Sverdlovsk Oblast |
Yekaterinburg agglomeration |
10 |
||
|
4 |
Tyumen Oblast |
10 |
|||
|
5 |
Nizhny Novgorod Oblast |
Nizhny Novgorod agglomeration |
10 |
||
|
6 |
Novosibirsk Oblast |
Novosibirsk agglomeration |
10 |
||
|
7 |
Primorsky Krai |
Vladivostok agglomeration |
10 |
||
|
8 |
Murmansk Oblast |
10 |
|||
|
9 |
Republic of Tatarstan |
Kazan Nizhnekamsk Almetyevsk agglomerations |
10 |
||
|
10 |
Khabarovsk Krai |
9 |
|||
|
11 |
Chelyabinsk Oblast |
Chelyabinsk agglomeration |
9 |
||
|
12 |
Magadan Oblast |
9 |
|||
|
13 |
Kamchatka Krai |
9 |
|||
|
Regions with an INCREASED level of agglomerative development |
1 |
Rostov Oblast |
Rostov agglomeration |
87.5 |
8 |
|
2 |
Samara Oblast |
Samara-Tolyatti agglomeration |
8 |
||
|
3 |
Krasnodar Krai |
Krasnodar Sochi agglomerations |
8 |
||
|
4 |
Perm Krai |
Perm agglomeration |
8 |
||
|
5 |
Krasnoyarsk Krai |
Krasnoyarsk agglomeration |
8 |
||
|
6 |
Omsk Oblast |
Omsk agglomeration |
7 |
||
|
7 |
Kaliningrad Oblast |
7 |
|||
|
8 |
Irkutsk Oblast |
Irkutsk agglomeration |
7 |
||
|
Regions with a MIDDLE level of agglomerative development |
1 |
Republic of Bashkortostan |
Ufa agglomeration |
50 |
6 |
|
2 |
Kemerovo Oblast |
Novokuznetsk agglomeration |
6 |
||
|
3 |
Sakha (Yakutia) Republic |
6 |
|||
|
4 |
Sakhalin Oblast |
6 |
|||
|
5 |
Komi Republic |
5 |
|||
|
6 |
Arkhangelsk Oblast |
Arkhangelsk agglomeration |
5 |
||
|
7 |
Chuvash Republic |
5 |
|||
|
8 |
Yaroslavl Oblast |
Yaroslavl-Rybinsk agglomeration |
5 |
||
|
9 |
Saratov Oblast |
Saratov agglomeration |
5 |
||
|
10 |
Volgograd Oblast |
Volgograd agglomeration |
5 |
||
|
11 |
Lipetsk Oblast |
5 |
|||
|
12 |
Smolensk Oblast |
5 |
Continuation table 2
|
Regions with a DECREASED level of agglomerative development |
1 |
Vologda Oblast |
29.4 |
4 |
|
|
2 |
Orenburg Oblast |
4 |
|||
|
3 |
Chukotka Autonomous Okrug |
4 |
|||
|
4 |
Tomsk Oblast |
Tomsk agglomeration |
4 |
||
|
5 |
Voronezh Oblast |
Voronezh agglomeration |
4 |
||
|
6 |
Kursk Oblast |
4 |
|||
|
7 |
Tula Oblast |
Tula-Novomoskovsk agglomeration |
4 |
||
|
8 |
Novgorod Oblast |
4 |
|||
|
9 |
Stavropol Krai |
Caucasian Mineral Waters |
4 |
||
|
10 |
Vladimir Oblast |
3 |
|||
|
11 |
Belgorod Oblast |
3 |
|||
|
12 |
Kaluga Oblast |
3 |
|||
|
13 |
Republic of Karelia |
3 |
|||
|
14 |
Kirov Oblast |
3 |
|||
|
15 |
Bryansk Oblast |
Bryansk-Lyudinovsk agglomeration |
3 |
||
|
16 |
Orel Oblast |
3 |
|||
|
17 |
Ulyanovsk Oblast |
3 |
|||
|
Regions with a LOW level of agglomerative development |
1 |
Pskov Oblast |
7.1 |
2 |
|
|
2 |
Udmurt Republic |
Izhevsk agglomeration |
2 |
||
|
3 |
Ivanovo Oblast |
2 |
|||
|
4 |
Astrakhan Oblast |
2 |
|||
|
5 |
Republic of Dagestan |
2 |
|||
|
6 |
Mari El Republic |
2 |
|||
|
7 |
Penza Oblast |
2 |
|||
|
8 |
Tambov Oblast |
1 |
|||
|
9 |
Amur Oblast |
1 |
|||
|
10 |
Kostroma Oblast |
1 |
|||
|
11 |
Tver Oblast |
1 |
|||
|
12 |
Republic of North Ossetia–Alania |
1 |
|||
|
13 |
Ryazan Oblast |
1 |
|||
|
14 |
Republic of Mordovia |
1 |
|||
|
15 |
Republic of Buryatia |
1 |
|||
|
16 |
Tyva Republic |
1 |
|||
|
17 |
Altay Krai |
1 |
|||
|
18 |
Republic of Adygea |
1 |
|||
|
19 |
Jewish Autonomous Oblast |
1 |
|||
|
20 |
Republic of Ingushetia |
1 |
|||
|
21 |
Republic of Khakassia |
Abakan agglomeration |
1 |
||
|
22 |
Kurgan Oblast |
1 |
|||
|
23 |
Zabaykalsky Krai |
1 |
|||
|
24 |
Kabardino-Balkar Republic |
1 |
|||
|
25 |
Karachay–Cherkess Republic |
1 |
|||
|
26 |
Altai Republic |
1 |
|||
|
27 |
Republic of Kalmykia |
1 |
|||
|
28 |
Chechen Republic |
1 |
The points from 1 to 10 were assigned to statistics for indicators in such a way that each pair of points characterized its group most clearly.
The assessments, which were calculated for all the regions of Russia, allowed us to reveal the developmental level of agglomerative process in the regions as a component of transforming social and economic space.
-
1 and 2 points are typical for the regions with low agglomerative development. This group consists of 23 regions, including almost all the regions of the North Caucasian Federal District (except Stavropol Krai that is included in the group of regions with a decreased level of agglomerative development), a half of the Siberian Federal District and Southern Federal District, as well as a number of the regions of the Central and North-West Federal Districts: the Pskov, Ivanovo, Tver, Ryazan, Tambov, Kostroma Oblasts.
There are two agglomerations in the group of regions with a low level of agglomerative development: the Udmurt Republic (Izhevsk agglomeration, maximum population is about 944.2 thousand people, 2 points) and the Republic of Khakassia (Abakan agglomeration, population of Abakan, economic and cultural center of the agglomeration, is only 171 thousand, 1 point).
These points reflect clearly a number of negative features in the “agglomerative” history of the region: Abakan agglomeration is formed from the cities and towns that were nondiversified in the past, its population size is significantly smaller that population of other RF agglomerations; the development of Abakan agglomeration is complicated by its interregional nature (Krasnoyarsk Krai is attracted by Minusinsk). Despite all the negative trends mentioned above, today this agglomeration is considered as one of the most important “growing points”. According to the press, striking illustration of this is 8.7 billion rubles that were allocated from the federal budget by V.V. Putin to develop transport, engineering and social infrastructure of the Republic and present a project of Abakan-Chernogorsk agglomeration at the Ninth Economic Forum in Krasnoyarsk on 16 – 18 February 2012 [7].
-
3 and 4 points are typical for the regions with a decreased level of agglomerative development. There are 22 regions in this group, 6 of them are agglomerations. They are the Tomsk, Voronezh, Tula, Bryansk Oblasts, Stavropol Krai and the Udmurt Republic.
There are 14 regions with a middle level of agglomerative development (5 – 6 points); there are large agglomerations in the territories of a half of them.
Two leading groups of regions (7 – 8 and 9 – 10 points, respectively) include Saint-Petersburg and the Leningrad Oblast, Moscow and the Moscow Oblast, the Sverdlovsk Oblast, the Nizhny Novgorod Oblast, the Novosibirsk Oblast, Primorsky Krai, the Republic of Tatarstan, the Chelyabinsk Oblast, the Rostov Oblast, the Samara Oblast, Krasnodar Krai, Perm Krai, Krasnoyarsk Krai, the Omsk Oblast and the Irkutsk Oblast.
There is a large agglomeration, which population is not less than 1 million people, in the territory of all these regions. But there are regions that have their own specific features and do not have any agglomerations-millionaires in their territories among these successful regions in the leading groups.
They include:
-
• the regions with low population density and the limited number of centers that concentrate economic activities and population settlement, attracting people from a wide area of the region (Khabarovsk Krai, the Magadan Oblast, Kamchatka Krai);
-
• important economic, transport and manufacturing “control points” and “nodes” (the Tyumen Oblast, the Murmansk Oblast);
-
• progressive Euro-regions (the Kaliningrad Oblast, Euro-region “Baltic”).
The calculated estimates give the possibility to measure the dynamics of regional agg-lomerative process when calculating the indicators over a certain period. This method allows to fix recession and growth periods, understand the specifics of each region and, thus, manage it.
In this case, it is possible to obtain information not only about quantitative but also about qualitative changes in the regional agglomerative process: one can see the areas of region’s lagging or leading, and use this information in developing regional policy, strategic planning and management.
Thus, on the basis of calculations, we can identify a number of promising cities that have some potential to lead in terms of agglomerative development (tab. 3) . The core cities are marked in bold type; there are population size figures here (according to Rosstat data on January 1, 2011 [4]); there are the names of satellite towns.
Table 3. Promising cities or group of cities in the region with a middle, increased and high level of agglomerative development
|
Group |
No. |
Region |
Agglomerations that are included in the region |
Perspective in the region or group of cities that are included in the region and their population size, thsd. pers. |
|
Regions with a HIGH level of agglomerative development |
1 |
St. Petersburg and Leningrad Oblast |
St. Petersburg agglomeration |
|
|
2 |
Moscow and Moscow Oblast |
Moscow agglomeration |
||
|
3 |
Sverdlovsk Oblast |
Yekaterinburg agglomeration |
||
|
4 |
Tyumen Oblast |
Tyumen – 580.2 |
||
|
Tobolsk – 99.7 |
||||
|
Yalutorovsk – 36.5 |
||||
|
Zavodoukovsk – 25.7 |
||||
|
5 |
Nizhny Novgorod Oblast |
Nizhny Novgorod agglomeration |
||
|
6 |
Novosibirsk Oblast |
Novosibirsk agglomeration |
||
|
7 |
Primorsky Krai |
Vladivostok agglomeration |
||
|
8 |
Murmansk Oblast |
Murmansk – 309.4 |
||
|
Apatity – 61.3 |
||||
|
Severomorsk – 53.3 |
||||
|
Monchegorsk – 47.6 |
||||
|
Kirovsk – 29.8 |
||||
|
Olenegorsk – 22.0 |
||||
|
9 |
Republic of Tatarstan |
Kazan Nizhnekamsk Almetyevsk agglomerations |
||
|
10 |
Khabarovsk Krai Chelyabinsk Oblast Magadan Oblast |
Khabarovsk – 577,7 |
||
|
Komsomolsk-on-Amur – 263.9 |
||||
|
Amursk – 43.0 |
||||
|
Bikin – 17.2 |
||||
|
11 |
Republic of Tatarstan |
Chelyabinsk agglomeration |
||
|
12 |
Khabarovsk Krai |
– |
||
|
13 |
Chelyabinsk Oblast |
– |
Continuation table 3
|
Regions with an INCREASED level of agglomerative development |
1 |
Rostov Oblast |
Rostov agglomeration |
|
|
2 |
Samara Oblast |
Samara-Tolyatti agglomeration |
||
|
3 |
Krasnodar Krai |
Krasnodar Sochi agglomerations |
||
|
4 |
Perm Krai |
Perm agglomeration |
||
|
5 |
Krasnoyarsk Krai |
Krasnoyarsk agglomeration |
||
|
6 |
Omsk Oblast |
Omsk agglomeration |
||
|
7 |
Kaliningrad Oblast |
Kaliningrad – 431.5 |
||
|
Sovetsk – 41.7 |
||||
|
Baltiysk – 32.7 |
||||
|
Svetlyy – 21.4 |
||||
|
Zelenogradsk – 13.0 |
||||
|
Guryevsk – 12.4 |
||||
|
Pionerskiy – 11.0 |
||||
|
8 |
Irkutsk Oblast |
Irkutsk agglomeration |
||
|
Regions with a MIDDLE level of agglomerative development |
1 |
Republic of Bashkortostan |
Ufa agglomeration |
|
|
2 |
Kemerovo Oblast |
Novokuznetsk agglomeration |
||
|
3 |
Sakha (Yakutia) Republic |
– |
||
|
4 |
Sakhalin Oblast |
– |
||
|
5 |
Komi Republic |
Syktyvkar – 235.0 |
||
|
Yemva – 14.6 |
||||
|
Mikun – 10.7 |
||||
|
6 |
Arkhangelsk Oblast |
Arkhangelsk agglomeration |
||
|
7 |
Chuvash Republic |
Cheboksary – 453.6 |
||
|
Novocheboksarsk – 124.1 |
||||
|
Kanash – 45.6 |
||||
|
Alatyr – 38.2 |
||||
|
Shumerlya – 31.7 |
||||
|
Tsivilsk – 13.5 |
||||
|
8 |
Yaroslavl Oblast |
Yaroslavl-Rybinsk agglomeration |
||
|
9 |
Saratov Oblast |
Saratov agglomeration |
||
|
10 |
Volgograd Oblast |
Volgograd agglomeration |
||
|
11 |
Lipetsk Oblast |
Lipetsk – 508.1 |
||
|
Yelets – 108.4 |
||||
|
Gryazi – 46.8 |
||||
|
Dankov – 21.1 |
||||
|
Lebedyan – 21.0 |
||||
|
Usman – 18.8 |
||||
|
12 |
Smolensk Oblast |
Smolensk – 326.9 |
||
|
Vyazma – 57.1 |
||||
|
Roslavl – 54.9 |
||||
|
Yartsevo – 47.9 |
||||
|
Safonovo – 46.1 |
The number of satellite towns is approximate, as they have been selected as the settlements that formally meet the requirements described in the method [3], as urban settlements that are situated in the zone of “2-hour access by any type of public land and water transport”. The precise determining the boundaries of developing agglomeration requires a depth analysis of region’s administrative and territorial structure, delimitation of attraction and interference zones among settlements, accurate information daily and weekly population’s migration and more detailed calculation of isochrones of agglomeration center availability by all the means of transport.
The number of promising regions with a middle level of agglomerative development join the leading regions here. They are the Sakha Republic (Yakutia), the Sakhalin Oblast, the Komi Republic, the Chuvash Republic, the Lipetsk and Smolensk Oblasts.
Despite the high ratings of the regions in almost all the indicators, only some of them meet the formal characteristics of agglomerations (the population size of a core city should be at least 250,000 people and at least two satellite towns should be situated in the zone of 2-hour access by any type of public transport).
The population density is not sufficient in the Sakhalin Oblast, the Magadan Oblast and Kamchatka Krai to speak about developing active agglomerative process in their territories. Despite the rather favorable territorial organization of Yuzhno-Sakhalinsk urban settlements, which satellites include such towns as Korsakov (33.5 thousand people), Kholmsk (30.9), Dolinsk (12.2), Nevelsk (11.7) and
Aniva (9.1), the population of city’s core is only 181.7 thousand people. Magadan’s population is not sufficient (95.9 thousand people), and there is only one satellite town of Susuman near it. Petropavlovsk-Kamchatsky has two satellites which are the towns of Elizovo and Vilyuchinsk, but it does not meet the criterion of core population size: its population is only 179.5 thousand people.
According to the Regional Department of the Federal State Statistics Service of the Komi Republic, as of January 1, 2012 the population of Syktyvkar has exceeded 254.5 thousand people. This means that “territorial ligament” between the cities of Syktyvkar, Yemva and Mikun can already afford to consider the Komi Republic as a promising region with an average level of agglomerative development.
Though the population of Yakutsk, the economic and cultural center of the Sakha Republic, is 269.5 thousand people, the city has not enough satellite towns. Only sparsely populated town of Pokrovsk, which is located 78 km south-west of the city core, can be considered as its satellite town. In future it is necessary to explore the specificity of these regions in order to improve this approach and limit the impact of socio-economic non-agglomerative indicators.
Besides the regions mentioned above, a list of promising regions include the Tyumen, Murmansk, Kaliningrad, Lipetsk and Smolensk Oblast, as well as the Chuvash Republic and Khabarovsk Krai. These regions meet all the formal criteria and have high ratings in a number of key indicators, so they can be considered as promising regions for the further development of agglomerative processes.
References Measuring the dynamics of agglomerative processes in the regional economy
- Gubanova E.S., Selyakov S.A. Urban agglomeration issues. In: Region’s economy: problems and prospects. Vologda: ISEDT RAS, 2009. No. 46 (April -June). P. 30-40
- Zhikharevich B.S. The institutional dimension of regional socio-economic space: an approach to studying. North-West Economy: Challenges and Prospects. 2011. No. 2-3 (45). P. 46-50.
- Polyan P.M. The method of selecting and analyzing the settlement supporting framework. Part 1. Moscow: IG USSR, 1988. 220 p.
- Regions of Russia. The main socio-economic indicators of cities, 2011. Federal State Statistics Service. Available at http://www.gks.ru/bgd/regl/b11_14t/Main.htm
- Regions of Russia. Socio-economic indicators, 2011. Federal State Statistics Service. Available at: http://www.gks.ru/bgd/regl/b11_14p/Main.htm
- Federal government will fund the Abakan-Chernogorsk agglomeration. Siberian news agency. Khakassia. Available at: http://abakan.sibnovosti.ru/politics/195323-federalnye-vlasti-profinansiruyut-abakano-chernogorskuyu-aglomeratsiyu
