Metallurgical corporations and the state: trends in financial interaction of the last decade

Author: Pechenskaya-polishchuk Mariya A., Malyshev Mikhail K.
Journal: Economic and Social Changes: Facts, Trends, Forecast @volnc-esc-en
Section: Public finance
Article in issue: 3 т.14, 2021.
Free access
The dominant role of big business in the formation of Russia's GDP determines its high importance both for the country's economy as a whole and for the economies of individual regions. In this regard, studies that address the issues of assessing the financial interaction of large corporations with the state are relevant and necessary. Interaction of these economic agents with each other is complex and contradictory, as in modern market conditions the interests of the state and economic entities are multidirectional. The Vologda Research Center of RAS pays attention to studying the influence of large corporations on regional development, in particular on the formation of budget revenues. As a result of the long-term research, we have formed a serious factual base that allows understanding the main interaction features of large businesses with the regional and federal budgets, to determine systemic shortcomings of the state's tax policy including those related to the taxation of profits and income of corporate owners. However, currently, there is no single mechanism in the scientific literature that can be used to most comprehensively assess the financial interaction of large businesses with the region. At the same time, the results of such an assessment can become a serious foundation for justifying many management decisions. The purpose of the study is to assess the trends of financial interaction between the state and corporations on the basis of the developed methodological tools. The authors have tested the methodology in the case of ferrous metallurgy industry. The object of the study is the financial interaction of large ferrous metallurgy corporations (PJSC “Severstal”, PJSC “MMK” and PJSC “NLMK”) with the state. The paper uses the methods of structural (weight) analysis, coefficient analysis linking the microeconomic indicators of enterprises with the macroeconomic indicators of the home regions, the index method, and the method of level estimation when creating the methodological assessment tools.
Interaction assessment, regional economy, budget system, taxation of large corporations, ferrous metallurgy, assessment methods and tools
Short address: https://sciup.org/147235408
IDR: 147235408 | UDC: 330.42 | DOI: 10.15838/esc.2021.3.75.9
Text of the scientific article Metallurgical corporations and the state: trends in financial interaction of the last decade
Introduction to the problem
Large corporations are rather important for Russian economy. This is evidenced by the growing share of large businesses in the country’s GDP since 2010 according to Rosstat. For instance, as of 2019, the share of large businesses in Russia’s GDP was 77.1% which is 1.1 p.p. more than in 2010, and its average value for 10 years is slightly less than 80%1 (Fig. 1).
Figure 1. Share of large business in Russia’s GDP from 2010 to 2019, %

Source: UJSJS and Rosstat data.
In Russia, this indicator is significantly higher than in the developed European countries. For instance, according to Eurostat2, in Germany, Sweden, France, the United Kingdom, and the Netherlands, the share of large businesses for the same period varied from 32 to 45–50%.
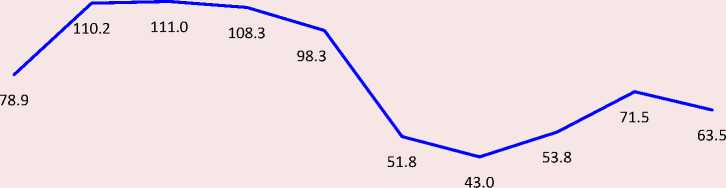
Studying the role of big business is becoming particularly relevant in the current socio-economic situation which is associated with difficult conditions due to the relatively low world prices for hydrocarbons. For example, the price of oil was rather high in 2011–2014. (an average of $ 106.9 per barrel); it decreased more than halved over the next two years and by 2016 was approximately $ 43.0 per barrel (Fig. 2) .
In response to such market conditions, since 2014, the Central Bank of the Russian Federation has introduced the so-called “floating ruble exchange rate” which has increased the dependence of the exchange rate on events in foreign markets and geopolitical circumstances. In the context of high dollar exchange rate, large Russian corporations, which have an impressive share of sales in foreign markets, were able to increase their export revenues and influence on the formation of budget revenues.
The scientific works show high significance of studying the financial cooperation effectiveness between the state and large Russian corporations. N.A. Khilko and V.V. Karginova studied the problems and possibilities of implementing the so-called state-corporate economy in detail [1]. Regarding the impact of large business on sustainable territorial development, E.V. Dobrolezha pointed out that the potential of big companies largely forms the territorial potential [2]. The scientists of the Vologda Scientific Center of RAS V.A. Ilyin and A.I. Povarova devoted their scientific works to the research of this topic [3–6]. The authors have conducted a complex analysis of production and financial activities in the case of Russian and Brazilian metallurgical plants in order to assess their contribution to the formation of budget revenues in the home regions. The works of the Institute of
120.0
100.0
80.0
60.0
40.0
20.0
0.0
Figure 2. Average price* of Brent and Urals crude oil per barrel, US $
2010 2011 2012 2013 2014 2015 2016 2017 2018 2019
Economic Forecasting of RAS study the topic of effective management of the metallurgical industry in detail. For example, I.A. Budanov made an important conclusion based on the conducted research: “It is too early to expect that Russia will create a mechanism that is no less interesting for metallurgy than vertically integrated corporate governance. The formation of a mechanism for interstate and inter-corporate cooperation in the areas of activity related to metallurgy has not only certain prerequisites, but also quite serious limitations. In a rapidly changing economy, there is a need for flexible ways to meet demand at a qualitatively different level, and there is a need for voluntary cooperation mechanisms. The area of joint interests of market participants in the effective use of resources is much broader than the area of potential conflicts related to the need for individual companies to improve their efficiency as the requirements for cooperation participants grow” [7].
Thus, the problem is in the lack of methods that can be used to comprehensively assess the financial interaction of the state and corporations. On this basis, the purpose of the study is to assess the trends of financial interaction between the state and corporations on the basis of the developed methodological tools (for example, ferrous metallurgy corporations).
Based on this purpose, it is necessary to solve the following tasks:
– to analyze the domestic and foreign literature which presents an attempt to assess the financial interaction of enterprises with the state;
– to calculate a number of analytical coefficients that characterize the financial interaction of enterprises with the state, for the formation of budget, tax burden and management impact;
– to calculate indices and integral indeces using the coefficients;
– to evaluate the financial interaction of enterprises with the state on a level scale (for example, large corporations of ferrous metallurgy).
Theoretical basis of the research
To increase the efficiency of interaction between various economic agents, a set of organizational, legal, economic and other measures is necessary to facilitate this process. From this point of view, we should understand what efficiency level has been achieved at the moment. At the same time, in order to predict and plan future management decisions, it is necessary to monitor interaction assessment between economic agents. For instance, Yu.G. Tyurina believes that the assessment of tax revenues to budgets of different levels is essential to create an effective mechanism for the formation of tax potential and forecasting future revenues [8].
The analysis of foreign and domestic literature shows that the existing indicators, which in one way or another indicate the influence of large business on the development of the country and its regions, are concentrated around indicators of the tax burden, profit and various rates. For example, J. Creedy and N. Gemmell consider the asymmetry of corporate tax and effective tax rates [9]. J. Park and Y. Lee revealed growth pattern in corporate payables with an increase in corporate tax [10]. F. Reito and S. Spagano used indicators that characterize the advantages and disadvantages of taxation of joint activities of taxpayers [11]. A. Abdullahi assessed the impact of financial liberalization on the economic growth and development of some African countries. Econometric calculations showed that, on average, financial liberalization had a negative impact on income growth and led to destabilization stimulating domestic capital outflows and increasing the risk of financial instability. In the course of the study, the author applied an evaluation system called the “generalized method of moments” (GMM) which has shown its effectiveness in evaluating semi-parametric models where the parameter of interest is finite-dimensional [12]. A team of Dutch scientists evaluated the interaction between business and the e-Government system using the case of the Netherlands. The results of this study helped to understand the existing differences in assessing the success of e-government projects in reducing the administrative burden on business [13]. I. Leibus focused on studying the dynamics and structure of tax payments in agriculture in Latvia to identify factors that contribute to an increase in the tax burden. As a result of the research, it is concluded that the tax burden in agriculture is growing due to production or the production cost, while the tax burden on capital has been decreasing in recent years [14]. The work of G. Giriiniene carried out a comparative analysis of the tax burden of the tax systems of different countries using the index method. The tax burden index is an important indicator for comparing the international efficiency of tax systems. The scientist also identified and characterized the methods of assessing the tax burden that are most often found in the literature [15]. A study by Lithuanian scientists from the Mikolas Romeris University examines the theoretical and practical aspects of interaction between public administration and business management. Based on the analysis, the authors propose a comprehensive model of interaction between public and private sectors consisting of five dimensions [16].
T.V. Maksimova carries out the systematization of methods for calculating tax burden of economic entities [17]. She examines their advantages and disadvantages drawing attention to a triad of key factors of the tax burden including accounting policies, types of activities of organization and tax regimes.
E.A. Kirova has identified two types of tax burden calculation: absolute and relative [18]. For example, absolute tax burden is calculated as the sum of tax payments paid by the organization, payments to extra-budgetary funds and arrears on payments. Relative tax burden is the ratio of the absolute tax burden to the newly created value. The researcher explains that the absolute tax burden does not reflect the full weight of the tax burden, but only shows the amount of the tax liabilities of the organization.
M.I. Litvin calculates the tax burden of an enterprise as the ratio of the amount of accrued tax payments and deductions to extra-budgetary funds to the amount of the source of funds intended for paying taxes. It is worth noting that this method has a high level of practical significance, as it is used to determine the share of taxes in the total amount of organization’s revenue, profit and wages, depreciation, taxes and net profit in each ruble of the created products. The disadvantage of the method is the absence of personal income tax as a part of tax payments [19].
The assessment of the problem of regional policy development was carried out by well-known regional scientists. For example, O.S. Pchelintsev and M.M. Minchenko analyzed the state of modern infrastructure and its impact on the region’s economy. The rapid depreciation growth of fixed assets in the housing and utilities sector, roads, and heating networks slows down economic development. The authors draw attention to the fact that private investment and business can be attracted to modernization of infrastructure facilities in exchange for reducing tax burden [20].
The series of works by V.A. Ilyin and A.I. Povarova actively use the analysis of specific weights of income tax indicators and their deviations from the norm as methods of scientific research. At the same time, an important component of the research was the calculation of the difference between the estimated income tax at the rate of 20% and actual income tax paid. In addition, the authors analyzed the indicators of dividend payments, management and commercial expenses and remuneration, as well as their ratio to the revenue and net profit of enterprises [21–24].
E.S. Andreeva has evaluated the effectiveness of public-private partnership projects. The author notes that their implementation requires careful control over the effective use of funds. In this regard, the assessment of the overall economic efficiency of projects includes an increase in the domestic regional product, an increase in the budget and financial efficiency of the project. For the analysis of the projects, the article uses such indicators as net discounted income, the return on investment index, the internal rate of return on investment, and the discounted payback period [25].
From all of the above, we can conclude that the existing domestic and foreign works contain a significant number of indicators that can reflect the efficiency of financial cooperation between the state and large corporations. At the same time, methodological issues related to assessing the efficiency of such interaction remain an urgent scientific task.
Methodological provisions
In the study, we propose to perform an assessment according to a certain algorithm. It is advisable to present its linear flowchart in the form of four consecutive stages (Fig. 3) .
At the first stage , it is necessary to calculate the coefficients the choice of which, in our opinion, should be determined by the possibility of using them to determine the role of corporations in the revenues of regional budgets, the “severity” of the fulfillment of tax obligations, as well as the degree of using the financial results of corporations in the interests of shareholders and managers.
In this regard, the above indicators can be used as the basis for methodological tools for assessing the effectiveness of financial cooperation between the state and large corporations. However, it is important to note that most of them characterize the tax burden of economic entities practically ignoring the process of forming budget revenues and social responsibility of business [26; 27].
At the same time, it is these questions that allow assessing the completeness and effectiveness of various areas of cooperation. Therefore, the paper proposes to distinguish three groups of coefficients that will characterize the tax burden of economic entities, their ability to form a budget, as well as the degree of managerial influence.
Figure 3. Stages of evaluating the effectiveness of financial cooperation between corporations and the state
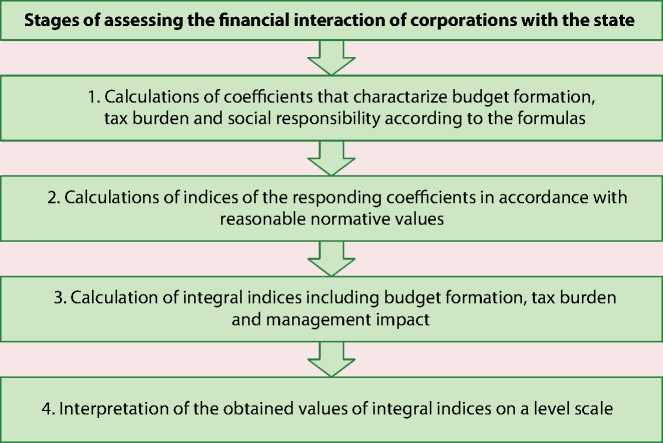
Source: own compilations.
At the same time, the regulatory values of the coefficients should be established on the basis of key Russian regulatory and legislative acts3 concerning the taxation of economic entities, and recommen- dations given in the scientific literature that affect the distribution and dividend policy of companies.
The system of evaluation coefficients taking into account these positions is presented in Table 1 .
Table 1. System of coefficients for evaluating the financial interaction effectiveness between corporations and the state
|
№ |
Coefficient name |
Calculation formula |
Normative value |
Description |
|
Group 1: Budget formation coefficient |
||||
|
1. |
Coefficient of the company’s tax potential Ct.p. |
Company revenue / Tax revenue of the regional budget |
2–10 |
It shows the ratio of the company’s revenue to the tax revenue of the regional budget. A value greater than the norm indicates a high tax potential of the company in the formation of the budget. At the same time, a tenfold excess indicates a strong dependence of the region on the financial result of corporation. |
|
2. |
Coefficient of formation of the regional income tax C f.i.t. |
Company income tax / Total income tax receipts in the regional budget |
0.2–0.5 |
It is defined as the ratio of income tax to total income tax receipts for the region. The increase in the regulatory value indicates a strong dependence of the regional budget on the activities of corporations. |
|
3. |
Coefficient of formation of budgetary income tax on profit Cf.b.i. |
Company income tax / Regional budget revenues |
0.05–0.2 |
It shows the share of income tax in the total budget revenues of the region. If the calculated value exceeds 0.05, then we can talk about the importance of the enterprise in the formation of regional budget revenues. |
|
4. |
Coefficient of formation of the regional property tax C f.r.pr.t. |
Company income tax / Tax property tax receipts in the regional budget |
0.1–0.3 |
It shows the share of the company’s property tax in the total property tax receipts for the region. The higher this indicator, the higher the value of the company’s production assets. |
|
5. |
Coefficient of formation of PIT in the region C f.pit.r. |
Company PIT / Total PIT receipts in the budget |
0.1–0.2 |
It shows the share of the company’s PIT in the total income tax receipts for the region. An estimated value of more than 0.2 indicates a high level of wages at the company, as well as a large number of workers. |
|
6. |
Coefficient of the federal budget balance for VAT C f.b.bal.vat |
Company VAT / Income tax to the federal budget |
0–100 |
It shows the ratio of the value added tax to the corporate income tax transferred to the federal budget. A positive calculated value indicates that the federal budget does not reimburse VAT in favor of the company. |
|
Group 2: Tax burden coefficient |
||||
|
1. |
Coefficient of tax burden on revenue Ct.b.rev. |
Company income tax/ Company revenue |
0.02–0.1 |
It determines the share of the company income tax in the total amount of its revenue. |
|
2. |
Coefficient of tax burden on gross profit Ct.b.gr.pr. |
Company income tax/ Company gross profit |
0.06–0.15 |
It is calculated as the ratio of income tax to gross profit. |
|
3. |
Coefficient of tax burden on taxable base C t.b.tax.ba. |
Company income tax / Profit before the company’s tax |
0.17–0.2 |
It shows the share of income tax in profit before tax. The statutory income tax rate is 20%, i.e. 0.2. However, the share of income tax in the range from 0.17 to 0.2 is also the norm, as this situation may be associated with the transfer of income tax payments to future periods or the provision of tax benefits under investment agreements, joint projects of regional authorities and corporations. |
End of Table 1
|
№ |
Coefficient name |
Calculation formula |
Normative value |
Description |
|
Group 3: Management impact coefficient |
||||
|
1. |
Coefficient of net profit distribution for dividends C n.pr.div. |
Dividends to stakeholders / Enterprise’s net profit |
0.4–0.6 |
It shows the share of dividends in the amount of net profit. Exceeding the standard value indicates the use of the company’s net profit in the owners’ interests and a decrease in the company’s investment potential. However, if less than 40% of the net profit is allocated for the payment of dividends, the company’s investment attractiveness for shareholders and investors decreases. |
|
2. |
Coefficient of management load on revenue C man.l.rev. |
Company’s management expenses / Company revenue |
0.03–0.09 |
It shows the share of management expenses in total revenue. Exceeding the standard value indicates the use of revenue for the purpose of enriching the company’s management personnel. |
|
3. |
Coefficient of management load for gross profit C man.l.gr.pr. |
Company’s management expenses / Company’s gross profit |
0.1–0.2 |
It is calculated as the ratio of management expenses to the total amount of gross profit. Exceeding the standard value indicates the use of gross profit in the managers’ interests. |
|
Source: own compilations. |
||||
At the second stage of the assessment, we offer to calculate the indices for the identified coefficients in accordance with the standard values. It is worth noting that when justifying the calculations, we relied on previously developed methodological tools that were successfully tested in Russian regions [28–32]. For the first and second groups, the coefficient growth leads to an increase in the level of financial interaction, so their indices are calculated using the formula:
which consists in calculating the group indices of financial interaction (IBF, ITB, IMI). Absence of additional weight coefficients, assignment of the indices to equal significance and establishment of a single standard predetermined the use of the arithmetic mean of the indices according to formulas 3–5:
Ixi = Xi – Xmin / Xmax – Xmin,
where Ixi –index for the coefficient;
Xi –coefficient value;
Xmin – lower limit of norm;
Xmax – upper limit of norm.
Due to the fact that the growth of coefficients in the third group negatively affects the financial interaction level, the formula for calculating the indices will have the following form:
Ixi = Xmax – Xi / Xmax – Xmin.
Obtaining the calculated values of the indices allows proceeding to the third assessment stage
where IBF– private budget formation index,
ITB – private tax burden index,
IMI– private management impact index, n – number of indices in a group.
The final fourth stage is the calculation and interpretation of the integral assessment of the financial interaction level between big business and the state (I) based on formula 6:
I= ∑(I BF + I TB + I MI ) / n. (6)
To determine the financial interaction level between big business and the state in accordance with the integral indicator values, we have proposed a scale of intervals and identified seven effectiveness levels.
The first level is “critical”: the calculated value of the integral index is below 0.
The role of the company in the regional budget revenues is very small, the VAT reimbursed from the federal budget in favor of the enterprise is much more than the income tax receipts to the federal budget, the enterprise has a low tax burden, the profit tax rate is less than 5%, dividend payments are made even if the financial result is unprofitable.
The second level is “low”: the calculated value of the integral index is in the range from 0 to 0.2.
The role of the company in the regional budget revenues is small, VAT reimbursable in favor of the enterprise is greater than the income tax receipts to the federal budget, the profit tax rate varies from 5 to 8%, either the entire net profit is allocated to dividends, or slightly more, management costs lead to a significant reduction in the tax base.
The third level is “satisfactory”: the calculated value of the integral index is in the range from 0.2 to 0.4.
The role of the company in the regional budget revenues is insignificant, the amount of VAT reimbursed is equal to the income tax receipts, profit tax rate varies from 8 to 11%, and 80 to 100% of net profit is allocated for dividends. The management workload is quite high.
The fourth level is “average”: the calculated value of the integral index is in the range from 0.4 to 0.6.
The company has an average significance in the formation of budget revenues, VAT recoverable amount is lower than the income tax receipts to the federal budget, and profit tax rate varies from 11 to 14%, and from 60 to 80% of net profit is allocated for dividends. Management costs are within the normal range.
The fifth level is “sufficient”: the calculated value of the integral index is in the range from 0.6 to 0.8.
The company largely generates regional budget revenues, the amount of VAT reimbursed from the federal budget does not exceed income tax receipts, sufficient tax burden, profit tax rate varies from 14 to 17%, and 50 to 60% of net profit is allocated for dividends.
The sixth level is “high”: the calculated value of the integral index is in the range from 0.8 to 1.
Regional budget revenues depend significantly on the results of the enterprise’s production and financial activities, the amount of VAT reimbursed is significantly less than income tax receipts to the federal budget, a high level of tax burden, profit tax rate is in the range of 17 to 20%, management costs are insignificant, up to 50% of net profit is allocated for dividends.
The seventh level is “very high”: the calculated value of the integral index is above 1.
The company is the main donor of the regional budget revenues, VAT from the federal budget is not reimbursed, the high tax burden, the tax rate within 20%, the interests of shareholders and managers do not go against the socio-economic development of the territories. The dividends amount to about 40% of the net profit, which allows the company to have a high investment potential and accumulate retained earnings.
Thus, the results of interpretation of the integral index values will become the basis for the adoption of state policy measures aimed at expanding cooperation and improving interaction efficiency with large businesses in order to implement the tasks of economic development of the country and its territories.
Research results
The authors propose to carry out testing of the developed methodology on Russian ferrous metallurgy corporations. This is due to the fact that ferrous metallurgy is one of the most developed and important branches of industrial production, the successful development of which determines the industrial potential and capabilities of many countries including Russia. The industry includes the extraction and processing of raw materials, production of cast iron, steel, rolled products, roofing iron, rail, etc. Consumers of its products are the military-industrial complex, mechanical engineering, automotive industry, construction, pipe production, oil and gas and many other industries4. It is no coincidence that the objects of the study are PJSC “Severstal”, PJSC “Magnitogorsk Iron and Steel Works” and PJSC “Novolipetsk Steel Works” – Russian enterprises of the ferrous metallurgy industry that are of great importance in their segment in terms of steel production and the formation of regional budgets.
Domestic steel companies Severstal, MMK, and NLMK are the leaders of Russian production and are among the top 50 global companies (Tab. 2) .
Among Russian corporations, Novolipetsk Steel became the leader in production growth during the study period (+4.7%). Severstal reduced its production volumes by almost 20%, largely due to the liquidation of Severstal Columbus and Severstal Deaborn production assets in North America. At the Magnitogorsk Iron and Steel Works, reduction in steelmaking volumes was insignificant and amounted to 3.8% from the level of 2012. As a result, the share of Russian companies in global steel production decreased from 2.7% to 2.1%, respectively.
Based on the developed methodology, we will assess the financial interaction level between the state and large corporations in the case of PJSC “Severstal”, PJSC “Magnitogorsk Iron and Steel Works” and PJSC “Novolipetsk Steel” in the period from 2010 to 2019. The authors use the financial statements of the companies5 which are publicly available on the Internet, as well as data from the
Table 2. Steel production of the world’s largest companies in 2012–2019.
|
Company |
2012 |
2015 |
2019 |
Change, 2019 to 2012 |
|||||||
|
Mil. tn |
%* |
Place** |
Mil. tn |
%* |
Place ** |
Mil. tn |
%* |
Place ** |
% |
Place |
|
|
Five largest companies |
|||||||||||
|
ArcelorMittal (Luxembourg) |
93.6 |
6.0 |
1 |
97.1 |
6.0 |
1 |
97.3 |
5.2 |
1 |
104.0 |
no change |
|
China Baowu Group (China) |
79.1 |
5.1 |
4 |
60.7 |
3.7 |
5 |
95.5 |
5.1 |
2 |
120.7 |
+2 |
|
NSSMC (Japan) |
47.9 |
3.1 |
2 |
46.4 |
2.9 |
3 |
51.7 |
2.8 |
3 |
107.9 |
–1 |
|
HBIS Group (China) |
42.8 |
2.7 |
3 |
47.8 |
2.9 |
2 |
46.6 |
2.4 |
4 |
108.8 |
–1 |
|
POSCO (South Korea) |
39.9 |
2.6 |
5 |
41.9 |
2.6 |
4 |
43.1 |
2.3 |
5 |
108.1 |
no change |
|
Russian companies |
|||||||||||
|
NLMK |
14.9 |
0.95 |
20 |
16.1 |
0.99 |
19 |
15.6 |
0.83 |
21 |
104.7 |
–1 |
|
ММК |
13.0 |
0.80 |
26 |
12.2 |
0.75 |
31 |
12.5 |
0.67 |
32 |
96.2 |
–6 |
|
Severstal |
15.1 |
0.96 |
19 |
11.5 |
0.70 |
33 |
11.9 |
0.63 |
37 |
78.8 |
–18 |
|
Total |
43.0 |
2.7 |
– |
39.8 |
2.4 |
– |
40.0 |
2.1 |
– |
93.0 |
– |
|
* Share in global steel production. ** Place in the ranking of the 50 largest global companies. Source: World Steel Association data. |
|||||||||||
4 Role of ferrous metallurgy in the global economy. Available at:
5 Financial statement of the PJSC “Severstal”. Available at: results/; Financial statement of the PJSC “ММК”. Available at: ; Financial statement of the PJSC “NLМК”. Available at:
Federal Tax Service6 and Rosstat for the Vologda7, Chelyabinsk8 and Lipetsk9 Oblasts.
Calculations of the coefficients, proposed in the methodological tools, indicate the following key trends.
First, due to the tenfold increase in income tax in PJSC “Severstal”, the corporation’s role in generating regional budget revenues has increased which has led to an increase in the regional profit tax rate, as well as the income tax rate for budget revenues. It is worth noting that the period from 2012 to 2015 which was characterized by introducing Consolidated Taxpayers Group and unprofitable financial result of some combines led to a decrease in the role of these corporations in the formation of regional budgets (Tab. 3) .
Secondly, the values of the tax burden coefficients relative to revenue and gross profit of PJSC “Severstal” have significantly increased (an increase of 1.5 and 1.6 times, respectively; Tab. 4). The highest average tax burden for both revenue and gross profit is typical for PJSC “NLMK” (3.8 and 15.8%), in the second place is PJSC “MMK” (2.5 and 9.0%), in third – PJSC “Severstal” (2.0 and 7.7%), respectively. The reason for the revealed discrepancies between the companies is the absence of a consolidated tax regime in relation to the Magnitogorsk Iron and Steel Works, and its insignificant impact on the tax base of the Novolipetsk Steel Works.
Third, the share of dividends in NLMK’s net profit increased 3.7 times during the period, and in 2018–2019, it exceeded its size altogether which led to the use of even a part of retained earnings for this purpose. In the net profit of the Magnitogorsk Iron and Steel Works, the share of dividends increased by 7.1 times. All companies in one period or another were characterized by dividend payments with unprofitable financial results (in 2010, 2011 and 2014 – PJSC “Severstal”, in 2014 –
Table 3. Share of profit tax of metallurgical plants in total income tax receipts for the region and in regional budget revenues from 2010 to 2019
|
Period |
Share of corporate income tax in total income tax receipts, % |
Share of corporate income tax in regional budget revenues, % |
||||
|
PJSC “Severstal” |
PJSC “ММК” |
PJSC “NLМК” |
PJSC “Severstal” |
PJSC “ММК” |
PJSC “NLМК” |
|
|
2010 |
40.4 |
8,.7 |
47.4 |
9,4 |
1,5 |
11,6 |
|
2011 |
34.1 |
10.8 |
50.2 |
8,1 |
1,9 |
13,1 |
|
2012 |
6.3 |
9.0 |
41.8 |
1,3 |
1,4 |
9,1 |
|
2013 |
12.9 |
0.0 |
45.7 |
1,4 |
0,0 |
9,1 |
|
2014 |
8.0 |
0.6 |
61.5 |
1,1 |
0,1 |
14,9 |
|
2015 |
5.4 |
30.1 |
72.5 |
0,6 |
6,4 |
22,3 |
|
2016 |
22.6 |
37.6 |
58.4 |
3,9 |
8,6 |
16,6 |
|
2017 |
35.4 |
30.0 |
56.1 |
7,6 |
7,6 |
14,9 |
|
2018 |
54.0 |
38.0 |
68.2 |
15,0 |
10,2 |
22,7 |
|
2019 |
49.1 |
29.7 |
58.7 |
12,3 |
6,8 |
15,7 |
|
Average for 2010–2019 |
26.8 |
19.5 |
56.1 |
6,1 |
4,4 |
15,0 |
|
2019 to 2010, times |
1.2 |
3.4 |
1.2 |
1,3 |
4,5 |
1,4 |
Source: data of the FTS of Russia for the Vologda, Chelyabinsk and Lipetsk Oblasts.
Table 4. Share of profit tax on metallurgical plants in revenue, gross profit and profit before tax from 2010 to 2019
|
Period |
Share of income tax in revenue, % |
Share of income tax in gross profit, % |
||||
|
PJSC “Severstal” |
PJSC “ММК” |
PJSC “NLМК” |
PJSC “Severstal” |
PJSC “ММК” |
PJSC “NLМК” |
|
|
2010 |
2.5 |
1.0 |
2.9 |
9.8 |
5.7 |
10.7 |
|
2011 |
2.0 |
1.1 |
3.2 |
9.5 |
7.4 |
14.9 |
|
2012 |
0.7 |
0.8 |
1.9 |
3.8 |
5.0 |
13.5 |
|
2013 |
0.6 |
0.0 |
2.4 |
3.5 |
0.0 |
20.7 |
|
2014 |
0.9 |
0.1 |
3.7 |
3.6 |
0.2 |
15.3 |
|
2015 |
0.7 |
3.5 |
5.0 |
2.1 |
11.4 |
17.8 |
|
2016 |
1.4 |
4.6 |
4.1 |
4.6 |
14.8 |
14.1 |
|
2017 |
3.2 |
4.1 |
3.8 |
11.6 |
14.0 |
14.1 |
|
2018 |
4.1 |
5.4 |
5.5 |
13.2 |
16.6 |
16.8 |
|
2019 |
3.7 |
4.0 |
5.1 |
15.5 |
14.6 |
20.2 |
|
Average for 2010–2019 |
2.0 |
2.5 |
3.8 |
7.7 |
9.0 |
15.8 |
|
2019 to 2010, times |
1.5 |
4.0 |
1.8 |
1.6 |
2.6 |
1.9 |
Source: data of the financial statement of the PJSC “Severstal”, PJSC “MMK”, and PJSC “NLMK”.
PJSC “MMK” and in 2013 – PJSC “NLMK”). The largest average share of dividends in net profit is typical for PJSC “Severstal” (0.89); in second place is the Novolipetsk Plant (0.79), in third place – PJSC “MMK” (0.40) (Tab. 5). This leads to the conclusion that the management of the Magnitogorsk Iron and Steel Works conducts a more restrained distribution policy. This is evidenced by the place of the main owner of PJSC “MMK”, Viktor Rashnikov, in the ranking of the richest people in Russia. As of 2020, it loses 11 positions to the owner of PJSC “Severstal”, Alexey Mordashov, and 13 positions to the owner of PJSC “NLMK”, Vladimir Lisin.
Table 5. Share of dividends in net profit (loss) of metallurgical plants from 2010 to 2019
|
Period |
PJSC “Severstal” |
PJSC “MMK” |
PJSC “NLMK” |
|||
|
Share of dividends in net profit *** |
Deviation from the average norm (0,5) |
Share of dividends in net profit |
Deviation from the average norm (0,5) |
Share of dividends in net profit |
Deviation from the average norm (0,5) |
|
|
2010 |
(0.17)* |
- |
0.15 |
-0.35 |
0.34 |
-0.16 |
|
2011 |
(8.02)* |
- |
0 |
-0.50 |
0.35 |
-0.15 |
|
2012 |
0.66 |
0.16 |
0.40 |
-0.11 |
0.17 |
-0.33 |
|
2013 |
0.86 |
0.36 |
0 |
-0.50 |
(0.31)* |
- |
|
2014 |
(4.71)* |
- |
(2.85)* |
- |
0.73 |
0.23 |
|
2015 |
1.23 |
0.73 |
0.32 |
-0.18 |
0.83 |
0.33 |
|
2016 |
0.80 |
0.30 |
0.32 |
-0.18 |
1.52 |
1.02 |
|
2017 |
0.71 |
0.21 |
0.46 |
-0.04 |
0.77 |
0.27 |
|
2018 |
1.08 |
0.58 |
0.90 |
0.40 |
1.16 |
0.66 |
|
2019 |
0.92 |
0.42 |
1.07 |
0.57 |
1.25 |
0.75 |
|
Average for 2010–2019 |
0.89 |
0.39 |
0.40 |
-0.10 |
0.79 |
0.29 |
|
2019 to 2010, times |
– |
– |
7.1 |
-1.6 |
3.7 |
-4.7 |
* Share of dividends in the loss is in parentheses.
** Excluding dividend payments in case of losses.
*** In net profit.
Source: data of the financial statement of the PJSC “Severstal”, PJSC “MMK”, and PJSC “NLMK”.
It is worth noting that tax optimization through dividends is undesirable, as it can lead to abuse; investment promotion should be carried out by directly linking the amount of capital investment and tax benefits (for example, through tax deductions for certain types of investments).
Fourth, management loan on revenue for 10 years decreased by 0.3 p. p. at PJSC “Severstal”; by 1.4 p. p. at PJSC “MMK” and increased by 0.2 p. p. at the Novolipetsk Plant. However, this situation can be regarded as a deliberate preservation of net profit volume for implementing dividend payments. The largest volume and share of management expenses in terms of revenue and gross profit for all metallurgical plants occurred in 2012 and 2013. Magnitogorsk Iron and Steel Works reduced management expenses in the structure of gross profit by 10.6 p. p. (Tab. 6) .
Next, we will proceed to the calculation of the integral coefficient of financial interaction level between the state and large corporations.
The financial interaction level between PJSC “Severstal” and PJSC “NLMK” with the state has decreased by 36% and 11%, respectively, over the previous 10 years, while that of PJSC “MMK” has increased by 32% (Fig. 4) .
The decrease in income tax receipts from PJSC “Severstal” to the Vologda Oblast budget as a result of creating a consolidated group of taxpayers, as well as increasing in dividend payments at losses, affected the financial interaction level which in the period from 2012 to 2016 can be described as critical.
After 2016, there was a convergence of the financial interaction level between the three studied corporations and the state which allows formulating the following conclusions regarding the assessment of interaction efficiency level between the state and the studied corporations for 2010–2019:
– the level of state-corporate financial cooperation was mainly assessed as low;
– except a sharp drop in 2014, the efficiency level was approximately at the same level which indicates the stagnant operation of the interaction mechanism;
– dynamic trend of interaction assessment indicates a sharp drop in its level in 2014 which is explained by the payment of dividends to shareholders the amount of which repeatedly exceeded the amount of losses;
– the financial interaction level between PJSC “Severstal” and the state was mainly assessed as “critical” and “low”;
Table 6. Share of management expenses in the structure of revenue and gross profit of metallurgical plants from 2010 to 2019, %
|
Period |
Share of management expenses in revenue, % |
Share of management expenses in gross profit, % |
||||
|
PJSC “Severstal” |
PJSC “MMK” |
PJSC “NLMK” |
PJSC “Severstal” |
PJSC “MMK” |
PJSC “NLMK” |
|
|
2010 |
3.7 |
3.0 |
3.4 |
14.9 |
16.6 |
12.6 |
|
2011 |
3.7 |
2.7 |
3.2 |
17.5 |
18.5 |
14.9 |
|
2012 |
5.3 |
3.1 |
3.3 |
28.4 |
19.2 |
22.9 |
|
2013 |
4.4 |
3.2 |
3.8 |
24.4 |
24.3 |
33.0 |
|
2014 |
3.8 |
2.5 |
3.8 |
14.1 |
10.9 |
15.7 |
|
2015 |
3.4 |
1.9 |
3.0 |
10.1 |
6.1 |
10.8 |
|
2016 |
3.7 |
1.7 |
4.1 |
12.0 |
5.5 |
14.3 |
|
2017 |
3.3 |
1.6 |
3.3 |
11.9 |
5.4 |
12.3 |
|
2018 |
3.0 |
1.4 |
3.3 |
9.4 |
4.4 |
10.0 |
|
2019 |
3.4 |
1.6 |
3.6 |
14.4 |
6.0 |
14.2 |
|
Average for 2010– 2019 |
3.8 |
2.3 |
3.5 |
15.7 |
11.7 |
16.1 |
|
2019 to 2010, times |
-0.3 |
-1.4 |
+0.2 |
-0.5 |
-10.6 |
+1.6 |
Source: data of the financial statement of the PJSC “Severstal”, PJSC “MMK”, and PJSC “NLMK”.
Figure 4. Dynamics of integral coefficient of financial interaction of metallurgical corporations with the state from 2010 to 2019
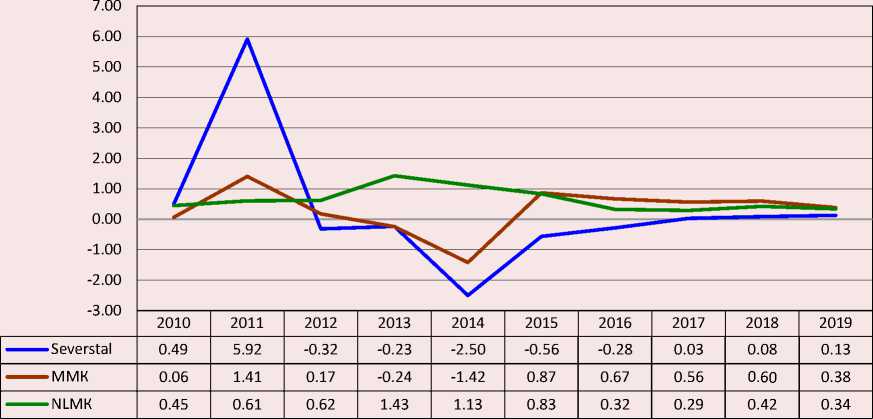
Source: own compilations.
– the highest estimates were for the financial interaction between the state and PJSC “NLMK” which is due to the estimated profit tax rate and the significant role of the company in the regional budget revenues;
– all corporations used the profits to a greater or lesser extent for the owners’ benefit (paying significant amounts of dividends even with losses).
Conclusion and suggestions
Carried out with the help of the developed methodological tools, the assessment of trends in interaction of metallurgical corporations and the state indicates that the financial interaction of these economic agents is not sufficiently effective. During the period, the mechanism of corporate governance has become so strong that it can build an alternative vertical of corporate power to state power which primarily meets the corporation needs, and already on a residual basis – the population needs of the home territories. Moreover, the current corporate governance mechanism continues to be supported by government policy measures, which is confirmed by the growing number of trading transactions, the unhindered opportunities to direct financial flows in favor of the final offshore beneficiaries, and the existence of legal ways to optimize tax. If Russian legislation limited such assumptions, the budget population security in the regions where large corporations are based could significantly increase improving the quality of public services and living standards.
The study has showed that drastic measures are required to improve the fiscal function of large corporations that:
– first, they assume an inventory of the rules governing the taxation of profits in order to exclude the institutional opportunities for corporations to implement tax optimization;
– second, they are reviewing the mechanism for returning export VAT and adjusting the approaches to applying the zero VAT rate for export operations.
Projects of budget-forming enterprises should not contradict the strategies of territorial development of the region, but comply with the principles of social partnership and social responsibility of business.
From this point of view, there is an urgent need to create and scientifically substantiate the organizational and economic mechanism of interaction between the state and large corporations which will contribute to realization of constitutional rights of citizens, correspond to national goals and priorities, as well as be linked to the tasks and instruments of state financial policy.
This study contributes to the development of theoretical science and forms the basis for further reflection on the financial interaction assessment of corporations and the state. It is worth noting that our further research is supposed to focus on the indepth identification of the causal relationships of obtaining such evaluation results that significantly deviated from the regulatory level, as well as development of measures aimed at improving interaction effictiveness between the state and large corporations, and organizational and economic mechanism.
In addition, the results of the work can be used by the state authorities of the entities of the Russian Federation in assessing the contribution of corporations to replenishment of regional budgets and forecasting threats to reduce the budget security of territorial systems.
References Metallurgical corporations and the state: trends in financial interaction of the last decade
- Khil'ko N.A., Karginova V.V. Corporate modernization of the economy is a necessary condition for increasing its competitiveness. Prostranstvo ekonomiki=Terra Economicus, 2009, no. 2–3, pp. 45–49 (in Russian).
- Dobroleja E.V. Implication of large corporations’ financial resources into socio-economic potential of Russian regions. Natsional'nye interesy: prioritety i bezopasnost'=National Interests: Priorities and Security, 2011, no. 36 (129), pp. 59–63 (in Russian).
- Ilyin V.A., Povarova A.I., Sychev M.F. Vliyanie interesov sobstvennikov metallurgicheskikh korporatsii na sotsial'no-ekonomicheskoe razvitie [Influence of Metallurgical Corporation Owners' Interests on Socio-Economic Development]. Vologda: ISEDT RAS, 2012. 102 p.
- Ilyin V.A., Povarova A.I. Vliyanie metallurgicheskikh korporatsii na formirovanie dokhodov regional'nykh byudzhetov (2007–2016) [Influence of Metallurgical Corporations on the Formation of Regional Budget Revenues (2007–2016)]. Vologda: VolRC RAS, 2019. 198 p.
- Ilyin V.A., Povarova A.I. Krupneishie metallurgicheskie korporatsii i ikh rol' v formirovanii byudzhetnykh dokhodov: monografiya [Largest Metallurgical Corporations and their Role in the Formation of Budget Revenues: Monograph]. Vologda: VolRC RAS, 2019. 204 p.
- Povarova A.I. Metallurgical regions: Key trends and socio-economic development issues. Problemy razvitiya territorii=Problems of Territory's Development, 2015, no. 6 (80), pp. 37–50 (in Russian).
- Budanov I.A. Management of the development of metallurgy and the global metal market. Problemy prognozirovaniya=Studies on Russian Economic Development, 2020, no. 6, pp. 104–118 (in Russian).
- Tyurina Yu.G. Methodological and practical problems of the regional tax potential evaluation. Izvestiya OGAU=Izvestia of Orenburg State Agrarian University, 2013, no. 6 (44), pp. 155–157 (in Russian).
- Creedy J., Gemmell N. Corporation tax asymmetries: Effective tax rates and profit shifting. International Tax and Public Finance, 2011, vol. 18, pp. 422–435.
- Park J., Lee Y. Corporate income taxes, corporate debt, and household debt. International Tax and Public Finance, 2019, vol. 26, iss. 3, no. 3, pp. 506–535.
- Reito F., Spagano S. Joint liability taxation and group auditing. Economia Politica, 2017, vol. 34, pp. 305–327.
- Abdullahi D.A. Effects of financial liberalization on financial market development and economic performance of the SSA region: An empirical assessment. Economic Modelling, 2013, vol. 30, pp. 261–273. DOI: https://doi.org/10.1016/j.econmod.2012.09.019
- Arendsen R., Oscar Peters O., Hedde M., Dijk J. Does e-government reduce the administrative burden of businesses? An assessment of business-to-government systems usage in the Netherlands. Government Information Quarterly, 2014, vol. 31, iss. 1, pp. 160–169.
- Leibus I. Assessment of agricultural tax burden in Latvia. Economic Science for Rural Development Conference Proceedings, 2017, vol. 46. pp. 272–278.
- Giriiniene G. Analysis of assessment methods of tax burden: Theoretical aspect. Economics and Management, 2012, vol. 17, no. 3, pp. 823–828. DOI: https://doi.org/10.5755/j01.em.17.3.2089
- Gudelis D., Guogis A. Integrating public and business management: A model of interaction between public and private sectors. Int Rev Public Nonprofit Mark, 2011, vol. 8, pp. 1–9. DOI: https://doi.org/10.1007/s12208-010-0063-4
- Maksimova T.V. Calculation of tax burden of the economic entity: Theory and practice. Vestnik YuUrGU. Seriya «Ekonomika i menedzhment»=Bulletin of South Ural State University, Series “Economics and Management”, 2015, vol. 9, no. 2, pp. 110–116 (in Russian).
- Kirova E.A. Methodology for determining the tax burden on business entities. Finansy=Finance, 1998, no. 9, pp. 30–42 (in Russian).
- Litvin M.A. Tax burden and economic interests of enterprises. Finansy=Finance, 1998, no. 5, pp. 29–31 (in Russian).
- Pchelintsev O.S., Minchenko M.M. Regional infrastructure as a condition for economic growth. Problemy prognozirovaniya=Studies on Russian Economic Development, 2004, no. 6, pp. 1–16 (in Russian).
- Ilyin V.A., Morev M.V., Povarova A.I. Russian "capitalism for the few" (case study of major ferrous metallurgy corporations). Obshchestvo i ekonomika=Society and Economy, 2019, no. 12, pp. 22–58. DOI: 10.31857/S020736760007835-7 (in Russian).
- Ilyin V.A. Private capital and national interests. A case study of metallurgical corporations' owners. Vestnik Rossiiskoi akademii nauk=Herald of the Russian Academy of Sciences, 2013, no. 7, pp. 579–586 (in Russian).
- Ilyin V.A., Povarova A.I. Consolidated taxation and its consequences for regional budgets. Ekonomika regiona=Economy of Region, 2019, no. 4, pp. 70–83. DOI: 10.17059/2019-1-6 (in Russian).
- Ilyin V.A., Povarova A.I. Failures of big business tax administration and their impact on regional budgets. Ekonomika regiona=Economy of Region, 2017, no. 1, pp. 51–57 (in Russian).
- Andreeva E.S. Evaluation of the effectiveness of public-private partnership projects: A methodological approach. Vestnik Kazanskogo tekhnologicheskogo universiteta=Bulletin of the Kazan Technological University, 2013, no. 12, pp. 300–303 (in Russian).
- Malyshev M.K. On the social responsibility of big business (case study of PAO “Severstal”). Sotsial'noe prostranstvo=Social Area, 2020, vol. 6, no. 1. Available at: http://socialarea-journal.ru/article/28502. DOI: 10.15838/sa.2020.1.23.5 (in Russian).
- Malyshev M.K. The role of big business in the development of territories (illustrated by steel-making corporations of Russia). Vestnik Rossiiskogo ekonomicheskogo universiteta imeni G.V. Plekhanova=Vestnik of the Plekhanov Russian University of Economics, 2020, no. 17 (6), pp. 144–155. DOI: https://doi.org/10.21686/2413-2829-2020-6-144-155 (in Russian).
- Pechenskaya M.A. Budget potential of municipal entities: Assessment and directions for development (on the example of Vologda Oblast). Problemy prognozirovaniya=Studies on Russian Economic Development, 2019, no. 4, pp. 120–131 (in Russian).
- Pechenskaya M.A. Region and federal center: State and evaluation of the effectiveness of budgetary relations. Audit i finansovyi analiz=Audit and Financial Analysis, 2013, no. 5, pp. 397–404 (in Russian).
- Pechenskaya-Polishchuk M.A. Instruments and principles of reallocating budgetary resources in the region. Ekonomicheskie i sotsial'nye peremeny: fakty, tendentsii, prognoz=Economic and Social Changes: Facts, Trends, Forecast, 2020, vol. 13, no. 2, pp. 71–88 (in Russian).
- Gubanova E.S., Kleshch V.S. Methodological aspects in analyzing the level of non-uniformity of socio-economic development of regions. Ekonomicheskie i sotsial'nye peremeny: fakty, tendentsii, prognoz=Economic and Social Changes: Facts, Trends, Forecast, 2017, vol. 10, no. 1, pp. 58–75. DOI: 10.15838/esc.2017.1.49.4 (in Russian).
- Yashin S.N., Korobova Yu.S. A method for calculus of integral index of the region's innovative development. Finansovaya analitika: problemy i resheniya=Financial Analytics: Science and Experience, 2017, no. 4 (334), pp. 360–374 (in Russian).
