Method and device for compression of the non stationary signals

Author: Panko Sergey P., Mishurov Andrey V., Andyuseva Valentina G.
Journal: Журнал Сибирского федерального университета. Серия: Техника и технологии @technologies-sfu
Article in issue: 6 т.7, 2014.
Free access
In the report a new method and the operation of the device of statistical compression of non-stationary pulse signals are described. The pulse signals are characterized by, first of all, weak irregular period of signal, e.g. electro cardio signals (ECS). It is shown that construction and processing the ECS histogram provide high value of the compression.
Signal compression, ecs, electro cardio signals
Short address: https://sciup.org/146114884
IDR: 146114884 | UDC: 621.396.44
Метод и устройство для сжатия нестационарных сигналов
Описан новый способ и представлена работа устройства статистического сжатия нестационарных импульсных сигналов. Импульсные сигналы характеризуются в первую очередь слабым нерегулярным периодом сигнала, например электрокардиосигналы (ЭКС). Показано, что создание и обработки гистограммы ЭКС обеспечивают высокое значение сжатия.
Text of the scientific article Method and device for compression of the non stationary signals
Research motivation for the signal compression
The strategic task for signal compression has a long history and it has become the most popular in the era of mass distribution of digital transfer information because it provides, the greatest reduced traffic.
Compression of digitized almost periodic non-stationary ECS signals is a very important area of telemedicine services, especially in remote Holter monitoring associated with the transmission over loaded communication networks.
Non-stationary ECS results from the influence of respiratory and other human activities on the heart, violations of rhythm, which are called “arrhythmia”. Arrhythmias are expressed in irregular occurrence of cardiac contractions (“extrasystoles”) or in a sharp and short-term increase in the duration of RR interval. Individual features of the patient influence greatly the unsteadiness of ECS.
Research of ECG signal compression is motivated, first of all, by decrease of traffic and its costs.
Effectiveness of the compression procedures
The effectiveness of the compression procedure is defined by the following:
-
• compression Ratio (CR) is defined as the ratio of the number of bits required to represent the original (Org) and compressed signals;
-
• the differences between restored (Rec) signal and original (Org):
PRD = 100%
^JO^gfO^ecaTF z fLj org]2 .
where N is the length of window in the number of samples in the signal.
It is clear that using compression does not lead to the loss of information PRD=0%.
A brief overview of the most common compression techniques
Theoretical and applied researches in this field have been studied by many experts, the results of the research are published in many works. One of the earliest compression techniques of digitize ECS is the AZTEC (the Amplitude Zone Epoch Time Coding) [1]. The ECS is considered to consist of flat areas and “tilts”.
АZTEC provides a high compression ratio (CR = 10:1 at a frequency of samples 500 Hz, resolution ADC 12 bit/sample), but the quality of the restored signal is very low.
In [2] they reduce the average value of RR intervals from a fixed realization of the RR intervals. Residual data is encoded using first differences.
In [3] the curvature of the digitized signal at the points of each signal “turn” (breaks) is evaluated in the distinguished point. Curvature at the point (X, Y) is an arbitrary curve which is non-linear combination of the first and second derivatives. In two-dimensional space it is determined by the formula:
Cur =
g2Y/gx2 ii+(^i^ "
Subject of the transmission, is not all the digitized signal sampling, but only specific points. Reconstruction of the ECS is made by interpolation of transferred distinguished points with a straight line, polynomial, cubic spline or another functions.
Passing parameters of the approximation of a Bezier curve also provides a reduction in traffic, but, of course, increases the amount of computational procedures in the process of restoration of the initial signal.
Great attention of researchers is paid to the use of wavelet-transformation properties to reduce traffic, and particularly the application of the SPIHT algorithm to encode the coefficients of the wavelet transform of the ECG signal [5]. SPIHT Algorithm (Set Partitioning in Hierarchical Trees) is incorporated method of coding and is the further development of the EZW algorithm (The embedded zero tree wavelet).
In [5] studied a two-step procedure compression, the first of which is decorrelation of the compressed signal, and the second is traditionally entropy encoding. Table 1 summarizes the results of compression using the various techniques described above.
Analysis of the results and development of ECS compression technologies suggests that one stage compression procedure reached its compression ratio limit. Therefore, further efforts should be focused on search of multi-stage compression.
One of the possible ways is following two-step compression. First look to Table 2, which contains, for example.
A brief sampling of the MIT-BIH basis is presented in Table 2 [6]. Left column lists the values of heart rate range HRR (58...72) beat/minutes. Digits of 100...104 indicate the number of record in MIT-BIH database. The number of occurrences of RR intervals specified in the heart rate during the measurement of the order of 1 minute is indicated on the intersections of HRR and record number.
As clearly seen, the number of identical duration of periods of RR changes greatly. If we assume that the 368 indicates the number of the most often intervals, it is clear that the ECS No. 102 has a much more concentrated form than, e.g. record No.101.
Operation of the device
The sensor (S) converts low electric potential from patient’s skin into ECS by filtering frequency bandwidth of up to 200 Hz and gain factor around 1000 in BFA block.
BFA Output is connected to the ADC – analog-digital Converter – and Fmax block that generates a short pulse when reaching the ECS maximum. The pulse indicates the maximum of QRS complex.
There is a sequence of short pulses with a period equal to the duration of the RR intervals in BFA output. Each RR-interval in the sequence has a unique number corresponding to the ordinal number that is stored in the counter.
ADC starts with the frequency near 1 kHz. Digital codes of samples of the input signal from output of ADC, enter the filter FDBL, which eliminates drift baseline (patent of Russian Federation № 2417050).Estimation of the deviation of the EСS middle line in the area fee of QRS complex, predicts a contour shift within the nearest QRS complex and to compensate the drift with fairly high accuracy.
Table 1
|
Algorithm |
PRD |
CR |
|
Wavelet |
18.2 (RMS) |
21.4 |
|
SPHIT |
6.49 |
20 |
|
JPEG2000 |
3.26 |
20 |
|
The combined algorithm [4] |
1.17 |
18.27 |
Table 2
|
HRR |
Record number from MIT- BIH |
||||
|
100 |
101 |
102 |
103 |
104 |
|
|
58 |
1 |
135 |
0 |
0 |
0 |
|
59 |
3 |
187 |
0 |
1 |
0 |
|
60 |
7 |
230 |
0 |
1 |
0 |
|
61 |
4 |
188 |
0 |
5 |
0 |
|
62 |
4 |
218 |
2 |
10 |
0 |
|
63 |
4 |
133 |
0 |
32 |
0 |
|
64 |
3 |
127 |
3 |
79 |
4 |
|
65 |
0 |
89 |
2 |
143 |
9 |
|
66 |
3 |
70 |
17 |
179 |
8 |
|
67 |
3 |
46 |
8 |
231 |
22 |
|
68 |
5 |
33 |
38 |
213 |
33 |
|
69 |
20 |
40 |
143 |
269 |
79 |
|
70 |
56 |
36 |
219 |
200 |
103 |
|
71 |
137 |
24 |
292 |
199 |
146 |
|
72 |
229 |
28 |
368 |
188 |
298 |
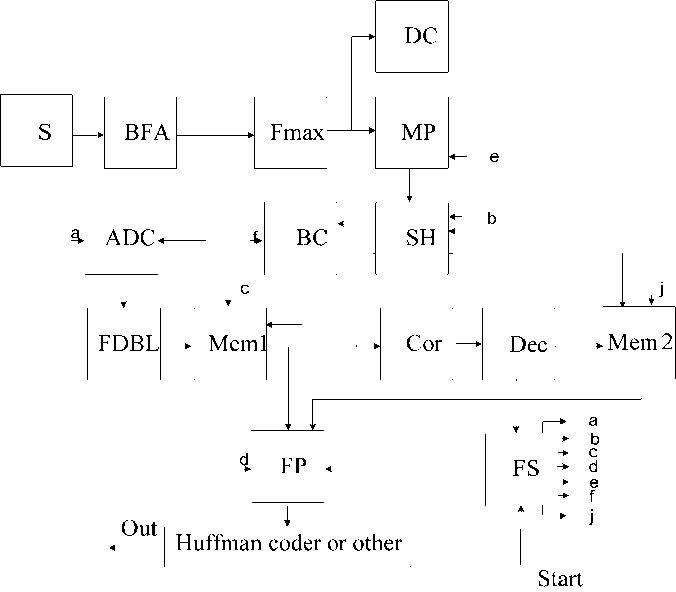
Fig. 1. The Structural scheme of the device for ECS compression by statistical processing
Digital equivalents of all samples ECS obtained in the process of measuring and purified from the drift contour are stored in memory node (Mem1). Frequency synthesizer FS is triggered by a signal Start and generates a sequence of all the control pulses, marked by the letters a...j. The duration of each RR i interval is measured in block MP (Meter period) by counting the number of quantizing pulses along the “e” line.
The SH block produces a histogram in coordinates: quantile of histogram (bin, bunker) and the number of RRi hits in bin. To plot the histogram we need to have the duration of the bin proportional to 1 beat/min. Whole range of possible values of RR-intervals is 50...200 beats/min. At obtaining RR i , not a multiple of an integer, rounding by the usual rules. RRi intervals are accumulated in the bins corresponding to their numbers. Frequency distribution of RR i intervals in the form of a histogram is shown in Fig. 2. Initial data for histogram are taken from the database of the MIT-BIH [6]. As seen from Fig. 2, there is a significant concentration of s RR i interval duration. There is no need to send samples of all RRi intervals, but transmit only a sample. The recovery of the original ECS in the receiver ensures a balance of intervals in accordance with their ordinal number.
However, the same period duration of RR intervals do not mean identical goes inside the interval, so you must mapping RR members within the bin on the criteria of maximum correlation coefficient ε.
For it the control unit BC reads rooms RR intervals from each bin. In accordance with the chosen number interval from a block of memory Mem 1 read audio samples within this interval, and the correlator Cor calculated the correlation coefficient between adjacent intervals.
The exceeding of the predefined threshold ε0 decision on the proximity of the RR-intervals, which allows counts one RR interval and rooms close to this value other RR intervals within the bin.
Fig. 3 shows the dependence of quantity of RR-intervals, close by the criterion threshold ε0 within one bin.
In the block Dec decided on the proximity of RR intervals, relatively to which the correlation
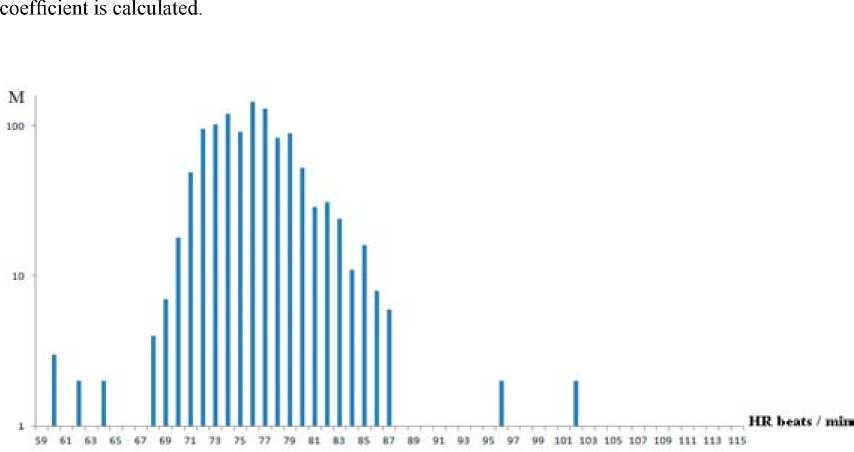
Fig. 2. Frequency distribution of RR intervals, where: M – the number of RR intervals of equal duration; HR – RR interval duration, beats / min.
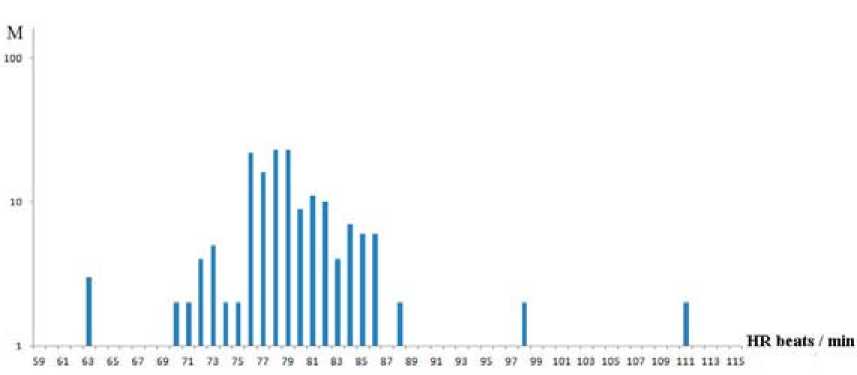
Fig. 3. Number of RR intervals in the aisles of the hopper after comparison with a correlation coefficient ε0 = 0,95, where: M – the number of RR intervals of equal duration; HR – RR interval duration, beats / min.
In the result of the simulation algorithm described above compression on the ECS records from the database of the MIT-BIH [6] was obtained CR=6,269 by a factor of ε 0 = 0,95 and PRD=0.05 and CR=20.746 for factor ε0= 0,90 and PRD=0.1. It should be noted that the efficiency of the considered algorithm depends heavily from statistics of the signal you want to compress.
Conclusion
The reliability of remote medical monitoring systems depends on the success of data transmission, in particular, the compression efficiency of non-stationary signals. For that purpose the most promising is to use of multistage procedures.
Work is performed with financial support of the Ministry of Education and Science of the Russian Federation in the Siberian federal university (Contract No. 02.G25.31.0041).
