Method of monitoring minerals using remote sensing data based on spectral index

Author: Hung Trinh Le, Varvarina E.A.
Journal: Вестник аграрной науки @vestnikogau
Article in issue: 6 (45), 2013.
Free access
The paper presents the results of monitoring iron oxide, clay mineral by using LANDSAT 7 ETM+ image based on spectral index in Musan area (North Korea). The results which are obtained in this study can be used to create distribution clay mineral, iron oxide map, and to serve mineral mining and exploration.
Remote sensing, iron oxide, clay mineral, spectral index
Short address: https://sciup.org/147124131
IDR: 147124131 | UDC: 551.1/.4
Text of the scientific article Method of monitoring minerals using remote sensing data based on spectral index
Mineral resources are one of the most important natural resources of each country. Minerals are the source material for many industries, such as energy production, building materials, metal, for agricultural, industrial...The exploration of mineral deposits discovered is a complex and urgent problem in research and monitoring natural resource. Traditional methods based on field surveys only solve the problem on a small scale due to the high cost. Remote sensing technology with advantages such as wide area coverage and short revisit interval has been used effectively in the study of mining and exploration minerals.
Band rationing is a useful method of preprocessing satellite image, especially in areas where topographic effects are important. Band rationing means dividing the pixels in one band by the corresponding pixels in a second band. The reason for this is twofold: one is that differences between the spectral reflectance curves of surface types can be brought out. The second is that illumination, and consequently radiance, may vary, the ratio between an illuminated and a not illuminated area of the same surface type will be the same.
Today, band rationing method has been widely used in the built spectral index (soil degradation index, leaf area index) for monitoring land cover, minerals, analyzing pollution. This article indicates band ratio method for building Abrams, Kaufmann and Chica – Olma spectral indices for mapping distribution of iron oxide and clay minerals.
STUDY AREA AND METHODOLOGY
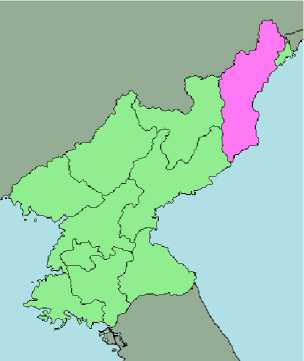
Study area. The Musan iron mine further up the Tumen River at Musan, North Hamgyong province and is known to have the largest iron ore deposits in all of North Korea. The province is bordered by China on the north, South Hamgyong on the southwest, and Ryanggang on the west. On the east is the Sea of Japan (East Sea of Korea). There is also a short border with Russia (fig. 1). Musan has an open-air iron ore mine with a reserve of 5.2 billion tons, the largest in Asia. Musan mine is of a high grade with an iron content of about 60 percent.
Figure 1 - Geographic location of the study area
Methodology. Fig . 2 sh ow s re fle ct a n ce sp e c t ra f o r ir o n o x id e (g o et h i t e an d h e m a t i t e ). T h e v e rt ica l a x is sh ow s t h e p e rcen t a ge of in cid e nt su n lig h t t h a t is re f l e ct e d b y t h e ma t e ri a ls. The horizontal axis shows wavelengths of energy for the visible spectra l re g io n (0 . 4 t o 0. 7 µ m) a n d t h e re f lect e d po rt io n (0 . 7 t o 3. 0 µm) of t h e inf ra re d (I R ) re gio n. Re f le c t e d inf ra re d e n e rgy co n sist s la rge ly of so la r e n ergy re f le c t e d f ro m t h e e a rt h at w a v el e n g th s lo nge r t h a n the sensitivity range of the eye.
Fig. 3 shows re fle ct a n ce sp e ct r a of cla y mi n e r a ls a n d o t h er h y d ro th e rma l a lt e ra t i o n . T h e v e rt ica l a x is sh ow s t h e p e rcen t a ge of in cid e nt su n lig h t t h a t is re f l e ct e d b y t h e ma t e ri a ls. T h e h o ri z o n t al a x is sh o w s wa v ele n gt h s of e n e rgy f or t h e re f le c t e d p o rt i o n (1 . 0 t o 3 . 0 µ m) of the infrared (IR) region.
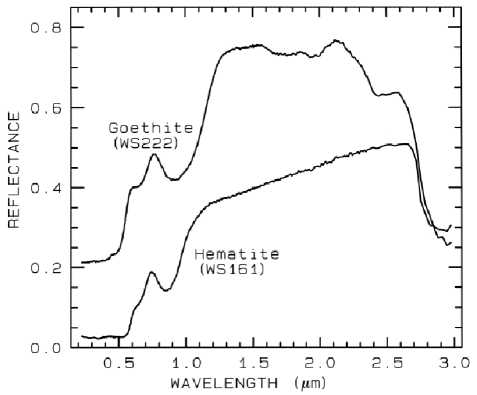
Figure 2 - Spectra characteristic of iron oxide
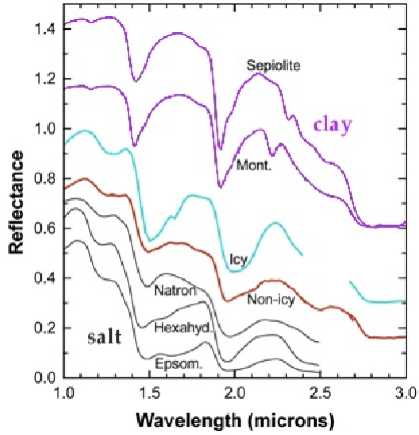
Figure 3 - Spectra characteristic of clay minerals
Th e ba n d ration o p e r a t io n co u ld b e a b le t o t ran s f o rm t h e d a t a w ith o u t re du cin g t h e ef fe c t s of su ch e n v ir o n me n t al co n d it i o n . I n a d d it io n , ra t i o o p e r at i o n ma y a lso p rov id e u n iqu e information that is n o t a va ila b le in a ny sin gle b a nd w h ich is v e ry u se f u l f or d isintegrating the su rf a ce ma t e ria ls. T h e ba n d ra t io s im ages a re kn o w n f o r e n h a n ceme nt of sp e c t ra l co n t ra st s a mo n g t h e b a n d s co nsid e re d in t h e ra t i o o p e ra t i o n a n d h a v e su cce ss f u l ly b e e n u se d in mapping of alteration zone. From the theoretical knowledge of m in e ral’s s p e ct r a l p ro p e rt i e s, it is well recognized that the LANDSAT ET M + b a n d s ra t i o s of 3 / 1 , 5/ 7 , 5/ 4 a re a n a ly z e d f or iron oxides, clay minerals and ferrous minerals respectively.
Table 1 - Algorithms of employed indices
|
No. |
Indices |
Algorithms |
|
1 |
Clay minerals |
Band5/band7 |
|
2 |
Iron oxide |
Band3/band1 o r Ba n d 3/ Ban d2 |
|
3 |
Ferrous minerals |
Band5/band4 |
LANDSAT ETM+ image – detected on 22 September 2006 w e re d o w n loa d e d f re e f o r m the website www.glovis.usgs.gov in TI F F f o r m a t . T h e n , t h e ra d i o me t ric e n h a n ce m e n t w a s a p p lie d o n t h e su b se t mo sa i c im age t o re mo ve ef fe c t s of h a z e u sin g in t e rp re t e r t o o l of E RDA S IM A G INE 9. 2 . Th en , t h i s i ma g e wa s u sed t o cre a t e i n d e x ma p s o f cl a y min e rals, i ro n oxide and ferrous minerals (table 1).
RESULTS AND DISCUSSIONS
To detect and mapping iron oxide, clay and ferrous minerals we used LANDSAT ETM+ satellite image on 22 September 2006 (fig. 4). The Enhanced Thematic Mapper (ETM+) on board LANDSAT-7 is a multi-spectral radiometric sensor that records eight bands of data with varying spectral and spatial resolutions (30m spatial resolution for red, green, blue, near infrared, and two bands of medium infrared; 60m for thermal infrared; and a 15m panchromatic band). With average spatial resolution, thermal infrared image LANDSAT ETM+ performance applications in the region study.
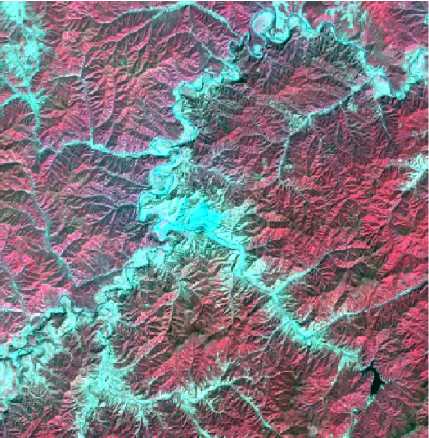
Figure 4 - LANDSAT ETM+ multispectral image in Musan area (22 – 09 – 2006)
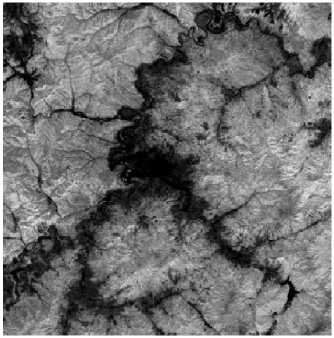
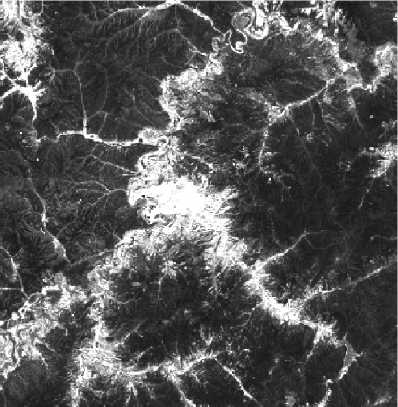
Bands ratios 5/7
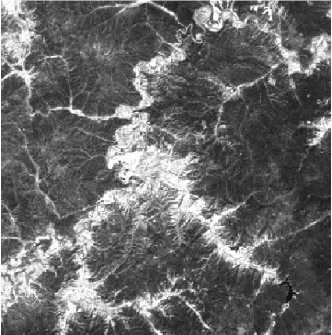
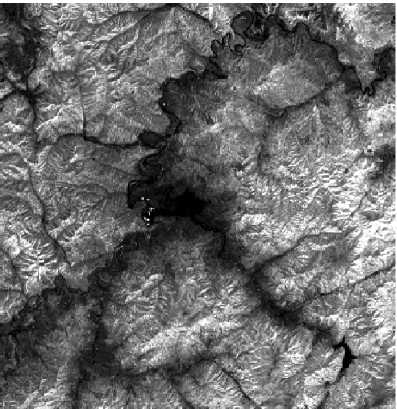
Bands ratios 3/2
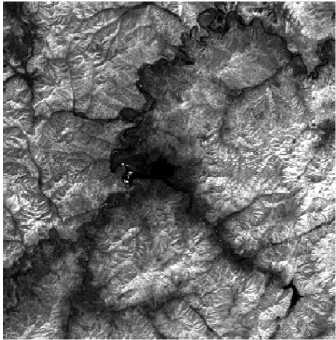
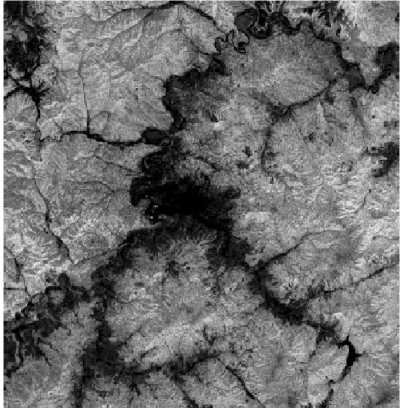
Bands ratio 4/3
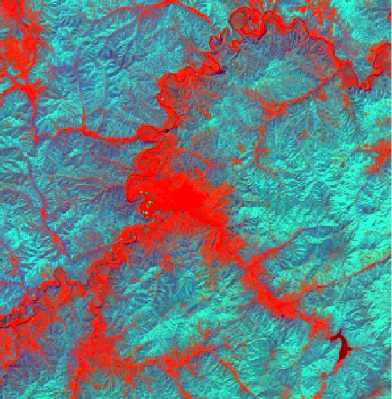
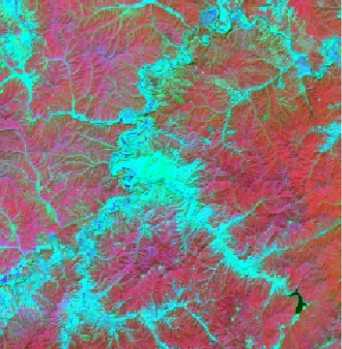
Figure 5 - Bands ratios of 5/7, 3/2, 4/5 and Abrams index images
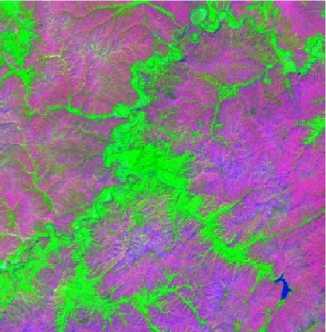
Abrams ratio
A modification of the Abrams ratio was used to highlight spectral contrast, with RGB channels mapped to 3/2, 5/7 and 4/3. The 3/2 ratio enhances iron oxide content, while the 5/7 ratio is small in the presence of abundant iron and large in the presence of abundant clay. The 4/3 ratio highlights vegetation in green. The applied Abrams ratio illustrated the hydrothermal altered iron oxide as green and clay minerals as red color. The ratios images 5/7, 3/2, 4/3 and Abrams image shown in fig. 5 (a – d).
The Kaufmann ratio was used to highlight spectral contrast, with RGB channels mapped to 7/4, 4/3 and 5/7. Minerals containing iron oxide, vegetated zones and hydroxyl minerals show respectively red, green and blue color. The ratios images 7/4, 4/3, 5/7 and Kaufmann image shown in fig. 6 (a – d).
Bands ratio 7/4
Bands ratio 4/3
Bands ratios 5/7
Figure 6 - Bands ratios of 7/4, 4/3, 5/7 and Kaufmann index images
Kaufmann ratio
The Chica - Olma ratio was used to highlight spectral contrast, with RGB channels mapped to 5/7, 5/4 and 3/1. The 3/1 ratio enhances iron oxide content, while the 5/7 ratio is small in the presence of abundant iron and large in the presence of abundant clay. The 5/4 ratio highlights ferrous minerals. Using Chica – Olma ratio we obtain altered clay minerals as red, iron oxide as green and ferrous oxide as blue color. The ratios images 5/7, 5/4, 3/1 and Chica – Olma image shown in fig. 7 (a – d).
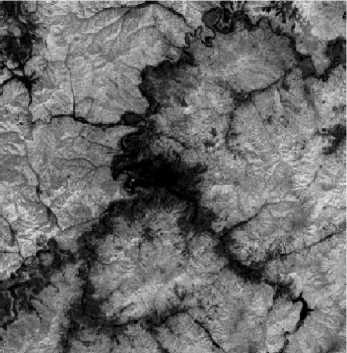
Bands ratio 5/7
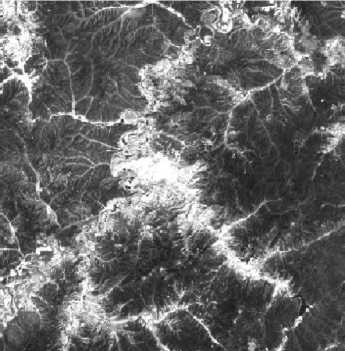
Bands ratios 5/4
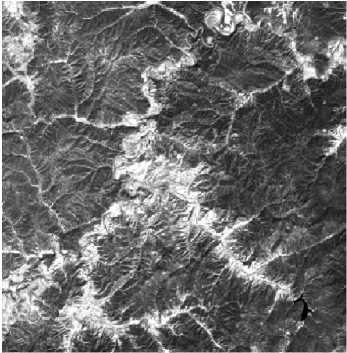
Bands ratios 3/1
Figure 7 - Bands ratios of 5/7, 5/4, 3/1 and Chica – Olma index images
Chica – Olma ratio
CONCLUSIONS
Analysis spectral characteristics of minerals show that, the multispectral image LANDSAT with medium resolution 30m can be used effectively for detecting and predicting the density distribution of iron oxide and clay minerals. The results which are obtained in this study can be used to create distribution clay mineral, ferrous mineral, iron oxide map, and to serve mineral mining and exploration.
References Method of monitoring minerals using remote sensing data based on spectral index
- Hankan Mete Dogan. Mineral composite assessment of Kelkit River Basin in Turkey by means of remote sensing (2012), Journal Earth System Science 118, No. 6, pp. 701 -710
- Md. Bodruddoza Mia, Yasuhiro Fujimitsu. Mapping hydrothermal altered mineral deposits using LANDSAT 7 ETM+ image in and around Kuju volcano, Kyushu, Japan (2012), Journal Earth System Science 121, No. 4, pp. 1049 -1057
- David M. Sherman. Electronic spectra of Fe3+ oxides and oxide hydroxides in the near IR to near UV (1995), American Mineralogist, Vol. 70, pp. 1262 -1269
- Estimation of soil properties by orbital and laboratory reflectance means and its relation with soil classification (2009), The open Remote sensing journal, Vol. 2, pp. 12 -23
- Amro F. Alasta. Using remote sensing data to indentify iron deposits in central western Libya (2011), International conference on Emerging trends in Computer and Image processing, Bangkok, pp. 56 -61
