Methodology for constructing a software-hardware system for localizing acoustic signals

Author: Shahoud G., Agafonov E.D.
Journal: Siberian Aerospace Journal @vestnik-sibsau-en
Section: Informatics, computer technology and management
Article in issue: 4 vol.26, 2025.
Free access
This article proposes a methodology for constructing a software-hardware system for solving the problem of sound source localization in real acoustic environments based on the synthesis of several models, including intelligent ones. To achieve this goal, a methodology is proposed that includes the selection of technologies and equipment for collecting and processing acoustic signals, training models on experimental data, and conducting an additional series of experiments to evaluate the effectiveness of the models. Two models were considered: SI-GCC-CNN (Sound Intensity – Generalized Cross-Correlation Convolutional Neural Network), which combines sound intensity features and a generalized cross-correlation phase transform as input to convolutional neural networks, and SI-CNN (Sound Intensity – Convolutional Neural Network), which feeds sound intensity features into a convolutional neural network. To evaluate the effectiveness of the deep learning models used to solve this problem at a spatial resolution of 10º, a series of experiments were conducted in closed reverberant rooms. The generalization ability of these models was assessed by varying configuration settings. The experimental results demonstrated the effectiveness and generalization ability of the SI-GCC-CNN model when working in real-world acoustic environments. The SI-GCC-CNN model outperformed the SI-CNN model, achieving a 2.9x improvement in localization accuracy when changing the room size, 2.5x when changing the distance between the source and the center of the microphone array, and 2x when changing the location of the microphone array.
Software-hardware system, sound source localization, real-world acoustic environments, sound intensity, deep learning, reverberant rooms, generalization ability
Short address: https://sciup.org/148333137
IDR: 148333137 | UDC: 004.032.26, 004.048 | DOI: 10.31772/2712-8970-2025-26-4-507-516
Text of the scientific article Methodology for constructing a software-hardware system for localizing acoustic signals
The task of sound source localization (SSL) involves determining the direction from which acoustic waves originating from a sound source are received. This is typically accomplished using a microphone array that captures acoustic signals. The spatial-temporal information obtained from the array is then analyzed to determine the direction of the acoustic source.
SSL plays a crucial role in various engineering and technology applications, including public address systems [1], automatic camera tracking for teleconferencing [2], human-robot interaction [3], and remote speech recognition [4]. In most practical situations, the direction of the acoustic source is unknown and requires estimation. This task becomes even more challenging when it must be solved in real-world acoustic environments characterized by noise and reverberation.
Currently, acoustic source localization is addressed by two groups of methods: traditional signal processing methods and deep learning (DL) methods. Traditional methods, including Multiple Signal Classification (MUSIC) [5], Time Difference of Arrival (TDOA) [6], Delay-And-Sum beamformer (DAS) [7], Generalized Cross-Correlation – Phase Transform (GCC) [8], and Steered Response Power – Phase Transform (SRP) [9], were developed within the free-field sound propagation paradigm and therefore suffer from severe performance degradation when applied in closed acoustic environments with complex characteristics, i.e., in reverberant and noise scenarios [10].
Deep learning methods can outperform traditional methods in their robustness to noise and reverberation by effectively adapting to a variety of complex acoustic conditions provided as features in the training data [11]. However, this is also a major drawback of intelligent methods, as they are less capable of generalizing and less versatile than traditional methods [10].
In [12], a new SI-GCC-CNN model was proposed for single-source localization with a spatial resolution of 10º. The SI-GCC-CNN model is based on combining Sound Intensity (SI) and GCC-PHAT features as input data to a Convolutional Neural Network (CNN). The model achieved 100% prediction (localization) accuracy in closed reverberant environments, outperforming the SI-CNN model [13], which is based on using SI features as input data to a CNN.
In [12], both the SI-GCC-CNN and SI-CNN models were trained on synthetic data and then their performance was tested, unlike [14], where the proposed model was trained on real experimental data and thus there was no need to repeat the experiments, which require intensive efforts to collect a large amount of data for model training. In [15], it was demonstrated that the developed SI-GCC-CNN model is capable of generalizing to changing configuration settings, namely, room size, the distance between the source and the center of the microphone array, and the location of the microphone array. This, in turn, requires testing its ability to handle in consistencies and differences between simulated and real-world conditions through a series of real-world experiments.
In fact, in [12; 15], microphone signals were generated using a linear description of the sound propagation model in the environment, and then localization models were built and trained using input data represented by features extracted from the microphone signals. This means that the training process was not performed on real data representing operating conditions in real-world environments. Therefore, testing the robustness and ability of localization models to handle real-world data through a series of experiments in real-world room conditions is relevant.
The results of this series of experiments will allow evaluating the flexibility of the developed models and their potential for practical application in many areas of engineering and technology without restrictions on configuration settings.
The aim of the work is to build a hardware and software system for conducting real experiments and evaluating the effectiveness of SI-GCC-CNN and SI-CNN models in rooms of different sizes and with different configuration settings.
Structural diagram of the experimental setup and selection of technologies and equipment for collecting and analyzing acoustic data
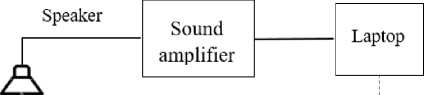
Figure 1 shows the structural diagram of the experimental setup. Ananalog-to-digital converter (ADC), represented by a BEHRINGER UMC204HD external soundcard with a conversion rate of 44,100 samples per second and a 24-bit resolution, is used to convert the input analog signal (microphone signal) in to its discrete numerical representation. A USB (Universal Serial Bus) type B interface is required to connect the computer to the BEHRINGER UMC204HD device and subsequently to collect and process data. Professional BM-800 JBH microphones with XLR cables are used to connect to the soundcard inputs.
A ground filter, connected to the ADC device’s housing via a ground contact, is also used to eliminate electrical interference.
The experimental setup included a 20 cm microphone array consisting of four orthogonal microphones (Fig. 2), similar to the one used in the simulation to generate the initial data and train the models [12]. The microphone array was positioned 1.5 m above the floor.
Synchronization in Matlab
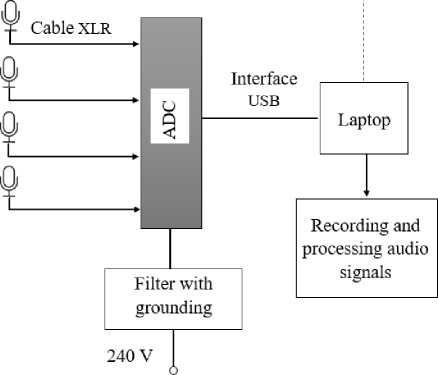
Рис. 1. Структурная схема экспериментальной установки
-
Fig. 1. Structural diagram of the experimental setup
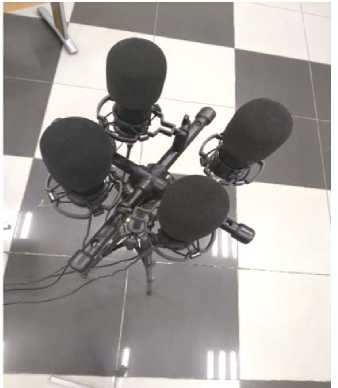
Рис. 2. Микрофонная решетка
-
Fig. 2. Microphone array
A loudspeaker (speaker) was positioned at known directions in the horizontal plane of the array at a height of 1.5 m (Fig. 3). This loudspeaker, in turn, emits audio signals taken from the TIMIT database [16] with a sampling frequency of 16 kHz and duration of 500 ms. The microphones receive audio signals, which are recorded using the MATLAB software environment. Recorded audio signals are resampled from 44,100 Hzto 16 kHz to match the original model data and filtered using a high-pass filter (LPF), which passes signals above a specified cutoff frequency and attenuates signals below it. Selecting a cutoff frequency of 100 Hz ensures the suppression of background noise at 50 Hz.
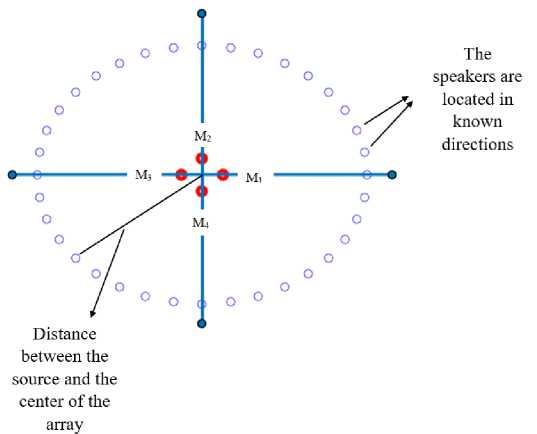
Рис. 3. Схема расположения громкоговорителей
-
Fig. 3. Speaker layout diagram
It was shown in [13] that the array size has a similar effect on all localization methods used, including the one proposed in [13], which relies on acoustic intensity information as input. Localization performance deteriorates when the array size is too small or too large. One reason for this deterioration is that the acoustic intensity features are based on the finite difference of acoustic pressure signals to approximate particle velocity using an orthogonal microphone array, as shown in [12]. As a result, as the array size increases, the approximation error will increase correspondingly, leading to inaccurate acoustic intensity estimates. On the other hand, if the array size is too small, the microphone array will exhibit poor noise sensitivity, especially at low frequencies [17]. It is also shown in [13] that the optimal range of lattice sizes for the proposed method is 2–5.5 cm, while the performance of the GCC-PHAT-CNN method, which uses GCC-PHAT features as input, was significantly worse than its analogs for small lattice sizes and better than its analogs for relatively large lattice sizes, i.e., 40 cm.
Thus, to achieve consistency in the lattice sizes used in the proposed method and obtain good localization results, a 20 cm lattice was used in both simulations and experiments.
Training Models on Experimental Data
Under specific configuration settings, both SI-GCC-CNN and SI-CNN models, previously trained on synthetic data [12], are retrained on real experimental data. Both models are considered for singlesource localization with a spatial resolution of 10º.
The experimental raw data collection process takes place in a room measuring 5.7 x 8.7 x 3.2 m³, where the center of the microphone array is located in the center of the room at coordinates [2.85, 4.35, and 1.5] m, and the sound sources are located at a distance of 2 m from the center of the array.
For each of the 36 directions, 10 audio files are randomly selected from the TIMIT database training set for playback through a loudspeaker, the acoustic signals are received by the microphone array, and recorded. The recorded signals constitute the raw data from which features are extracted and models are trained.
The data preparation and feature extraction process, as well as training setup and model hyperparameters, are the same as for training on synthetic data in [12].
Data preprocessing, including data preparation and feature extraction, was performed in MATLAB R2020a. Deep learning models were then built using Python 3.* in Google Colab. This hybrid approach leveraged MATLAB’s extensive signal processing capabilities for subsequent feature engineering and Python’s extensive deep learning ecosystem for model building.
Design and Conduct of a Series of Experiments
To evaluate the performance of the models and their ability to generalize under conditions different from those in which they were trained, a series of experiments were conducted. Table 1 shows the configuration settings for each experiment.
Настройки конфигурации для экспериментов
Table 1
|
Experiment No. |
Room Size [m3] |
Microphone Array Center Coordinates [m, m, m] |
Distance between Source and Microphone Array Center [m] |
|
1 |
5.7×8,7×3.2 |
[2.85, 4.35, 1.5] |
2 |
|
2 |
9×7×3.2 |
[4.2, 3.5, 1.5] |
2 |
|
3 |
9×7×3.2 |
[4.2, 3.5, 1.5] |
3 |
|
4 |
9×7×3.2 |
[2.6, 4.7, 1.5] |
2 |
For each experiment, 36 directions are considered, uniformly distributed in the range of –180º to 180º with a step of 10º.
For each configuration setting corresponding to each experiment, 108 audio files are selected from the TIMIT test set such that each of the 36 directions corresponds to three audio files, which are played through a loudspeaker. Acoustic signals corresponding to each known direction are then recorded. Features are extracted from the raw data and fed to trained models, which, in turn, estimate the directions of the acoustic sources.
To evaluate the performance of the models, the localization accuracy (PA) metric is used [18].
Table 2 shows the average PA values for the SI-CNN and SI-GCC-CNN models across the experiments.
In Experiment 1, the performance of the models was tested in the same room in which the models were trained, maintaining the same configuration settings. In the remaining experiments, the configuration settings were changed and previously trained models were retested to assess their generalization ability.
Table 2
Average localization accuracy metric values for the SI-CNN and SI-GCC-CNN models across a series of experiments
|
Experiment No. |
SI-CNN (%) |
SI-GCC-CNN (%) |
|
1 |
70.37 |
94.44 |
|
2 |
29.6 |
86.1 |
|
3 |
32.4 |
80.6 |
|
4 |
41.7 |
83.3 |
In Experiment No.1, the proposed model achieved a localization accuracy of 94.44%, outperforming the SI-CNN model by 34.2 %.
The remaining experiments tested the generalization ability of the models when changing configuration settings.
When changing the room size (Experiment No.2), the SI-GCC-CNN model demonstrated its generalization ability, achieving a localization accuracy of 86.1 %, outperforming the SI-CNN model by a factor of 2.9. The SI-CNN model failed to achieve a localization accuracy of 29.6 %.
In Experiment No.3, the same room size and microphone array configuration settings were maintained as in Experiment No.2, but the distance between the source and the center of the microphone array was changed to 3 m. The SI-GCC-CNN model demonstrated its generalization ability, achieving a localization accuracy of 80.6 %, while the SI-CNN model failed to achieve a localization accuracy of 32.4 %. The SI-GCC-CNN model outperformed the SI-CNN model, achieving a 2.5 times improvement in localization accuracy.
In Experiment No.4, the same room size configuration and distance between the source and the center of the microphone array were maintained as in Experiment No.2, but the coordinates of the center of the microphone array were modified. The SI-GCC-CNN model demonstrated its generalization ability, achieving a localization accuracy of 83.3 %, while the SI-CNN model did not achieve satisfactory localization accuracy, achieving 41.7 %. The SI-GCC-CNN model outperformed the SI-CNN model, achieving a 2 times improvement in localization accuracy.
Conclusion
This paper proposes a methodology for constructing a hardware-software system for evaluating the performance of acoustic source localization models with a spatial resolution of 10º in real acoustic environments. A series of experiments was conducted in which both the SI-GCC-CNN and SI-CNN models were first trained on real experimental data in a specific room and then their generalization ability was assessed when changing configuration settings.
The experimental results confirm the reliability and effectiveness of the SI-GCC-CNN model for real acoustic environments, which is consistent with the simulation results obtained in [15]. Thus, the performance of the SI-CNN model deteriorated compared to its performance when applied to synthetic data, while the SI-GCC-CNN model retained virtually all of its performance when applied to both synthetic and experimental data. This can be explained by the fact that when training and testing both models on synthetic data, a linear sound propagation model was assumed, as echo information was included in the training and test data without regard for noise. However, when training and testing both models on real data, not only echo information but also noise information was included in the training data, as the proposed model demonstrated effective noise robustness compared to the SI-CNN model.
It should also be noted that the volume of synthetic data on which the models were trained exceeds the volume of real data, as 6000 audio files were used as raw synthetic data, compared to 360 audio files used as raw real data.
Further research involves conducting a series of experiments to evaluate the effectiveness of the SI-GCC-CNN model used in [18] with the acoustic source separation method for simultaneously localizing two overlapping sound sources in a real acoustic environment.
