Methodology for determining the spatial potential of agglomeration effects: the case of the Saint Petersburg agglomeration

Author: Olifir D.I.
Journal: Economic and Social Changes: Facts, Trends, Forecast @volnc-esc-en
Section: Regional economy
Article in issue: 2 т.17, 2024.
Free access
Modern methodological approaches and techniques for studying agglomeration effects are aimed at determining and evaluating the spatial potentials of development and interaction of territories of various hierarchical levels. But the possibilities of modern software that allows detecting intraagglomeration spatial reserves - spatial potentials - on cartographic models are not taken into account. The work uses spatial-functional and synergetic (agglomeration) approaches, as well as potential method, statistical method and cartographic modeling. We reveal the theoretical basis for the formation of spatial potentials in the intra-agglomeration environment and propose a methodological approach to their determination based on agglomeration effects of demographic, settlement and economic structures of the Saint Petersburg agglomeration. According to the calculations obtained, we design cartographic models that correspond to the structures under consideration and reflect spatial potentials of agglomeration effects, which are represented by groups of five clusters. The levels of clusters of spatial potentials and their configurations are obtained with the help of the neural network software “Surfer Golden Software”. We find that groups of clusters within the demographic and settlement potentials structure - gravitational, high-potential, medium-potential and low-potential - have smaller territorial impact areas in contrast to similar groups of clusters of economic structure. At the same time, a very low-potential cluster of demographic and settlement structure significantly exceeds the area of the similar cluster of economic structure and spreads beyond the cities located in the eastern and southeastern parts of the Saint Petersburg agglomeration periphery. The areas for future research are related to the development of new methodological approaches and techniques aimed at searching for and modeling agglomeration effects and their spatial potentials in the functional structures of individual cities, urban agglomerations or regions (investment, innovation, environmental, transport, service, cultural and other structures). Another promising area consists in determining spatial potentials based on the agglomeration effects of individual large enterprises with the help of quantitative indicators reflecting their performance effectiveness; this direction is difficult to implement due to the lack of open statistical data.
Urban agglomeration, saint petersburg agglomeration, intra-agglomeration environment, agglomeration effect, potential, demographic and settlement structure, economic structure, cluster
Short address: https://sciup.org/147243849
IDR: 147243849 | UDC: 332.12 | DOI: 10.15838/esc.2024.2.92.6
Text of the scientific article Methodology for determining the spatial potential of agglomeration effects: the case of the Saint Petersburg agglomeration
Representatives of regional economic science show a keen interest in the spatial aspect of the development of cities, urban agglomerations and regions. At the same time, particular urban agglomerations, having unique spatial properties of concentration, localization, polyfunctionality, competitiveness, innovativeness, communication, socio-business activity, multi-vector and dynamic development, form agglomeration effects that have a positive impact on the surrounding territories. Agglomeration effects are the fundamental basis for determining the spatial development potentials of territories based on the interrelations and interactions of the objects under consideration belonging to certain functional structures. Such studies are conducted at various territorial and hierarchical levels – from industrial agglomerations formed within individual cities or urban agglomerations to groups of neighboring regions.
Depending on the scale of the territorial-hierarchical level, agglomeration effects are divided into two types: localization and urbanization effects. The first type, as its name suggests, is based on localization of enterprises belonging to the same or interrelated (interdependent) type of economic activity (industry) in separate centers of space. Consequently, it is characterized by the level of separate cities, urban and industrial agglomerations. The second type, being a consequence of the first, is manifested due to the concentration of population and diversity of activities (specializations) primarily in urban agglomerations. In this case, urban agglomerations serve as sources of agglomeration effects at the interregional level, and their cores – at the regional level (within a particular region).
The relevance of the research problems lies in the fact that the largest urban agglomerations of monocentric type have reached a critical point of core polarization – concentration of population and economic activities, contributing to further “intensification of asymmetry of intraagglomeration spatial structure” (Makarova, 2021). They require transition to a polycentric model of spatial intra-agglomeration development based on the identification of potential opportunities for peripheral territories to maximize the benefits of the agglomeration effect. This fact determines the need to develop a new methodological approach aimed at finding competitive opportunities and reserves of intra-agglomeration space that can be used in the practice of spatial and socioeconomic development of urban agglomeration. Modern neural network capabilities of specialized computer software help to reveal spatial properties through the construction of cartographic models based on numerical values of certain indicators and taking into account their nonlinearity during data processing on the basis of common properties, which, unlike mechanical methods, is the most accurate and efficient.
The choice of the Saint Petersburg agglomeration as a territorial basis is conditioned by the fact that it is the second largest (after Moscow) agglomeration in Russia, in which, as the author’s studies (Olifir, 2022; Olifir, 2023; Mezhevich, Olifir, 2023) have shown, the monocentric type is most pronounced. In this regard, the proposed methodological approach and its tools can be used in urban agglomerations of a similar type. The spatial structure of the Saint Petersburg agglomeration is represented by the core – Saint Petersburg within the boundaries of the RF constituent entities and the periphery – the districts of the Leningrad Region, the administrative centers of which are located at a distance within two hours of accessibility along the lines of highways from the central point of the core (Palace Square).
The research hypothesis is that the determined spatial potentials of agglomeration effects in the demographic, settlement and economic structures of the Saint Petersburg agglomeration will reveal the reserves of the studied intra-agglomeration space, which can be effectively used in the process of optimization and reduction of disparities between the core and periphery.
The aim of the paper is to develop theoretical foundations and methodological approaches aimed at determining spatial potentials on the basis of the existing organization and level of development of agglomeration effects of demographic, population and economic structures in the intra-agglomeration environment of the largest urban agglomeration of Russia – Saint Petersburg.
The research objectives are:
– to propose a methodological approach to determining spatial potentials on the basis of agglomeration effects of demographic, population and economic structures of urban agglomeration;
– to formulate a theoretical basis for the formation of spatial potentials in the intraagglomeration environment;
– to build cartographic models reflecting spatial potentials of agglomeration effects of demographic, settlement and economic structures of the Saint Petersburg agglomeration and analyze the results obtained.
Literature review
In the framework of foreign research, R. Cellmer conducted a spatial mapping assessment of market potential in the Polish cities of Lodz, Poznan and Wroclaw based on population density and retail store density indicators (Cellmer, 2023). Y. Yang, F. Kaset and B. Derudder, in their analysis of regional economic and urban development strategies in China, concluded that cities, by borrowing dimensions from large urban agglomerations, contribute to regional economic growth (Yang et al., 2023). L. Chen et al. analyzed the impact of population density on economic growth in the urban agglomeration of the Guanzhong Plain (China) and determined that population density can significantly and sustainably contribute to the economic growth of peripheral areas and counties of the agglomeration. At the same time, population congestion near railway stations has a stronger impact on economic growth (Chen et al., 2023). The study by S. Zhang et al. shows how spatial and functional separation in urban agglomerations in China has a strong mitigating effect on negative externalities (Zhang et al., 2023). L. Lima et al. found correlations between the spatial configuration of a city and the location of stores in it, using 35 US cities as an example. The result proves that cities with higher values of contact weight (the number of shortest paths, weighted by the density of residents, in the network loaded with retail trade), demonstrate a greater volume of retail sales within smaller radii (up to 1,000 meters) (Lima et al., 2023).
One of the most common methods of econometrics, used both in Russian and foreign regional (spatial) economic studies, is the method of Moran’s spatial autocorrelation. It is calculated using the global and/or local Moran’s index, which helps to determine the disparities, links and mutual influences between the studied territorial entities of different administrative hierarchies. For instance, I.V. Naumov determined the directions of investment potential formation in Russian regions and identified four interrelated regional clusters (Naumov, 2019). A.V. Rybkin and V.L. Baburin present an assessment of the potential of agglomeration processes in the Irkutsk agglomeration. Considering agglomeration processes through the prerequisites for the emergence of agglomeration effects (localization and urbanization effects), the researchers estimate their parameters to determine the territorial clusters of the agglomeration in question (localization effect) through the Moran index and to identify the diversity of economic activities (urbanization effect) – through the Shannon index (Rybkin, Baburin, 2019). Yu.G. Lavrikova and A.V. Suvorova assessed the relationship between the development indicators “number of permanent population” and “shipped goods of own production, works and services performed by own forces” of neighboring (closely located) territories within the boundaries of four constituent entities of the
Russian Federation: the Chelyabinsk Region, the Krasnodar Territory, the Republic of Tatarstan and the Kemerovo Region (Lavrikova, Suvorova, 2020). M.N. Makarova identified the key points of attraction in the settlement system of municipalities of the Sverdlovsk Region, as well as direct and reverse spatial interrelations between them (Makarova, 2021). The article of A.V. Suvorova presents the assessment of interrelations between separate constituent entities of the Russian Federation. It reveals a direct relationship between the values of the population indicator in the RF regions located close to each other: “The change in the value of the considered indicator in the transition from region to region occurs gradually” (Suvorova, 2019).
In foreign publications, geographical clusters of high and low mortality rates were obtained using Moran’s spatial autocorrelation method by J. Spijker et al. based on the data of standardized mortality rates in Colombia (Spijker et al., 2021). Spatial patterns in US states related to the state of the gender wage gap in construction occupations are presented by S.N. Manesh et al. (Manesh et al., 2020). Spatial clusters of divorce rates in Oman are identified in a study by Sh. Mansour, E.F. Saleh and T. Al-Awadi (Mansour et al., 2020). R. Encarnacion, D. Magnay and A.J. Castro, looking at the competitiveness of large metropolitan areas in the Philippines, identified a pattern of clustering of cities and municipalities with “complementarity” rather than competition between them (Encarnacion et al., 2023).
The literature review reveals a large number of methodological approaches and research techniques aimed at identifying and assessing spatial development and interaction potentials, including those based on agglomeration effects. The results of existing studies are represented, on the one hand, by mathematical models with estimation calculations between the dependent variable indicators; on the other hand, by groups of geographical clusters, identified according to the results of calculations with regard to administrative-territorial boundaries. At the same time, the research field lacks works devoted to the search (discovery) of intraagglomeration spatial reserves (potentials), which can be positively used primarily in the peripheral territories of the largest urban agglomerations of monocentric type.
Research methods
The paper uses spatial-functional and synergetic (agglomeration) approaches to the study. The first approach takes into account the spatial intraagglomeration organization of structures, including the shortest distances along the lines of road transport communications between all cities of the agglomeration for the demographic and settlement structure and between the administrative centers of the agglomeration for the economic structure. The second approach is aimed at determining the effect of return on the surrounding space due to the concentration of population in separate centers (cities) of agglomeration – demographic and settlement structure and the results of economic activity confined to the administrative centers of agglomeration – economic structure.
The presented study uses the following specialized scientific methods: method of potentials, statistical and cartographic modeling.
The method of potentials helps to determine the areal of spatial potential of agglomeration effects depending on the location of cities and distances in relation to other cities included in the agglomeration. It is borrowed from the physical laws of gravity by I. Newton and the interaction of point electric charges by S. Coulomb. The founder of its application in regional (spatial) economic research is considered to be astrophysicist J.Q. Stewart, who in 1941 proposed the law of spatial interaction between the population of two regions, the “demographic force” of attraction of which is expressed, by analogy with the gravitational constant, by the constant value of migration flow (k)
multiplied by the product of the population of the cities under study (N1 N2) inversely proportional to the square of the distance between them (d2) (Stewart, 1941). The formula of demographic potential of J.Q. Stewart has a limitation in practical application due to the constant value of migration flow between the cities under consideration (k), which can be determined with significant estimation errors. Therefore, this formula was further modified, for example, in the works of Soviet economic geographers Yu.V. Medvedkov (Medvedkov, 1965) and O.A. Evteev (Evteev, 1969), in which the gravitational constant was absent. Subsequent modifications of the potential formula led to the determination of the demographic potential of the city in question, based on the indicator of the population in it, summarized by the ratio of the sums of the population of all cities included in the study and the distances between them (Huseyn-Zadeh et al., 1988):
l = n
Dpi=pi+i d/ ■ l=1
where Dр i – demographic potential of the i-th city; P i – population in the i -th city, for which the potential is determined; P j – population in other studied j -cities; D ij – the shortest distance along the road lines from the i -th city, for which the potential is determined, to the other j -cities under consideration; n – total number of cities under consideration.
The statistical method includes the method of the composite index , which is the total arithmetic mean of private values of absolute indicators, the use of which allows determining the average effect (level) of development of economic structures in the administrative units of urban agglomeration. In this study, the development rate of economic structures will be determined using the composite economic development index (EDI) , which we proposed and tested in a previous study (Olifir, 2023):
VIP + PO + RT + VPS + VIC
EDI = 5 , (2)
where VIP – volume of shipped industrial products, million rubles; PO – profit of organizations (enterprises), million rubles; RT – retail trade turnover per capita, million rubles; VPS – volume of paid services per capita, million rubles; VIC – volume of investments in fixed capital by organizations, million rubles.
The economic development index is based on the absolute values of indicators of three spheres of economic activity: production (volume of shipped industrial products per capita; profit of organizations); consumer market (retail trade turnover per capita; volume of paid services per capita) and investments (volume of investments in fixed capital by organizations per capita).
To determine the spatial potential based on the agglomeration effect of economic structure, the obtained results of the economic development index calculations are carried out through the potential formula, which will be presented in the following form:
i=n
Z EDI/
, (3)
Dl]
i=i where Epi – economic potential of the i-th administrative center; EDIi – economic development index in the i-th administrative center for which the potential is determined; EDIj – economic development index in other studied j-administrative centers; Dij – the shortest distance along the road lines from the i-th administrative center, for which the potential is determined, to other j-administrative centers under consideration; n – total number of surveyed administrative centers.
Unlike the demographic potential, which is calculated on the basis of the population in the cities included in the Saint Petersburg agglomeration, the calculation of the underlying economic potential of the composite economic development index is carried out for Saint Petersburg (core) and municipal districts of the periphery (Leningrad Region), which is due to the lack of statistical data on the indicators that form its basis by city.
The statistical base of absolute indicators underlying the definition of potentials was formed by the data of the Department of the Federal State Statistics Service for Saint Petersburg and the Leningrad Region (Petrostat) and the Committee for Economic Development and Investment Activity of the Leningrad Region (the latter for the calculation of the economic development index in the municipal districts of the periphery).
The method of cartographic modeling is a means of information and a tool for cognition of reality, which allows displaying (visualizing) the properties of spatial regularities of intra-agglomeration development on the cartographic plane on the basis of quantitative values of indicators of the structures in question and their spatial reference to geographical coordinates. Modern computer software, based on neural networks, most accurately and efficiently builds cartographic models. Such software includes “Surfer Golden Software”, which contains neural network interpolation functions that allow obtaining cartographic models of high quality and accuracy based on spatial numerical data. It will be used to carry out cartographic modeling of the results obtained by calculating the potentials of demographic, settlement and economic structures, and to build corresponding cartograms showing clusters of spatial potentials of different levels and configurational forms in the Saint Petersburg agglomeration. The construction of cartographic models is carried out in the following way: the level of development of agglomeration effect of the functional structure under consideration, determined by the value of the indicator Z, is tied to the geographical coordinates X and Y, i.e. non-spatial data are translated into spatial data. The Z value in the demographic and settlement structure is linked to the coordinates of agglomeration cities, while the Z value in the economic structure is linked to the coordinates of agglomeration administrative centers. Further transformative process of the software used interprets the obtained result within a closed system – the outer boundary of the urban agglomeration with the allocation of clusters of different levels and configurations.
Research results
In regional economic science, the classical “center – periphery” model appeared in 1966, when its author J. Friedmann published a paper entitled “Regional Development Policy: A Case Study of Venezuela” (Friedmann, 1966). The key point of his theory is that the differentiation of agglomeration space is generated by the concentration of population and types of economic activities (economic entities) in the central large city (core) and decreases from it in the periphery as the distance increases. At the same time, a close relationship is formed between the center (core) and the periphery. The presented position served as a fundamental basis for the author’s theoretical substantiation of the genesis of spatial potentials within a single urban agglomeration (intra-agglomeration environment) .
We should note that the core and periphery form two intra-agglomeration gravitational forces – centrifugal (“nuclear”) and centripetal (“peripheral”). The agglomeration core acts as an agglomeration (synergetic) source and “reactor” of intraagglomeration development and is characterized by limited land resources, relatively high cost of land rent, saturation (concentration) of residential and infrastructure facilities of various functional purposes (business, social, commercial, cultural, industrial, etc.), dense and congested network of motor transport communications, high environmental load. The size, properties and level of spatial and socio-economic development of the agglomeration core contribute to its constant impact on the peripheral territories, i.e. the manifestation of the centrifugal gravitational force. At the same time, the centrifugal force (gravity) has a direct dependence on the distance and development of the transport and communication network, decreasing in the direction from the core to the far periphery. The centripetal gravitational force is a consequence of the secondary manifestation of the centrifugal force and is characterized by the opposite vector of direction – from the peripheral areas to the agglomeration core. As a result, in the intraagglomeration space we observe the simultaneous action of centrifugal and centripetal gravitational forces. Their combined action contributes to the manifestation of spatial potential1.
In theoretical and methodological terms, spatial potential should be understood as the hidden opportunities (reserves) of intra-agglomeration space, the effectiveness of which can be manifested due to the established centers of concentration of certain functional structures that act as sources of agglomeration effect. The presented formulation shows that the source of spatial potential is agglomeration effects, which are considered by scientists, as a rule, from the position of the impact of the core on the peripheral territories, if they are agglomerations of monocentric type (Suvorova, 2019; Kolomak, Sherubneva, 2023), due to the above characteristics. Under certain conditions of organization of the intra-agglomeration space, the agglomeration effect can also be formed by separate local peripheral centers located at a relatively large distance from the core, i.e. in areas where the agglomeration effect of the core loses or begins to lose its influence. In addition, provided that two local peripheral centers are located at relatively small distances from each other, which are poorly affected by the agglomeration effect of the core, the agglomeration effect will form a larger local peripheral center (city). In other words, agglomeration effect is formed (formed) by agglomeration cities with higher population size. In particular, the larger the agglomeration core, the stronger its agglomeration effect and the higher the spatial potential of its impact on the surrounding peripheral areas. For example, city A forms the agglomeration core due to the high concentration of population and economic activities, which exceeds the similar values of peripheral cities B, C, D, E, etc. Although peripheral cities B, C, D, E can form their own sources of agglomeration effect and exert spatial potential impact, they will be “absorbed” by the agglomeration effect of the spatial potential coming from the agglomeration core. If, for example, we take a multi-core agglomeration consisting of two cores, or ignore the agglomeration effect of the core in a monocentric agglomeration, then in the first case we obtain, and in the second case we set the conditions according to which the cities of the agglomeration in question will be characterized by approximately the same level of development (agglomeration effect). In this case, spatial potentials coming from two and/or more sources of agglomeration effects (agglomeration cities) interact with each other and spread their influence on the surrounding space in the form of a homogeneous spatial potential. Thus, in the intra-agglomeration space, the size of cities has a key influence on the manifestation of the spatial potential of agglomeration effect, which is confirmed by the results of the studies (Olifir, 2022; Mezhevich, Olifir, 2023).
Taking into account the above-mentioned theoretical foundations of spatial potentials formation in the intra-agglomeration environment and according to the adopted methodological approach, we will carry out practical testing on the example of demographic, settlement and economic structures of the Saint Petersburg agglomeration.
Table 1 presents the results of the calculations of the agglomeration effect potential of the demographic and settlement structure in the cities of the Saint Petersburg agglomeration.
Table 1. Determination of agglomeration effect potential of demographic and settlement structure in the cities of Saint Petersburg agglomeration as of January 1, 2023
|
City of agglomeration |
Population as of January 1, 2023, thousand people |
Total shortest distance along the road lines between the city under consideration and the central point of the core, km |
D р i |
|
Saint Petersburg (core) |
5600.1 |
746* |
5601.01 |
|
Volosovo |
11.6 |
1,395 |
16.09 |
|
Vsevolzhsk |
78.8 |
989 |
85.07 |
|
Gatchuna |
92.7 |
944 |
99.25 |
|
Kirovsk |
27.1 |
915 |
33.93 |
|
Kommunar |
25.8 |
874 |
32.95 |
|
Kudrovo |
64.9 |
736 |
73.34 |
|
Lomonosov |
39.1 |
1,052 |
45.03 |
|
Luban |
4.4 |
1,388 |
8.92 |
|
Murino |
104.6 |
927 |
111.26 |
|
Nikolskoe |
21.9 |
793 |
29.79 |
|
Otradnoe |
25.4 |
795 |
33.27 |
|
Sertolovo |
70.9 |
1,066 |
76.72 |
|
Sosnovy Bor |
64.1 |
1,652 |
67.86 |
|
Tosno |
33 |
973 |
39.42 |
|
Shlissenburg |
13.9 |
981 |
20.29 |
|
* We take the distance from the central point of the core (Palace Square) to the cities of the periphery. Source: own compilation based on the data of the Department of the Federal State Statistics Service for Saint Petersburg and the Leningrad Region (Petrostat) and on the basis of the search and information cartographic service “Yandex Maps”. |
|||
Based on the results obtained, we construct a cartographic model reflecting the distribution of spatial potentials of the agglomeration effect of the demographic and settlement structure of the Saint Petersburg agglomeration, the impact levels of which are represented by five groups of clusters obtained with the help of the neural network of the software used ( Fig. 1 ).
As we can see, the central part of the core of the Saint Petersburg agglomeration forms a gravity cluster, which is surrounded by high-potential, medium-potential and low-potential clusters. Their spatial configurations are represented by ring shapes (limited by the “sea facade” from the west), which is due to the pronounced monocentricity of the Saint Petersburg agglomeration and the concentration of the largest part of the population. In the south-western direction, the ring configurations of medium-potential and low-potential clusters expand and go beyond the core boundary, covering the eastern and north-eastern parts of the peripheral Lomonosovsky district2. Within the medium concentrated cluster, in the eastern part of the Lomonosovsky district (adjacent to the south-west of the core), there is Anninskoye urban settlement and in the north-eastern part (adjacent to the south of the core) – Villozskoye urban settlement, where the population growth rates in 2023 compared to 2012 increased by 118.2 and 69.7% respectively3. The peripheral territory of the low-potential cluster has no urban settlements, but
Figure 1. Clusters of spatial potentials of agglomeration effect of demographic and settlement structure of the Saint Petersburg agglomeration
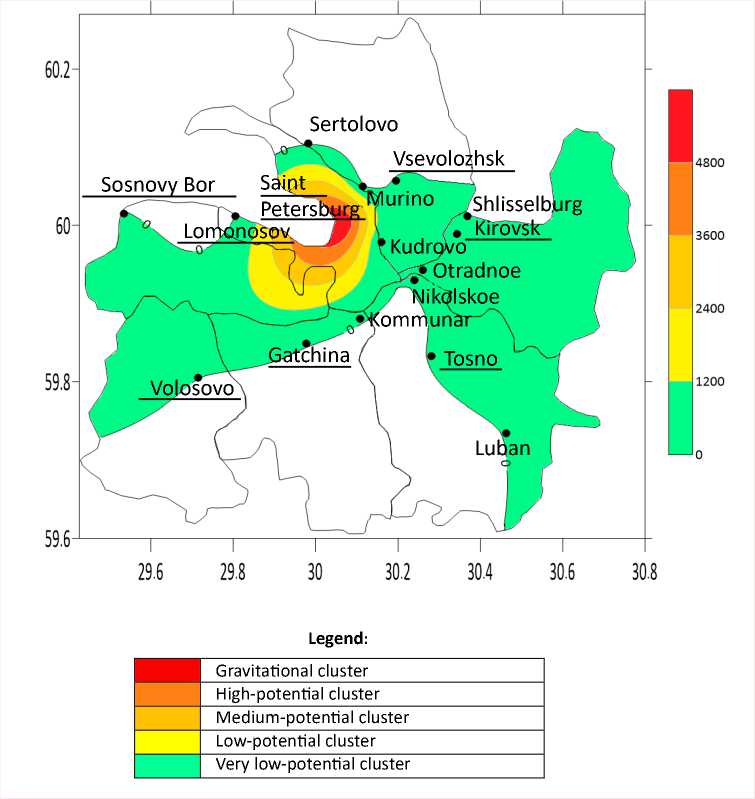
Source: own compilation on the basis of Surfer Golden Software.
within its boundaries there are rural settlements Nizinskoye, Gorbunkovskoye, Lagolovskoye and Ropshinskoye, the total population of which as of January 1, 2023 amounted to 20.9 thousand people4. This allows saying that the identified demographic and settlement potential of the territories of the designated clusters is generally used effectively.
The territories belonging to the very low-potential cluster, unlike the previous clusters, have lower indicators of the agglomeration effect potential of the demographic and settlement structure, which is due to the increasing distance of the cities located in it from the gravity cluster: “If agglomeration effects are the dominant factor, the highest values of economic and financial (as well as demographic – author’s note) indicators should take place in the regional capital (agglomeration core – author’s note) and in its immediate vicinity. The presented cluster has potential opportunities for the effective development of urban planning activities because within its boundaries there are significant areas of underdeveloped territories, as well as all the peripheral cities of the agglomeration, which are subject to the spatial potential of the agglomeration effect of the demographic and settlement structure. In practice, this potential is realized by developers in most of the cities included in this cluster (except for Luban). At the same time, the largest number of developers carry out their activities in the cities located near the administrative boundary of Saint Petersburg (agglomeration core), primarily in Murino, Kudrovo, Vsevolozhsk, Sertolovo, and Kommunar.
The remaining territories of the Saint Petersburg agglomeration are not affected by the agglomeration effect of potential impact, which is due to both the increasing distance and the absence of cities: the southern parts of the Volosovsky and Gatchinsky districts, the southwestern part of the Tosno district and the northern part of the Vsevolozhsky district. It is also worth noting that the positive potential is absent in the northern part of the Lomonosovsky district of the periphery, i.e. between the cities of Lomonosov and Sosnovy Bor, which is due to the relatively remote location of the latter from the agglomeration core and the formation of its own agglomeration effect, the spatial potential of which spreads its impact in the southern direction.
Table 2 presents the results of calculations regarding the agglomeration effect potential of the economic structure for the core and administrative (municipal) districts of the periphery of the Saint Petersburg agglomeration.
Table 2. Determination of the agglomeration effect potential of the economic structure for the core and administrative (municipal) districts of the periphery of the Saint Petersburg agglomeration in 2022
|
Administrative center of the agglomeration |
VIP, million rubles |
PO, million rubles |
RT, million rubles |
VPS, million rubles |
VIC, million rubles |
Total shortest distance along the road lines between the city under study and the central point of the core, km |
EDI |
Eр i |
|
Saint Petersburg |
3797500.0 |
31747400.0 |
1951200.0 |
693600.0 |
997500.0 |
416* |
7308480.08 |
7309147.11 |
|
Volosovsky |
10649.7 |
917.6 |
0.1032 |
0.0104 |
2575.6 |
586 |
2828.61 |
15769.11 |
|
Vsevolozhsky |
281851.3 |
69295.6 |
0.3011 |
0.0279 |
50314.8 |
526 |
80292.41 |
94561.74 |
|
Gatchinsky |
135239.9 |
55539.9 |
0.1603 |
0.0407 |
24087.0 |
441 |
42973.40 |
60077.69 |
|
Kirovsky |
98730 |
18023.4 |
0.1538 |
0.0522 |
7 329.1 |
564 |
24816.54 |
38222.82 |
|
Lomonosovsky |
269066.7 |
101850.3 |
0.2604 |
0.0067 |
19299.7 |
457 |
78043.40 |
94472.11 |
|
Tosnensky |
75925.5 |
5015.8 |
0.203 |
0.0209 |
13922.3 |
543 |
18972.77 |
32908.30 |
|
Sosnovoborsky urban district |
130797.8 |
3083.1 |
0.1923 |
0.017 |
13900.8 |
683 |
29556.37 |
40619.93 |
|
* We take the total shortest distance from the central point of the core (Palace Square) to the administrative centers of the periphery. Symbols: VIP – volume of shipped industrial products; PO – profit of organizations (enterprises); RT – retail trade turnover per capita; VPS – volume of paid services per capita; VIC – volume of investments in fixed assets by organizations; EDI – economic development index. Source: own compilation based on the data of the Department of the Federal State Statistics Service for Saint Petersburg and the Leningrad Region (Petrostat), the Committee for Economic Development and Investment Activity of the Leningrad Region and on the basis of the search and information mapping service “Yandex Maps”. |
||||||||
Figure 2 shows the cartographic model reflecting the distribution of spatial potentials of the agglomeration effect of the economic structure of the Saint Petersburg agglomeration.
In contrast to the demographic and settlement structure, the economic structure of the Saint Petersburg agglomeration has a more pronounced monocentrism. The first four groups of clusters: gravitational, high-potential, medium-potential and low-potential clusters are characterized by larger territorial areas of their potential impact. The high-potential and medium-potential clusters extend beyond the agglomeration core boundary, covering the peripheral towns of Kudrovo and Murino, respectively, as well as the extreme northeastern parts of the Lomonosovsky district bordering the core. The medium-potential cluster also includes a small eastern part of the Vsevolozhsky
Figure 2. Clusters of spatial potentials of agglomeration effect of economic structure of the Saint Petersburg agglomeration
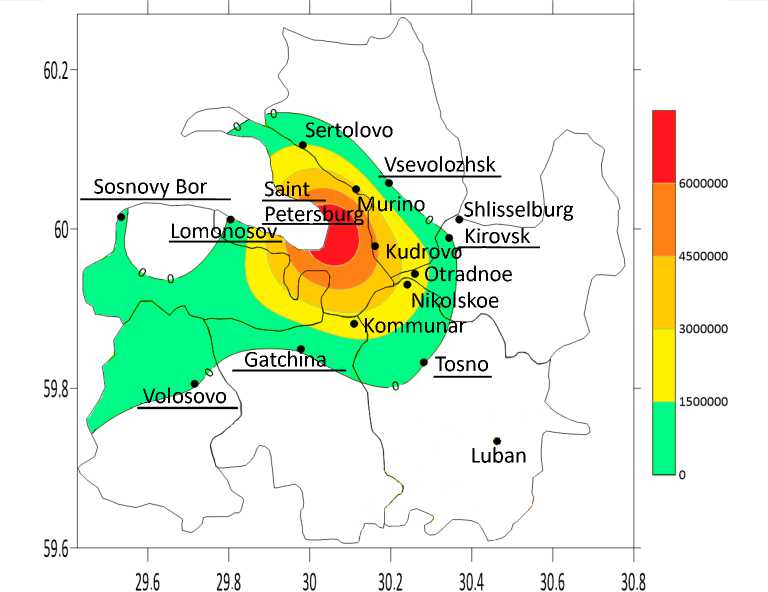
Legend :
|
Gravitational cluster |
|
|
High-potential cluster |
|
|
Medium-potential cluster |
|
|
Low-potential cluster |
|
|
Very low-potential cluster |
Source: own compilation on the basis of Surfer Golden Software.
district (beyond Kudrovo) and very small parts of the Tosnensky and Kirovsky districts. The low-potential cluster stretches across the territory of the north-western part of the core, reaching the periphery to the town of Sertolovo, and then extends in a ring around the previous cluster, including the towns of Otradnoye, Nikolskoye and Kommunar, ending in the western part of the core, not reaching the town of Lomonosov. In economic terms, the peripheral territories of the above clusters have very close ties with the agglomeration core in terms of production, infrastructure, sales, migration and labor, i.e. they are actually a continuation of the agglomeration core.
The very low-potential cluster includes territories reaching the administrative centers of peripheral districts – Vsevolozhsk, Kirovsk, Tosno, Gatchina, Volosovo, and Sosnovy Bor. In the southwestern part its spatial configuration is similar to a similar cluster of demographic and settlement structure. In the rest of the Saint Petersburg agglomeration, the positive agglomeration effect of the economic potential is not manifested due to the reasons outlined in the characterization of the demographic and settlement structure.
Conclusion
Thus, the study formulated a theoretical basis for the formation of spatial potentials in the intraagglomeration environment, the essence of which is based on the simultaneous action of centrifugal and centripetal gravitational forces. The source of spatial potential is agglomeration effects, the effectiveness of which can be manifested in the centers of concentration of certain functional structures and their impact on the surrounding space. The proposed methodological approach allowed determining the spatial potential of demographic, settlement and economic structures of the second largest urban agglomeration of the Russian Federation – Saint Petersburg. As a result, we revealed that agglomeration effects of the considered structures have a positive spatial potential for the formation and development of local peripheral centers. Initially, such localities should be administrative centers of the peripheral districts of the Leningrad Region – Vsevolozhsk, Kirovsk, Tosno, Gatchina, Volosovo, and Sosnovy Bor. The distinctive feature of the proposed and tested methodological approach is the discovery of spatial reserves (spatial potentials) on the basis of agglomeration effects in a developed intraagglomeration environment. Interpretation of the spatial potential of the agglomeration effect in the structures of the Saint Petersburg agglomeration is represented in each of them by five groups of clusters: gravitational, high-potential, mediumpotential, low-potential and very low-potential, the levels and configurations of which are defined through the neural network capabilities of Surfer Golden Software. Unlike traditional (mechanical) methods of clustering, the neural network of the applied software takes into account non-linear parameters of input and output data (indicators) on the basis of their interconnectedness, which made it possible to obtain the most accurate result that is not tied to administrative boundaries.
Promising directions for further research are related to the development of new methodological and methodological approaches aimed at finding and modeling agglomeration effects and their spatial potentials in the functional structures of individual cities, urban agglomerations or regions (investment, innovation, environmental, transport, service, cultural, etc.). It is also a promising direction to determine the spatial potentials of agglomeration effects of individual large enterprises based on the indicators of their functional activities. However, such research is difficult due to the lack of open statistical data at the enterprise level.
The research results can be used by regional and municipal public authorities in developing strategies of territorial, spatial, socio-economic and urban development, as well as by developers and business entities in choosing, respectively, the locations of real estate and production activities.
References Methodology for determining the spatial potential of agglomeration effects: the case of the Saint Petersburg agglomeration
- Burakov N.A., Rubinstein A.Ya. (2020). Theoretical and applied aspects of measuring the economic growth potential of Russian regions. Prostranstvennaya ekonomika=Spatial Economics, 16(1), 24–50. DOI: doi.org/10.14530/se.2020.1.024-050 (in Russian).
- Cellmer R. (2023). Local amenities – spatial modeling of market potential based on open data. Real Estate Management and Valuation, 31(4), 57–64. DOI: 10.2478/remav-2023-0030
- Chen L., Yu L., Yin J., Xi M. (2023). Impact of population density on spatial differences in the economic growth of urban agglomerations: The case of Guanzhong Plain Urban Agglomeration, China. Sustainability, 19(15), 1–18. DOI: 10.3390/su151914601
- Encarnacion R., Magnaye D., Castro A.G. (2023). Spatial analysis of local competitiveness: Relationship of economic dynamism of cities and municipalities in major regional metropolitan areas in the Philippines. Sustainability, 15(2), 1–24. DOI: 10.3390/su15020950
- Evteev O.A. (1969). Map of the potential of the settlement field as a special type of representation of the population of the territory. Vestnik Moskovskogo universiteta. Seriya 5. Geografiya=Moscow University Bulletin. Series 5, Geography, 2, 72–76 (in Russian).
- Friedmann J. (1966). Regional Development Policy: A Case Study of Venezuela. MIT Press.
- Gusein-Zade S.M., Mikheeva V.S., Khanin S.E. (1988). Modeling of territorial socio-economic systems. Vestnik Moskovskogo universiteta. Seriya 5. Geografiya=Moscow University Bulletin. Series 5, Geography, 3, 14–20 (in Russian).
- Kolomak E.A., Sherubneva A.I. (2023). Assessment of the significance of agglomeration effects in the South of Siberia. Prostranstvennaya ekonomika=Spatial Economics, 19(1), 52–69. DOI: 10.14530/se.2023.1.052-069 (in Russian).
- Lavrikova Yu.G., Suvorova A.V. (2020). Optimal spatial organization of the regional economy: Search for parameters and dependencies. Ekonomika regiona=Economy of Region, 16(4), 1017–1030. DOI: 10.17059/ekon.reg.2020-4-1 (in Russian).
- Lima L., Maraschin C., Giaccom B., Giusti C. (2023). Urban spatial configuration and interactions with retail activities: An approach based on contact. SSRN Electronic Journal. Available at: https://papers.ssrn.com/sol3/papers.cfm?abstract_id=4355129. DOI: 10.2139/ssrn.4355129
- Makarova M.N. (2021). Modeling socio-demographic asymmetry of territorial development. Ekonomicheskie i sotsial’nye peremeny: fakty, tendentsii, prognoz=Economic and Social Changes: Facts, Trends, Forecast, 14(2), 29–42. DOI: 10.15838/esc.2021.2.74.2 (in Russian).
- Manesh S.N., Choi J.O., Shrestha B.K. et al. (2020). Spatial analysis of the gender wage gap in architecture, civil engineering, and construction occupations in the United States. Journal of Management in Engineering, 36(4), 1–15. DOI: 10.1061/(ASCE)ME.1943-5479.0000780
- Mansour Sh., Saleh E., Al-Awadhi T. (2020). The effects of sociodemographic characteristics on divorce rates in Oman: Spatial modeling of marital separations. The Professional Geographer, 72(3), 332–347. DOI: 10.1080/00330124.2020.1730196
- Medvedkov Yu.V. (1965). Ekonomgeograficheskaya izuchennost’ raionov kapitalisticheskogo mira. Vyp. 2. Prilozheniya matematiki v ekonomicheskoi geografii [Economgeographic Study of the Areas of the Capitalist World. Issue 2. Applications of Mathematics in Economic Geography]. Moscow: Institut nauchnoi informatsii AN SSSR.
- Mezhevich N.M., Olifir D.I. (2023). Comparative analysis of the territorial support frame of settlement in coastal areas: The case of St. Petersburg and Kaliningrad regions. Baltic Region, 1(2), 23–40. DOI 10.5922/2079-8555-2023-2-2
- Naumov I.V. (2019). Investigation of the interregional relationships in the processes of sharping the territories’ investment potential using the methods of spatial modelling. Ekonomika regiona=Economy of Region, 15(3), 720–735. DOI: 10.17059/2019-3-8 (in Russian).
- Olifir D.I. (2022). Comparative analysis of the spatial structures of the Moscow and St. Petersburg agglomerations. Prostranstvennaya ekonomika=Spatial Economics, 18(1), 73–100. DOI: 10.14530/se.2022.1.073-100 (in Russian).
- Olifir D.I. (2023). Spatial differentiation of socio-economic development of the St. Petersburg Agglomeration. Studies on Russian Economic Development, 34(1), 42–50. DOI: 10.1134/S1075700723010148
- Pankratov A.A., Musaev R.A., Badina S.V. (2021). Approaches to identifying, measuring and predicting cluster effects. Problemy prognozirovaniya=Studies on Russian Economic Development, 186(3), 126–134. DOI: 10.47711/0868-6351-186-126-134 (in Russian).
- Rastvortseva S.N., Snitko L.T. (2020). Regional specialization and agglomeration effects in the Russian economy. Ekonomicheskie i sotsial’nye peremeny: fakty, tendentsii, prognoz=Economic and Social Changes: Facts, Trends, Forecast, 13(3), 46–58. DOI: 10.15838/esc.2020.3.69.4 (in Russian).
- Rybkin A.V., Baburin V.L. (2019). Estimating agglomeration processes potential in territorial socio-economic systems (Irkutsk urban agglomeration case). Regional’nye issledovaniya, 66(4), 4–19. DOI: 10.5922/1994-5280-2019-4-1 (in Russian).
- Spijker J., Recaño-Valverde J., Martínez S., Carioli A. (2021). Mortality by cause of death in Colombia: A local analysis using spatial econometrics. Journal of Geographical Systems, 23(2), 161–207. DOI: 10.1007/s10109-020-00335-1
- Stewart J.Q. (1941). An inverse distance variation for certain social influences. Science, New Series, 93(2404), 89–90.
- Suvorova A.V. (2019). Development of growth poles in the Russian Federation: Direct and reverse effects. Ekonomicheskie i sotsial’nye peremeny: fakty, tendentsii, prognoz=Economic and Social Changes: Facts, Trends, Forecast, 12(6), 110–128. DOI: 10.15838/esc.2019.6.66.6 (in Russian).
- Yang Y., Caset F., Derudder B. (2023). Does urban polycentricity contribute to regional economic growth? Empirical evidence from a panel of Chinese urban regions. Regional Studies, 1–15. DOI: 10.1080/00343404.2023.2255623
- Zhang S., Ding J., Zheng H., Wang H. (2023). Does spatial functional division in urban agglomerations reduce negative externalities in large cities? Evidence from urban agglomerations in China. Heliyon, 9(10), 1–12. DOI: 10.1016/j.heliyon.2023.e20419
