Methods and tools for information visualization on the basis of attributed hierarchical graphs with ports

Author: Kasyanov V.N.
Journal: Siberian Aerospace Journal @vestnik-sibsau-en
Section: Informatics, computer technology and management
Article in issue: 1 vol.24, 2023.
Free access
At present visualization of graph models is an inherent part of the processing of complex information about the structure of objects, systems and processes in many applications in science and technology, and at the market there are widely presented science-intensive software products, using the information visualization on the basis of graph models. Since the information to visualize is constantly growing and becoming more complex, more and more situations are arising, where classical graph models cease to be adequate. More powerful graph-theoretic formalisms are required and appear to represent information models with a hierarchical structure, since hierarchy is the basis of numerous methods for visual processing of complex big data in various fields of application. One of these formalisms is the so-called hierarchical graphs. This formalism allows to select a set of such its parts (so-called fragments) in the given classical graph that all elements of each selected fragment deserve a separate joint consideration, and all fragments of the selected set form a nesting hierarchy. At the A. P. Ershov Institute of Informatics Systems, the Visual Graph visualization system was constructed, which is based on hierarchical graphs and allows to explore complex structured big data through their visual representations. In many applications, objects modeled by graph vertices are complex and contain non-intersecting logical parts (so-called ports) through which these objects are in a relationship modeled by arcs. In the paper, the formalism of attributed hierarchical graphs with ports is introduced and new possibilities of the Visual Graph system for visualization of large structured data based on attributed hierarchical graphs with ports are considered.
Attributed hierarchical graph, data visualization, graph model, port, visualization system
Short address: https://sciup.org/148329669
IDR: 148329669 | UDC: 004.4'236 | DOI: 10.31772/2712-8970-2023-24-1-8-17
Text of the scientific article Methods and tools for information visualization on the basis of attributed hierarchical graphs with ports
Visualization of structured or relational data based on graph models has got many applications in both real and theoretical spheres [1–3]. Among them, there are physical communication networks and electrical networks, on the one hand, compiler data structures and state transition diagrams, on the other. Therefore, at present, science-intensive software products using information visualization methods based on graph models are widely represented on the market, such as Cytoscape [4], Higres [5], Gephi [6], Graphviz [7], Tulip [8], yEd [9] and many others.
Since the information to visualize is constantly growing and becoming more complex, more and more situations are arising, where classical graph models cease to be adequate. More powerful graph-theoretic formalisms are required to represent information models with a hierarchical structure, since hierarchy is the basis of numerous methods for visual processing of complex big data in various fields of computing systems application [3; 10; 11]. One of these formalisms is the so-called hierarchical graphs and graph models [3]. In the original graph, this formalism allows to select a set of such parts (so-called fragments), all elements of each fragment deserve separate joint consideration, and all fragments of the selected set form a nesting hierarchy. The hierarchy of fragments provides a good opportunity to deal with complexity when visualizing structured data in the applications to deal with large amounts of complex structured data. It forms the basis for natural "abstraction" and "reduction" methods the researchers can use to reduce the visual complexity of a large graph. The Institute of Informatics Systems. A.P. Ershov of the Siberian Branch of the Russian Academy of Sciences created a Visual Graph visualization system at the request of Intel, the system is based on hierarchical graph models and allows to explore complex structured big data occurring in compilers and other program construction systems through their visual representations [12].
In many applications, the objects modeled by graph vertices are complex and may contain several different logical parts through which these objects are in a relationship modeled by edges. For example, in the railway graph of a country (or some territory), the settlements modeled by the graph vertices can be connected by railway lines passing different railway stations of these settlements. When representing the data flow among program statements in the form of a so-called information graph, the program statements modeled by the graph vertices consider their different operands (the so-called information inputs belonging to different places where data are used as arguments of statements, and information outputs belonging to different ones, where the results appear to statements); through them data exchange between statements occurs during the execution of the program (from outputs to inputs), and, therefore, information links among statements (vertices of the information graph) are usually represented by oriented edges (arcs) that connect corresponding operands of statements [3]. While graphs with vertices modelling complex objects are represented in existing graph description formats (for example, the standard graph is GraphML description format [13]), they are different logical parts of complex objects usually expressed using the so-called vertex ports; when depicting a graph, these can be represented by different points (or different non-intersecting parts) of vertex images where the corresponding vertices are connected to the edges incident to them.
This article has introduced the formalism of attributed hierarchical graphs with ports, has described ways of representing such graphs on a plane, as well as it has briefly represented new possibilities of the Visual Graph system for visualizing large-sized structured data based on attributed hierarchical graphs with ports. The article is an extended version of the research presented by the author at the III Siberian Scientific Seminar Data Analysis Technologies with Applications (SibDATA-2022) [14].
Formalism of attributed hierarchical graphs with ports and ways to represent the graphs on the plane
We would like to recall some terms and symbols from [3].
Let G be a graph of some type, for example, G can be an undirected or directed graph. Graph G is determined by two finite sets V and E, where the elements of V are the G graph vertices, and the elements of E are the directed (or undirected) edges of the graph G. G is a trivial graph if | V | = 1 and | E | = 0.
Graph C is called a fragment of the graph G and is denoted as C ⊆ G if C is a part of the graph G, that is, it consists only of elements (vertices and edges) of the graph G.
A set of fragments F is called a hierarchy of nested fragments of graph G if
-
(1) F contains the graph G and
-
(2) C 1 ⊆ C 2, C 2 ⊆ C 1 or empty C 1 ∩ C 2 for any C 1, C 2 ∈ F .
For any distinct C 1, C 2 ∈ F , the fragment C 1 is directly nested into C 2 if C 1 ⊆ C 2 and there is no other C 3 ∈ F different from C 1 and C 2 that C 1 ⊆ C 3 ⊆ C 2 . Fragment C ∈ F is elementary if F contains no fragments directly nested into C. A hierarchical graph H = ( G , T ) consists of a graph G and a rooted tree T, which represents a direct nesting relation between elements of some hierarchy F of nested fragments of G.
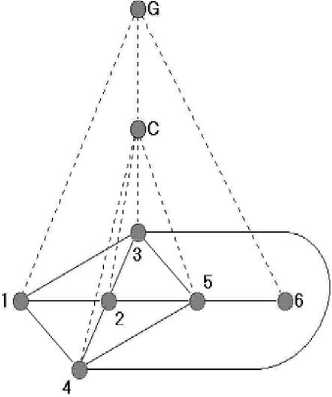
Рис. 1. Простой иерархический граф
-
Fig. 1. A simple hierarchical graph
G is called the main graph of H. T is called the nesting tree of H. A hierarchical graph H = ( G , T ) is called simple if all its fragments are generated subgraphs of graph G.
It is easy to mention that every cluster graph can be considered as a simple hierarchical graph H = ( G , T ), where G is an undirected graph, and the leaves of the tree T are trivial subgraphs of graph G.
An example of a simple hierarchical graph is shown in fig. 1, where the edges of the main graph G are shown by solid lines, and the edges of the nesting tree T are dashed.
This simple hierarchical graph H contains six trivial fragments and two non-trivial fragments: G and C = {1, 2, 3.5}.
We define hierarchical graphs with ports as a subclass of hierarchical graphs as follows.
Let H = ( G , T ) be a hierarchical graph and let P g V be some distinguished subset of vertices of the graph G. We will call the ports of fragment C together with all those of its vertices from P that do not belong to any nested fragment from F.
It is easy to see that in any hierarchical graph with ports H = ( G , T ) , each vertex from P is a port of some fragment C e F and only one of its fragment.
Therefore, the set of all vertices of a graph H = ( G , T ) splits into three pairwise disjoint sets:
-
(1) the set of all ports P;
-
(2) the set of simple vertices: all those vertices of its main graph G that are not ports of fragments from F;
-
(3) the set of all those vertices of the nesting tree T that are not trivial fragments of the main graph.
For example, the information graph of a program can be considered as a hierarchical graph with ports H = ( G , T ), where G is a directed graph with P = V , and each fragment C e F , different from G, it is an elementary empty fragment, its set of ports splits into two such disjoint subsets as In ( C )and Out ( C ), that there are no arcs , outgoing from ports In ( C ) or entering ports Out ( C ). Following this consideration, the elementary fragments C e F model the program statements, In ( C ) and Out ( C ) are the sets of information inputs and outputs of the corresponding statements, and the arcs of the main graph G are the information links among the corresponding outputs and inputs of the statements.
The image (or stacking) of a hierarchical graph with ports H = ( G , T ) is such a representation of the elements of H on the plane that the following properties are met:
-
1. Each vertex of the graph H is represented by some closed area (for example, a circle or a rectangle). A region is defined by its boundary (a simple closed curve in a plane) that divides the rest of the
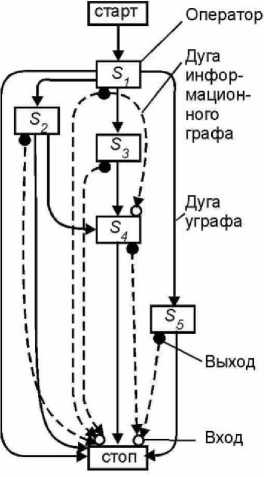
Рис. 2. Р-схема
Fig. 2. P-diagram
-
2. For any C , C ∈ F , intersection of fragment regions C and C is empty only if C ∩ C is empty, and the region of each fragment C ∈ F includes the regions of all nested fragments and the regions of all its ports and simple vertices.
-
3. The area of any port and any simple vertex of any fragment C ∈ F does not contain points of areas of other ports and simple vertices of fragment C and points of areas of the fragments nested in fragment C.
-
4. Each edge of graph G is represented by a simple curve (with an arrow if this edge is oriented) connecting two points belonging to the boundaries of the two regions representing the vertices incident to the given edge.
-
5. All edges of any fragment C ∈ F are located inside the region of fragment C.
-
6. If a simple vertex, port or edge h of graph H does not belong to some of its fragment C ∈ F , then the region of fragment C does not contain points of the region of a simple vertex or port h and does not contain points of the curve representing the edge h that connects vertices not belonging to fragment C.
plane into two parts: an inner face and an outer face. In other words, the area representing the vertex of the graph H consists of its boundary and its inner face.
We consider the use of the introduced formalism to represent an operator scheme over distributed memory (or a P-diagram) as an example [3]. In an operator scheme of this type, the control graph (ugraph) of the program, which vertices correspond to the program statements, and the arcs represent control connections (possible control transfers) among them, is, as it were, supplemented by an information graph representing information connections between the corresponding outputs and inputs of statements. Figure 2 shows an example image of a specific scheme over distributed memory. Here, as usual, the program statements are shown as rectangles with circles representing the operands of the statements (the statement inputs are located on top of the corresponding rectangle, and the outputs are on the bottom). Control links are shown as solid lines (with arrows) connecting statements, and information links are shown as dotted lines (with arrows) connecting statement outputs to inputs.
Each P-diagram can be represented as a hierarchical graph with ports H = (G,T) , where any fragment C∈ F, different from the main graph G, is an elementary empty fragment, consisting of one main vertex q ∈V \ P and a possibly empty set of ports p∈ P, which splits into two disjoint subsets In(C) and Out(C). Due to this representation, simple vertices q of elementary fragments C∈ F model the statements of the P-diagram, and ports p from the sets In(C) and Out(C) model their information inputs and outputs.
The arcs of the main graph G connecting the vertices q ∈V \ P are control links, and the arcs of the main graph G connecting the ports p∈ P are information links between the corresponding outputs and inputs of statements. If we depict each elementary fragment of a hierarchical graph as a figure formed by a rectangle depicting its vertex, and adjacent circles depicting its ports (inputs are on the top of the rectangle, and the outputs are on the bottom), each arc of the main graph is drawn either as a solid line with an arrow, if it is a control link, or a dotted line with an arrow in the case of an information link, then it is possible to get a standard image of the P-diagram shown in fig. 2.
Let a set of objects W, called attributes, be given, and let each element w∈W be associated with a set of objects B(w), called possible values of the attribute w . For example, certain sets of numbers, symbols, or strings (character strings) can be used as a value B(w). Let M denote the set of all pairs (w,v) formed from the attributes w∈W and their values v ∈ B(w).
An attributed hierarchical graph with ports is a pair ( H , L ) , where H is a hierarchical graph with ports, and L is a function of attributing that maps a subset of L ( h ) ⊆ M to each of its element h .
Depicting an attributed hierarchical graph with ports, the attributes and their values for the elements of the hierarchical graph can either be expressed implicitly through certain properties of the way these elements are represented (for example, through the geometric shape of the vertex area, its dimensions, and others), or they could be displayed explicitly in the form of a certain type of symbols of the corresponding elements. For example, an explicit representation of attributes may specify the location and appearance of attribute images in form of texts within vertex regions or rows with lines representing edges.
New features of the Visual Graph system for visualizing large structured data based on attributed hierarchical graphs with ports
The Visual Graph system [12] is intended mainly for visual and structural analysis of the structured data arising during the operation of a compiler (or other program construction system), based on attributed hierarchical graphs of a sufficiently large size, and now also with ports. The following scenario of using the system is assumed (Fig. 3). First, the compiler (by itself or with the help of an auxiliary program) translates the graph model from its internal representation into a file of one of the formats supported by the Visual Graph system, usually GraphML-file. Further, the Visual Graph system can read this graph model from the file, visualize it, and provide the user with the means to navigate and analyze it. In contrast to foreign counterparts (and our Higres system), the Visual Graph system supports the processing of arbitrary attributed hierarchical graphs of a sufficiently large size, it is focused on the step-by-step construction of a multi-window image of a graph model consisting of enlarged images of model fragments that are interesting to the user; it also provides wide opportunities for navigation within the graph model and its structural analysis, work with the attributes of its elements, as well as a simple extension and customization of the system to the needs of a particular user.
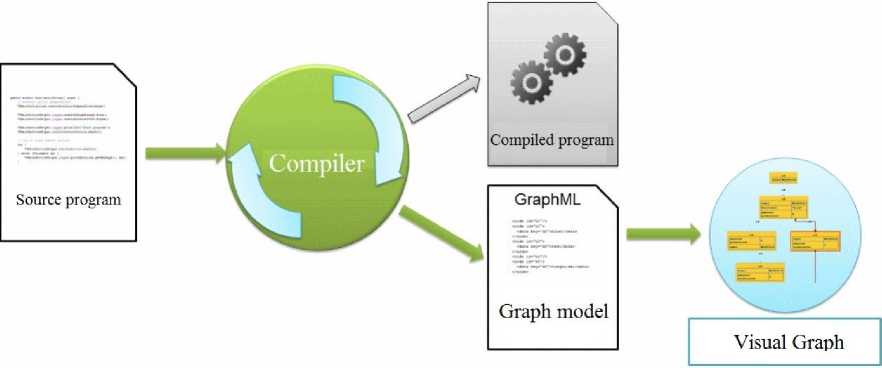
Рис. 3. Сценарий использования системы Visual Graph
Fig. 3. The scenario of using the Visual Graph system
Initially, the system supported only one format to representing graphs, this is the standard GraphML graph description language. The current version of the system obtains support for such formats as DOT [15] and GML [16], since some very popular compilers and visualization systems are focused on working with these formats. The system has also added the ability to export graph parts to GraphML format for further processing.
The current version of the system has got the set of built-in algorithms for stacking graphs changed due to its expansion with two algorithms: the algorithm for circular stacking of attributed hierarchical graphs with ports [17], and the algorithm for level-by-level stacking of attributed hierarchical graphs with ports demonstrating the internal representation of functional programs [18]. Simultaneously, the JGraph library [19] originally used in the system for displaying and stacking graphs has been replaced with a specially designed module for displaying graph models in the current version of the system. The fact is the JGraph library has got a number of limitations making it difficult to implement work with attributed hierarchical graphs with ports in full. The main obstacles in using it to implement new built-in stacking algorithms are associated with the significantly increased number of graph elements due to ports, as well as with the required changes in the ways of displaying ports and fragments.
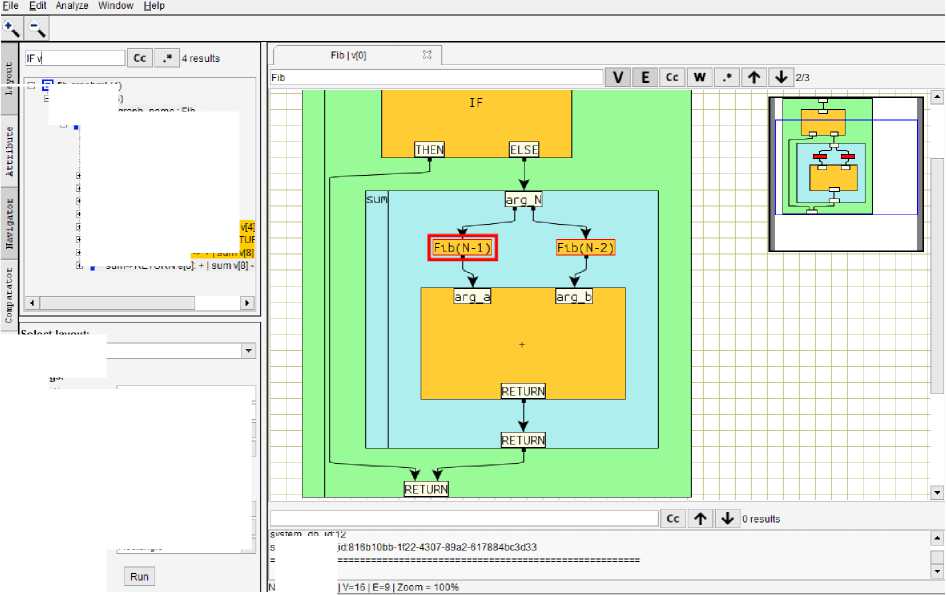
The user interface of the system has also been changed, though it still includes a desktop, a navigation bar, and an attribute panel (Fig. 4).
Settings:
ime: Fib | v[0] | sysiem_aD_ia: 12 system_vertex_i
Рис. 4. Система Visual Graph
Fig. 4. Visual Graph System
В E fib.graphml (4) 3 ft Fib 1401 (4) ♦ inner_graph_name: Fib Й Jl IF I Fib 41] (4)
i.....♦ inner_graph_name : IF ♦ inner_graph_name: sum ♦ nodejd: Fib и argJN v[2] u RETURN 431
s :■ if»w(i> '
+l Г> + I sumv[8]
В И arg_N->IF e[5]: arg_N v[2] -> IF к 3 L ■ IF->RETURN e[6]: IF v[4]-> RET +l и и IF->sum e[7]: IF v[4] -> + I sum v
3 - ■ sum->RETURN e[B]
Select layout: |Hierarchical layout
Currently the desktop consists of a set of tabs opened by a user for visual and structural analysis of selected fragments of a hierarchical graphical model in the form of their images on a plane, built using the stacking algorithms built into the system. Structural analysis tools include various built-in graph model processing algorithms assisting the users to select and visualize the information they need in graph images. These include, for example, tools such as finding shortest paths, cycles, or obligatory predecessors in a graph, as well as finding the maximum common subgraph of the two graphs. Each of the built-in stacking algorithms and structural analysis algorithms has its own set of parameters permitting to control both the type of the graph model image obtained as a result of its operation and the process of its construction. In addition, to improve the image obtained automatically, the user can manually change the shape of vertices and edges, display attributes, the scale of the visible area, and moreover, and the user can apply the grid to perform these changes. Each tab has its own filter (search string), using it makes it possible to find and select all those elements in the visible part of the graph model, the text attributes of which satisfy the regular expression entered by the user in the search string. The filter options are expanded for customizing what elements to search for. For example, only vertices or edges can be searched. The mini-map allows to view the entire graph together with its se- lected part that is visible in the current tab, and it also provides the user with the ability to move and scale the visible part of the graph. The mini-map has been moved from the toolbar where it was originally placed to the top right of the current tab. The ability to disable the mini-map display has also been added; which allows the user, if necessary, to increase the vertical size of the area of the current tab to view the constructed image of the visible fragment of the graph.
The navigation bar is a tool to visualize all parts of the graphs the user is currently working in the form of an image applying the indentation trees of the nesting of fragments of these graphs. Operations of folding and expanding images of nesting subtrees are supported, as well as selecting fragments of interest to the user and opening them in new tabs. To search quickly through the trees, the filter (search string) has been improved, which allows the users to easily find the fragments of interest to them using regular expressions. The differences from the original version are to provide more flexibility when specifying search conditions, as well as to improve work with attributes containing large amounts of data.
The attribute panel is a tool to control the visualization of attributes for selected vertices and edges in the current tab. To do this, the users need to select those vertices and edges due to their interest in the graph from the current tab, and then tick the attributes they want to visualize for these elements in the attribute panel. Also this tool can be applied to specify a set of attributes that will be visualized for fragment elements opened in a new tab. The attribute panel has been moved from the lower section of the user interface to the section on the left, which has increased the reviewed area of the graph image. Attribute values have been removed from the attribute panel and moved to the graphic image area, and now when the user selects elements of the graphic image, information about the selected elements automatically appears. This information is presented in the form of solid text, where it is possible to search, as well as copy parts of the text and transfer them to other third-party utilities. This menu could be hidden if desired.
Conclusion
The article introduces the formalism of attributed hierarchical graphs with ports, and also describes the ways to represent such graphs on a plane and new capabilities of the Visual Graph system to support, based on this formalism, the visualization of large structured data that occurs in compilers and other program construction systems. In the future, we plan to develop the Visual Graph system, mainly by expanding the set of built-in algorithms for stacking and structural analysis of attributed hierarchical graphs with ports of various algorithms being of interest not only for program construction systems, but also for other applications, as well as by giving the system the ability to provide corresponding web service.
References Methods and tools for information visualization on the basis of attributed hierarchical graphs with ports
- Di Battista G., Eades P., Tamassia R. et al. Graph Drawing: Algorithms for Visualization of Graphs. Prentice Hall, 1999, 379 p.
- Herman I., Melançon G., Marshall M. S. Graph visualization and navigation in information visual-ization: a survey. IEEE Transactions on Visualization and Computer Graphics. 2000, Vol. 6, P. 24–43.
- Kasyanov V. N., Evstigneev V. A. Grafy v programmirovanii: obrabotka, vizualizatsiya i primenenie [Graphs in Programming: Processing, Visualization and Application]. St. Petersburg: BHV-Petersburg, 2003, 1104 p.
- Cytoscape. Available at: https://cytoscape.org.
- Lisitsyn I. A., Kasyanov V. N. Higres – visualization system for clustered graphs and graph algorithms. Lecture Notes in Computer Science. 1999, Vol. 1731, P. 82–89.
- Gephi. Available at: https://gephi.org.
- Graphviz. Available at: https://graphviz.org.
- Tulip. Available at: https://tulip.labri.fr/TulipDrupal.
- yEd homepage. Available at: https://www.yworks.com/products/yed.
- Feng Q. W., Cohen R. F., Eades P. Planarity for clustered graphs. Lecture Notes in Computer Science. 1995, Vol. 979, P. 213–226.
- Sugiyama K. Misue K. Visualization of structured digraphs. IEEE Transactions on Systems, Man and Cybernetics. 1999, Vol. 21, No. 4, P. 876–892.
- Kasyanov V. N., Zolotuhin T. A. [Visual Graph – a system for visualization of big size complex structural information on the base of graph models]. Scientific Visualization. 2015, Vol. 7, No. 4, P. 44–59. (In Russ.).
- Brandes U., Eiglsperger M., Herman I. et al. GraphML progress report: structural layer pro-posal. Lecture Notes in Computer Science. 2002, Vol. 2265, P. 501–512.
- Kasyanov V. N. [Visualization of structured data based on attributed hierarchical graphs with ports]. III Siberian Scientific Workshop on Data Analysis Technologies with Applications (SibDATA-2022). Krasnoyarsk, ICM SB RAS Publ., P. 9–10.
- DOT. Available at: http://www.graphviz.org/doc/info/lang.html.
- GML. Available at: http://openmis.ru/doc/clang/gml-tr.html.
- Kasyanov V. N., Merculov A. M., Zolotuhin T.A. A circular layout algorithm for attributed hi-erarchical graphs with ports. Journal of Physics: Conference Series. 2021, Vol. 2099, P. 012051.
- Kasyanov V. N., Zolotuhin T. A., Gordeev D. S. Visualization methods and algorithms for graph representation of functional programs. Programming and Computer Software. 2019, Vol. 45, No. 4, P. 156–162.
- JGraph. Available at: http://dev.cs.ovgu.de/java/jgraph/tutorial/t1.html.
