Migratory Processes in the Conditions of Transformation of Territorial and Settlement Structure in the Arkhangelsk region (1926-1989)
")
Author: Konstantinov A.S.
Journal: Arctic and North @arctic-and-north
Section: Historical sciences
Article in issue: 16, 2014.
Free access
Some results of studying the question of migratory behavior of the population in the conditions of transformation of territorial and settlement structure in the Arkhangelsk region during the period between population censuses of 1926-1989 are presented in the article.
Census, population, migration, transformation, territorial settlement structure, region
Short address: https://sciup.org/148319832
IDR: 148319832 | UDC: 35.07. (470.1/2) (045)
Text of the scientific article Migratory Processes in the Conditions of Transformation of Territorial and Settlement Structure in the Arkhangelsk region (1926-1989)
Вот он мой дом, деревенский заброшенный.
С грустным укором в глаза мне глядит. Вот он стоит, снегом весь припорошенный
Тихо оторванной ставней стучит…
Soviet period in the history of the Arkhangelsk region is characterized with different groundbreaking transformation changes in its territorial--‐settled structure. Restructurisation of the appeared system of population’s resettlement in «living space» of the Northern region is overviewed by us as one of the leading factors which greatly influenced its migration behavior. As a result of migration movement of population in 1939--‐1989 a number of countries’ localities decreased for 2,6 times, of villages --‐ for 2 times, inhabited community of railway type --‐ 2,3 times, townsites --‐ 12,9 %. 6 new towns were founded in the region at the same moment, number of urban--‐ type settlements increased from 7 to 42. Regulation of population migration flows became one of the leading directions of demographic policy of Soviet government. Meanwhile, this politics hasn’t always taken into account migration climate of population. And as a result, an out--‐of--‐control process of population’s migration movement took place. Consequences of «pressure of living space» in localities had an adverse effect on its population life--‐sustaining activities. Author, when using the materials of population census and data of simultaneous statistics of its particular groups, reviews in this article consequences of migration activity in the Arkhangelsk region in 1926--‐1989. Nenets Autonomous area was in those times a part of administrative and territorial division.
Migrants as part of population
As a common consequence of results of two connected with each other processes of territorial and settlement structure in the Arkhangelsk region and migration behavior of its population, to our mind, is considered to be materials of All--‐Union population census of 1989. They contain data, which characterizes population distribution (including migrants) of the Arkhangelsk region on duration of residence in permanent place of residence during the Soviet period: in gender and age, in nationality and in groups of village and town population.
Table 1
Population and migrants census in the Arkhangelsk region in groups of population, gender and age1
|
Population |
Both gender |
All population |
Both gender |
Migrants among them (arrived all in all) |
||
|
Men |
Women |
|||||
|
Men |
Women |
|||||
|
Town and village |
1569679 |
764006 |
805763 |
833490 |
391772 |
441718 |
|
Town |
1151559 |
557351 |
594208 |
624182 |
291777 |
332405 |
|
Village |
418120 |
206655 |
211465 |
209308 |
99995 |
109313 |
According to the data of All--‐Union population census of 1989 (later census 1989) there lived in the Arkhangelsk region 1569679 people, among them 833490 migrants, or 53,1% from common population, who occupied this region. When identifying population of permanent residing in town localities and in villages to the population of arrived migrants percentagewise, it looks so: among men — 48,7% and 51,3%, among women correspondingly 45,2% and 54,8%.
There were 54,2% migrants among urban population. We must also notice, that in 1989 a unit weight of migrants--‐men was higher than the number of permanent residing of the same gender on 2,4%, and migrants--‐women this index was 5,9% correspondingly. As part of countryside each second person was a migrant. A unit weight of migrants--‐men to permanent residing in a countryside was 48,4%, among migrants--‐women this index was 51,7%.
In a group of population younger than working age, migration process was rather more intensive in countryside. Each fifth rural man of this age was a migrant, as part of urban population this index was not higher than 15,0%. There are no sufficient differences in gender groups among countryside and urban population.
As part of urban population of working age unit weight of migrants ranged from 65,0 to 65,4%. There are no sufficient differences in gender groups. As part of countryside population in this age group this index was for women 71,0%, for men — 60,3%, for the whole group — 64,8%.
In a group of urban population older than working age migrants were 81,5%, among them migrants--‐men — 82,8%, migrants--‐women — 81,2%. In this group of countryside population each second person was a migrant. There are no sufficient differences in gender groups. At the same time let’s pay attention to the percentage of urban and countryside migrants older than working age in this group. The whole group is 29,7%, migrants--‐men — 29,5%, migrants--‐women — 29,9%. We can note, that the formed correlation can help us to make a conclusion that one of the leading directions of countryside migration still were urban localities.
From 31275 migrants in the Nenets Autonomous Area 71,9% were urban population, 29,0% were countryside correspondingly. Practically the same correlation is noticed among migrants in groups younger than working age and in working age groups. A unit weight of countryside migrants older than working population was 38,4% from the whole in the Area, and of urban — 61,6%.
There are no sufficient differences in migrants--‐men in common group, and in groups younger than working age and working age. These indexes teeter between 71,9--‐64,6% among urban population and 25,4--‐26,4% — among countryside one. Unit weight of migrants older than working group in urban population among migrants of the group in the NAA was 58,5%, countryside migrants — 41,5%.
For migrants--‐women of working groups and older indexes are practically the same: urban population — 68,3--‐68,5%, countryside population — 31,5--‐31,7%. At the same time in the group younger than working age in urban population this index was 73,8%, in countryside population — 26,2%.
Characteristics of migrants in gender and age
Let’s analyze the results of population census of 1989, which characterize the unit weight of all arrived migrants of all nationalities and ages in urban and countryside, urban, countryside population of Arkhangelsk region according to three groups (both gender, men, women). As a whole they are represented in table 2.
|
Allocation of migrants in gender and age in the Arkhangelsk region |
|||||||||
|
Urban and countryside population |
Urban population |
Countryside population |
|||||||
|
Unit weight of arrived, in % |
Unit weight of arrived, in % |
Unit weight of arrived, in % |
|||||||
|
Whole |
Incl: Men Women |
Whole |
Inc Men |
Women |
Whole |
Incl Men |
Women |
||
|
Whole population |
100,0 |
100,0 |
100,0 |
100,0 |
100,0 |
100,0 |
100,0 |
100,0 |
100,0 |
|
including : |
|||||||||
|
Before 16 (1989--‐ 1974) |
8,2 |
8,9 |
7,5 |
7,3 |
8,0 |
6,7 |
10,8 |
11,6 |
10,1 |
|
16--‐19 (1973--‐1970) |
4,0 |
4,4 |
3,6 |
4,3 |
4,7 |
4,0 |
3,1 |
3,6 |
2,6 |
|
20--‐24 (1969--‐1965) |
7,1 |
7,7 |
6,5 |
6,8 |
7,9 |
5,9 |
7,9 |
7,4 |
8,3 |
|
25--‐29 (1964--‐1960) |
10,8 |
12,2 |
9,6 |
10,4 |
11,9 |
9,0 |
12,1 |
13,0 |
11,2 |
|
Total: 20--‐29 years |
17,9 |
19,9 |
16,1 |
17,2 |
19,8 |
14,9 |
20,0 |
20,4 |
19,5 |
|
30--‐34 (1959--‐1955) |
12,1 |
13,4 |
11,0 |
11,9 |
13,2 |
10,9 |
12,7 |
14,1 |
11,4 |
|
35--‐39 (1954--‐1950) |
11,3 |
12,4 |
11,1 |
12,4 |
12,5 |
10,8 |
10,7 |
12,2 |
9,2 |
|
Total: 30--‐39 years |
23,4 |
25,8 |
22,1 |
24,3 |
25,7 |
21,7 |
23,4 |
26,3 |
20,6 |
|
40--‐44 (1949--‐1945) |
7,1 |
7,8 |
6,6 |
7,6 |
8,1 |
7,1 |
5,8 |
6,7 |
4,9 |
|
45--‐49 (1944--‐1940) |
7,4 |
7,8 |
6,9 |
7,8 |
8,3 |
7,4 |
6,0 |
6,7 |
5,4 |
|
Total: 40--‐49 years |
14,5 |
15,6 |
13,5 |
15,4 |
16,4 |
14,5 |
11,8 |
13,4 |
10,3 |
|
50--‐54 (1939--‐1935) |
8,1 |
8,2 |
7,9 |
8,3 |
8,4 |
8,2 |
7,3 |
7,6 |
7,1 |
|
55--‐59 (1934--‐1930) |
7,2 |
6,9 |
7,4 |
7,2 |
6,9 |
7,4 |
7,2 |
6,9 |
7,6 |
|
Total: 50--‐59 years |
15,3 |
15,1 |
15,3 |
15,5 |
15,3 |
15,6 |
14,5 |
14,5 |
14,7 |
|
60--‐64 (1929--‐1925) |
6,5 |
5,4 |
7,6 |
6,5 |
5,3 |
7,5 |
6,7 |
5,6 |
7,7 |
|
65--‐69 (1924--‐1920) |
3,6 |
2,0 |
5,0 |
3,6 |
1,9 |
5,0 |
3,6 |
2,1 |
5,1 |
|
Total: 60--‐69 years |
10,1 |
7,4 |
12,6 |
10,1 |
7,2 |
12,5 |
10,3 |
7,7 |
12,8 |
|
70 years and older (1919) |
6,6 |
2,9 |
10,3 |
6,7 |
2,9 |
10,0 |
5,9 |
2,7 |
9,3 |
As part of migrant, arrived from the previous place of residence, the biggest unit weight (23,4%) had migrants 1950--‐1959 years of birth, that means 30--‐39 years old. This group is practically equally represented in the common index of all migrants. A little bit higher is the index of migrants--‐men (within 25,7%--‐26,3%), than of migrants--‐women (from 20,6% to 22,1%). The following age group, which in its unit weight gets the second point is population of 1960--‐1969
years of birth (20--‐29 years old). In the whole group of arrived migrants among urban and countryside population they were 17,9%, including migrants--‐men — 19,9%, migrants--‐women — 16,1%. The same situation is among migrants in urban population, except migrants--‐women (14,9%). Among migrants of countryside population each fifth was 20--‐29 years old. Approximately equal positions deserved age groups of migrants of 1940--‐1949 and 1934--‐1939 years of birth among the countryside and urban population. At the same time among countryside population it is detected higher unit weight of migrants 50--‐59 years old, irrespective of gender (14,5%--‐14,7%), and in the group of migrants 40--‐49 years old it was lower, than representatives of all population and of urban population. Each tenth migrant in the common group was born in 1920--‐1929 годах. A unit weight of migrants younger than 16 years old ranged from 7,3% (urban population) to 10,8% (countryside population). In group 16--‐19 years old this index was correspondingly 4,3% and 3,1%. Migrants of 70 years old and older were in the common group 6,6%. Each tenth migrant--‐ woman in all women groups was 70 years old or older. In summary we would like to notice that the biggest unit weight in migration process accounted for population in working age.
Migration flows of Northerners
Not of a smaller interest are for us data on allocation of migrants according to previous place of a permanent residence, that means migration flows from urban localities and countryside (table 3).
According to population census of 1989, among 833490 migrants of urban and countryside population of the Arkhangelsk region, arrived from previous places of permanent residence, 353686 were townsmen (42,4%), from countryside arrived 476541 people (57,2%). 3263 migrants (0,4%) didn’t note the place they arrived from. Among the menfolk all in all arrived 391772 migrants, including from urban localities — 177059 people (45,2%), from countryside — 213231 people (54,4%). 1482 migrants--‐men (0,4%) didn’t note their previous place of permanent residence. Among the representatives of women gender there were 441717 people, among who 176627 lived in towns earlier (40,0%), in countryside — 263310 people (59,6%). Among migrants--‐women who didn’t name their previous place of residence there were 1781 people.
A group of migrants younger than working age included 68 169 people. Among them 36213 people (53,1%) arrived from urban localities, from countryside arrived 31600 people (46,4%). Among the migrants--‐men and migrants--‐women a unit weight of arrived from urban localities was higher than from countryside. A group of migrants of working age the situation is directly contrary. More than half of them, including men and women, named countryside the previous place of a permanent residence. Practically three fourth of migrants older than working age (common group, women) represented the countryside direction, among migrants--‐men — 69,8%.
-
Table 3
Allocation of migrants in the Arkhangelsk region according to previous place of a permanent residence 2
|
Population |
Arrived in common |
Urban and countryside population |
||
|
Included |
Didn’t note the place of previous permanent residence |
|||
|
From towns |
From countryside |
|||
|
Both gender |
||||
|
Whole population |
833490 |
353686 |
476541 |
3263 |
|
Including the age of: |
||||
|
younger than working age |
68169 |
36213 |
31600 |
356 |
|
working age |
593133 |
273317 |
317516 |
2300 |
|
older than working age |
172188 |
44156 |
127425 |
607 |
|
Men |
||||
|
Whole population |
391772 |
177059 |
213231 |
1482 |
|
Including the age of: |
||||
|
younger than working age |
34853 |
18732 |
15945 |
176 |
|
working age |
316850 |
146357 |
169301 |
1192 |
|
older than working age |
40069 |
11970 |
27985 |
114 |
|
Women |
||||
|
Whole population |
441718 |
176627 |
263310 |
1781 |
|
Including the age of: |
||||
|
younger than working age |
33316 |
17481 |
15655 |
180 |
|
working age |
276283 |
126960 |
148215 |
1108 |
|
older than working age |
132119 |
32186 |
99440 |
493 |
Let’s compare the data received on number of migrants, arrived from urban localities and from countryside. Through the region in whole this correlation makes 122855 people in favor of countryside migrants, among them men — 36172 people (29,4%), women — 85683 people (70,5%).
A surplus account appeared for urban migrants in comparison with countryside migrants in three age groups: younger than working age — 4613 people, 20--‐24 years old — 6400 people, 25--‐29 years old — 2526 people. The same picture is presented among groups of men and women. In other age groups correlation appeared to be in favor of migrants from countryside.
As part of urban population it was counted 624182 migrants. Among them 43,4% arrived from urban localities, 56,1% from countryside. From 291777 migrants--‐men 46,4% called their previous place of residence urban localities, 53,2% — lived in countryside. Among 332405 migrants--‐women form towns arrived 40,8%, from countryside 58,7%. 0,5% didn’t note the place of their previous permanent residence. There hasn’t noticed differences in this index between men and women migrants.
In a group of people younger than working age a unit weight of migrants from urban localities composed 59,1%, from countryside — 40,1%. Indexes between migrants men and women are practically the same. Among migrants of working age number of arrived from countryside was a little higher than from towns. This correlation composed 53,9% to 46,6%. There were no sufficient differences in indexes between migrants men and women. Among the migrants of older than working age 73,0% arrived from countryside, 26,6% — from urban localities. For countryside migrants--‐women this index was 5,7% higher, than for migrants--‐men from countryside.
Our conclusions are supported by data, which characterize correlation of migrants arrived from countryside to migrants arrived from urban localities. In quantity and percentage it composed 79400 people (12,7%) in common group of migrants, 19919 people (6,8%) — among men, 59481 people (17,9%) — among women. In the population younger than working age a tendency to exceedance of migrants’ unit weight of those who arrived from towns to migrants who arrived from countryside is proved. In group of working age and older than working age migrants there is a contrary tendency.
In migration allocation of countryside population 60,3% were migrants, who arrived from countryside, 39, 6% --‐ who arrived from towns. At the same time unit weight of migrants--‐women, arrived from countryside, was 24,9 points higher, than migrants--‐women from urban locations. Among the migrants--‐men this correlation was also in favor of countryside migrants — 58,1% to 41,8%. The biggest unit weight among migrants belonged to population in working age, including arrived from urban locations — 44,3%, from countryside — 55,6%. The next group were older than working age. 77,1% of population changed their previous place of permanent residence in countryside, in urban localities — 22,8%. In a group of younger than working age 44,1% used to live in towns, 58,9% arrived from countryside.
According to 1989 population census there were 31278 of men and women migrants in the Nenets Autonomous Area. 19181 people (61,3%) of them arrived from urban localities, 11960 people (38,2%) --‐ from countryside. 137 migrants (0,4%) didn’t note their previous place of residence. Among the urban population there were 22204 migrants, among who changed their previous place of permanent residence in town 13896 people or 62,3%, who left countryside — 8171 people or 36,8%. Among the countryside population there were 9074 migrants, 58,2% of them left towns, 41,8% — countryside.
Among the group of migrants younger than working age of both gender there were 4334 people, in urban localities — 3216 migrants (74,2%), in countryside — each fourth appeared to be a migrant. From the common number arrived in the NAA left towns 3066 people (70,7%), left countryside — 1256 people (29,0%). From the number arrived to the town 74,8% appeared to be migrants from towns, 24,8% — migrants from countryside. From the number arrived to the countryside 59,0% were migrants from towns, from countryside — 41,8%.
In the working age group there were 24180 migrants, or 77,3% from the common number of arrived. In this group 64,0% arrived from urban localities, 35,5% — from countryside. A unit weight of those arrived to the town practically didn’t differ from those arrived to the village. Such a situation was committed on this group of migrants in countryside.
As for migrants older than working age, from 2764 people, arrived in NAA, only 629 or 22,8% earlier lived in urban localities, while 2126 migrants (76,9%) changed their previous permanent place of residence in countryside. Practically the same situation is noticed on groups of migrants in both town and countryside.
Preferences of migrants
Studying of the Arkhangelsk region population census materials lets us find out a number of groups of localities, which were preferred by migrants with the idea of future realization of their life journeys.
The first group included cities. Analysis of population census data, undertaken in the years 1926--‐1989, helps to make conclusions on the tendency of the Arkhangelsk region’s cities population growth during the Soviet period. When 1926 in the cities lived 95455 people, by the year 1939 the number was 388625 people, that means population increased four times. Twenty years later, according to the census of 1959, number of urban population increased four times. During thirty years later of that census population increased two times and 1989 it composed
955381 человек. In common, in 1926--‐1989 population rate of those who live in towns of the Arkhangelsk region increased a tenfold.
Let’s take the analysis of population size change in towns of the region. It can show preferences of migrants when choosing one or another place of their future permanent residence. The most important factor, which influenced the migration behavior of population, was appearance of new towns on the territory of the Arkhangelsk region, which even at the origin of their foundation and later development acquired an all--‐Union importance. Firstly, it was Severodvinsk. It appeared on the base of village Sudostroy, which was awarded the status of a town 1939. During the years of Soviet government Severodvinsk became the greatest cluster of soviet shipbuilding. Its population increased in 1939--‐1989 more than ten times (11,9). During the post--‐Soviet period it decreased on 24,2%. Among the males this index was 31,8%, among female --‐ 16,2%.
Factor of region’s centre also defined the vector of migration preferences of population. Population size of Arkhangelsk by the year 1926 was 71514 people, in 1989 — 416812 people, that means it has increased 5,8 times. Census of 2010 showed reduction of urban population for 68029 people or 16,3%. Number of males decreased 19,4%, women — 13,6%.
As a factor we can also consider advantageous geographical position of some towns, proximity to traffic arteries, which supplied the increase of their roles in socio--‐economic and cultural development of particular territories of the Arkhangelsk region. These towns became «centers of attraction» of population, and foremost from nearest countryside. To the number of such towns we can name Kotlas, Velsk, Onega. In the first town population has increased during 1926--‐1989 for 15,9 times, in the second — for 7,5 times, in the third --‐ for 4,8 times.
One more factor is connected with the status of towns as administrative centers (former and present) of unitary areas. Estimates of countryside population growth looked ambiguous. For example, in Kargopol in 1926--‐1989 population has increased 3,8 times, in Shenkursk --‐ 2,9 times, in Mezen’ --‐ 1,71 times, in Sol’vichegodsk and Nyandoma --‐ 1,6 times. In Naryan--‐Mar, when taking into account number of residents without those who lived 1939 on ships, population rate has increased 1,9 times.
To the second group we would like to place urban--‐type settlements (earlier — worker’s settlements). In 1926 there lived 11156 people, in 1979 — 239897 people, which spoke for positive dynamics of population increase, including migrants. Nevertheless, population census of 1989 noticed decrease of population (196143 people), which could allow us to make a suggestion about decrease of migration in this group of urban localities.
Third group includes rural communities, which considered to be administrative centers of village regions. 7 rural communities were under issue, which in 1989 saved its administrative status. When 1926 there lived 4643 people, by the year 1989 --‐ 30946 people. As we see, population rate has increased 6,6 times. One of the factors of its growth was firstly considered to be migration of countryside population.
In the fourth group we included villages, which became central farmstead of kolkhoz and sovkhoz, and also villages of timber procurers and other branches of national economy in countryside areas of northern regions. A migration flow in them was formed because of countryside population, who lived in areas, which considered to be «unpromising» or had a temporary status of settlements of production and transport meaning (timber villages, railway barracks and sidings, and others).
Northern village: consequences of migration
Migration processes, which took place in conditions of territorial and settlement structure transformation in the countryside areas of the Northern region, had its negative consequences for life--‐sustaining activity of countryside population. During the period 1926--‐1989 it has decreased 1,8 times. By that between population censuses of 1926 and 1939 countryside population has decreased over 67520 people, population censuses 1939 and 1959 --‐ for 111949 people, censuses 1959 and 1989 — for 146774 people.
Let’t address to materials of two simultaneous statistical surveys on number of peasand holdings in different ways of socialized cooperation in countryside areas on the 1st of Janury 1940 and number of kolkhoz households on the 1st of January 1950, which are showed in table 4.
-
Table 4
Number of peasant and kolkhoz households in countryside areas of the Arkhangelsk region (0.1.01.1940 --‐ 01.01.1950)3
|
Countryside areas |
On the 1st of January 1940 |
On the 1st of January 1950 Total kolkhoz househol ds |
Correlation of number of households on 01.01.1950 to number of households on 01.01.1940 |
||
|
Total peasant househol ds |
Incl. peasant househol ds |
All peas--‐ ant house--‐ holds |
Peasant In % househol In % ds |
||
|
Arkhangelsk |
487 |
||||
|
sovkhoz |
|||||
3 Without Nenets Autonomous Area
|
Belomorsky |
--‐ |
--‐ |
1546 |
--‐ |
--‐ |
--‐ |
--‐ |
|
Velsky |
5771 |
4927 |
5184 |
--‐587 |
89,8 |
257 |
105,2 |
|
Verhnetoemsky |
6125 |
5734 |
5336 |
--‐789 |
87,1 |
--‐398 |
93,1 |
|
Vilegodsky |
5569 |
5569 |
5405 |
--‐164 |
97,1 |
--‐164 |
97,1 |
|
Vinogradovsky |
5372 |
5372 |
4582 |
--‐790 |
85,3 |
--‐790 |
85,3 |
|
Emezky |
4091 |
3220 |
3804 |
--‐287 |
93,0 |
584 |
118,1 |
|
Kargopolsky |
7656 |
7656 |
6922 |
--‐734 |
90,4 |
--‐734 |
90,4 |
|
Karpogorsky |
4874 |
4838 |
4376 |
--‐498 |
87,8 |
--‐462 |
90,4 |
|
Konoshsky |
4909 |
4909 |
4108 |
--‐801 |
83,7 |
--‐801 |
83,7 |
|
Kotlassky |
4821 |
4821 |
3602 |
--‐1219 |
74,7 |
--‐1219 |
74,7 |
|
Krasnoborsky |
4400 |
4357 |
4317 |
--‐83 |
98,1 |
--‐40 |
99,1 |
|
Lensky |
3941 |
3941 |
2679 |
--‐1262 |
68,0 |
--‐1262 |
68,0 |
|
Leshukonsky |
3066 |
3066 |
2833 |
--‐233 |
92,4 |
--‐233 |
92,4 |
|
Mezensky |
3336 |
2384 |
2673 |
--‐663 |
80,1 |
289 |
112,1 |
|
Nyandomsky |
3476 |
3476 |
2088 |
--‐1388 |
60,1 |
--‐1388 |
60,1 |
|
Onezhsky |
5143 |
4310 |
2692 |
--‐2451 |
52,3 |
--‐1618 |
62,5 |
|
Pinezhsky |
4151 |
4151 |
2227 |
--‐1924 |
53,6 |
--‐1924 |
53,6 |
|
Plesetsky |
5337 |
5337 |
2410 |
--‐2927 |
45,2 |
--‐2927 |
45,2 |
|
Priozerny |
5215 |
5215 |
2130 |
--‐3085 |
40,8 |
--‐3085 |
40,8 |
|
Primorky |
3954 |
2329 |
5827 |
1873 |
147,4 |
3498 |
250,2 |
|
Rovdinsky |
6387 |
6303 |
4912 |
--‐1475 |
76,9 |
--‐1391 |
77,9 |
|
Sol’vichegodsky |
3433 |
3433 |
2611 |
--‐822 |
76,1 |
--‐822 |
76,1 |
|
Ust’yansky |
7350 |
7350 |
6736 |
--‐614 |
91,6 |
--‐614 |
91,6 |
|
Kholmogorsky |
5400 |
4921 |
4379 |
--‐1021 |
81,1 |
--‐542 |
89,0 |
|
Cherevkovsky |
5797 |
5773 |
4741 |
--‐1056 |
81,8 |
--‐1032 |
82,1 |
|
Shenkursky |
4564 |
4196 |
4429 |
--‐135 |
97,0 |
233 |
105,6 |
|
Total through |
124138 |
117588 |
103036 |
--‐21102 |
83,0 |
--‐14552 |
87,6 |
|
regions |
During ten years number of peasant households in all the cooperated forms in socialized national economy in 1940 has decreased, in comparison with number of kolkhozes in 1950 for 21102 numbers (17%). Number of peasant households, which formed part of communes, agricultural guilds and faring comradeships, that means predecessors of kolkhoz cooperation has lowered from 117588 in 1940 up to 103036 kolkhoz households in 1950. The reduction composed 14552 of household or 12,4%.
Comparative study of data in different households of kolkhozniks to the 1st of January 1950 with data in households of peasants to the 1st of January 1940, educes some other results. A A correlation of numbers of all peasant households and actual households of kolkhozniks reduces for 27418 units or for 22,1%. The difference possesses 6316 «absent» households (5,1%) to 01.01.1950, for the second group number of «absolutely» peasant households the number of absent households stays the same, but the index composes 5,3%, which 0,2 points higher than the first group. During the period 1940--‐1950 number of private households and uncooperated artisans reduced from 1783 to 177 or for 90,1%.
With a breakdown into countryside areas from the point of view of population migration processes study the most interesting for us is the data of absent households group. According to the data of statistic investigation of 1950, a unit weight of all these households at the regional level contained in common group 4,9%. Such a level is in exceed in eleven countryside regions. For example, in Plesetsky region it was 18,0%, in Kargopolsky — 14,3%, in Shenkursky — 11,9%, in Primorsky — 9,6%. In all the other areas this level was lower than regional.
In group of kolkhoz households there were 6,1 absent households. In Priozerny regions they were 23,9%, in Kargopolsky — 16,2%, in Shenkursky — 14,5%, in Primorsky — 11,8%. In other countryside areas a unit weight varied between 0,4--‐4,7%.
As part of households of other groups of population it was noticed 2,9% absent households. There were no only in Konoshsky region. In nine regions this index was higher than regional one, in others --‐ lower than this index. In Plesetsky region abandoned were 14,8% of

Pic.1. Photo URL: images/attach/b/3/10/617/
households, in Krasnoborsky --‐ 6,8%, in Kotlassky — 6,3%, in Vinogradovsky — 6,0%, in Primorsky — 5,3%, in Shenkursky — 4,8%.
«All our life, — as justly noticed F.A.Abramov, — is all over rebuilding. In the centre its damage is not so striking. But the periphery was broken with these rebuildings. Many regions were liquidated. And now they trailed by 10--‐15 years. As a result of rebuilding all the population scattered about. The most passive element was left there. Worthless. Drinkers, lazybones and weak--‐willed» [1, pp.144--‐145].
But nevertheless, as V.I.Belov wrote «… native village was native without any extravagance. Even the most bitchy abjurer or habitual drunkard, who by a twist of fate appeared to be somewhere so far from home, rushed home. He knew that in his village he would find compassion, and understanding, and forgiveness, when he went wrong…And what could be more blessing for awake conscience? To rend a person from his motherland means to crush not just economic but moral living base» [2, p.115].
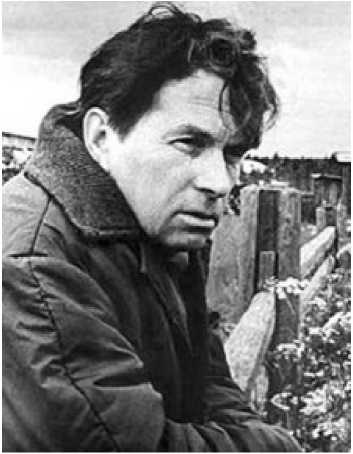
Pic. 2. Photo F.A.Abramov. URL: ews_page/
But also the Northern village itself survived difficult and contradictory period of its existence during the period of Soviet government. F.A.Abramov underlined: «Everything was. There was a «breezy» labor day, was wear and tear labor, were crippling taxes and loans. What has our village has recovered during war and postwar periods ». At the same time he marked that all that was at the back and it was impossible not to delight in that prosperity, which had come to Pinega, to our village. And all these changes happened, firstly, because of government, due to all the increased state inputs and donations [3, p.13].
But at the same time life--‐sustaining activity of countryside societies was instantiated on one hand, in indifference, inactivity, lack of sense of responsibility by his representatives for disregarded public economy, and, on the other hand, rural men still had «age--‐old experience» of work on their lands. Attitude of people to work, to household, even to themselves has changed. «Where is he, Russian peasant, whom iconized all Russian authors of the past?», --‐ wondered F.A.Abramov [1, p.428].
As for vanguard role of regional government, kommunists and Komsomol members in organization of social life and decision of everyday questions of life--‐sustaining activity of home folks, «And in their environment entered the existing nowadays sickness of indifference». For instance, in just one Verkova 25 deputies were chosen. And so residents of Verkova appreciated the effectiveness of their deputy activity: «Later it was just one village chief, but there was more order» [3, p.17--‐18]. It was out of the question any effective local administration in countryside area.
Conclusion
-
1. According to the data of population census 1989, each second resident of the Arkhangelsk region changed his permanent place of residence. There was no substantial difference between urban and countryside residents according to time groups of duration of resistance, except the group with duration of resistance 25 years and more. In this group differences contain 17,1 points for migrants as part of urban residents. A comparative study of migrants--‐men of urban and countryside population index shows inconsequent differences between them. They are bigger in group of migrants--‐men with duration of resistance 25 years and more in the places of permanent residence. As part of urban population this index was 44,5%, of countryside one — 26,9%. Speaking about migrants--‐women, we must pay attention on indexes of duration of permanent residence in two time groups: 20--‐24 years — 70,3% by countryside and 62,5% by urban migrants, 25 years and more: by citizens — 53,8%, by countryside population — 37,3%.
-
2. Materials of population census of 1989 speak for the fact, that migration flow of the Arkhangelsk region population included 57,2% of its residents, arrived from countryside, 42,4% — arrived from urban areas. By that, in age groups before 16 years old and 16--‐29 years old a migration flow from urban settlements was more intensive than from countryside. In other age groups unit weight of migrants from countryside was higher than from urban settlements.
-
3. Study of migration behavior let us educe types of urban and countryside settlements, which were preferred by migrants while choosing their permanent place of residence. To these settlements we can take towns, which population has increased during 1926--‐1989 ten times, urban--‐type settlements, administrative centers of countryside regions, main farmsteads of kolkhozes, sovkhozes and other settlements of production purpose.
-
4. Transformation changes, happened in territorial and settlement structure of the Arkhangelsk region during the Soviet period of its history negatively influenced socio--‐economic
development of the Northern village. Countryside population escalated 1,8 times. Institute of private and settlement--‐peasant property practically was destroyed. For example, in 1940--‐1950 number of private peasant household was down by 17%, of private and uncooperated artisans by 90,1%. Place of peasant--‐owner was taken by kolkhoznik or man working in sovkhoz with its detached attitude to public property and results of his labor in socialistic form of collective economics organization. A Soviet model of local public government represented by deputy corps appeared not to be ready to solve urgent problems of local communities’ life--‐sustaining activities.
The highest index in migration activity is noticed among migrants of 1934--‐1919 years of birth and older. It was by migrants of 70 years old and more — 76,5%, in other groups — from 71,4% to 73,5%. Results of population census of 1989 let us make a conclusion on intensity of migration flows, appeared in the studied Northern region during the Soviet period of economic exploitation of its natural resources.
In a word, begun by the end of the 20s of the XXth century social rebuilding of the Northern village finished by the end of 80s with its social and moral degradation. Perspectives of its development in perception of F.A.Abramov were absolutely not magnificent. In his letter to P.A.Hudyakov on the 23rd of January 1971 he wrote: «And Russian village — forgive and adieu. In thirty years what will remain? It is evident: technical revolution in the countryside is unsuitable for the village born in feudalism. On the West it has already died away…» [1,p.458].
-
40 years has passed after overwhelming forecast of the Russian village future, which was given by F.A.Abramov in his letter. How has it borne out? So, this is the topic of another article.
References Migratory Processes in the Conditions of Transformation of Territorial and Settlement Structure in the Arkhangelsk region (1926-1989)
- Abramov F.A. Sobraniye sochineniy v shesti tomah. T.6: Zametki Povesty; Rasskazy; Putevaya proza; Pis’ma [Collected works issued in 6 volumes. Volume 6: Sketchbooks Stories; Tales; Traveller's prose; Letters]. Saint-Petersburg, «Hudozhestvennaya literatura» publ., 1995, 622 p.
- Belov V.I. Povsednevnaya zhizn’ russkogo Severa. Ocherki o byte i narodnom iskusstve krest’yan Vologodskoy, Arkhangel’skoy i Kirovskoy oblastey. Fotos’yemka A.Zabolozkogo [Daily living of the Russian North. Sketches on culture and popular art of Vologda, Arkhangelsk and Kirovsk peasants. Photographic project of A. Zabolotzky]. Moscow, 200, 391 [9] p.
- Abramov F.A. Chem zhivem-kormimsya. Otkritoye pis’mo zemlyakam [How we livewe feed. An open letter to countymen]. Sobraniye sochineniy v shesti tomah. T. 5 [Collected works issued in 6 volumes. Volume 5]. Saint-Petersburg, «Hudozhestvennaya literatura» publ., 1993, pp. 12-‐20 (in Russian).
