Mining Educational Data to Reduce Dropout Rates of Engineering Students

Author: Saurabh Pal
Journal: International Journal of Information Engineering and Electronic Business(IJIEEB) @ijieeb
Article in issue: 2 vol.4, 2012.
Free access
In the last two decades, number of Engineering Institutes and Universities grows rapidly in India. This causes a tight competition among these institutions and Universities while attracting the student to get admission in these Institutions/Universities. Most of the institutions and courses opened in Universities are in self finance mode, so all time they focused to fill all the seats of the courses not on the quality of students. Therefore a large number of students drop the course after first year. This paper presents a data mining application to generate predictive models for student's dropout management of Engineering. Given new records of incoming students, the predictive model can produce accurate prediction list identifying students who tend to need the support from the student dropout program most. The results show that the machine learning algorithm is able to establish effective predictive model from the existing student dropout data.
Educational Data Mining, Machine Learning Algorithms, Dropout Management, Predictive Models
Short address: https://sciup.org/15013115
IDR: 15013115
Text of the scientific article Mining Educational Data to Reduce Dropout Rates of Engineering Students
Published Online April 2012 in MECS
Data Mining is a technology used to describe knowledge discovery and to search for significant relationships such as patterns, association, and changes among variables in databases. The discovery of those relationships can be examined by using statistical, mathematical, artificial intelligence and machine learning techniques to enable users to extract and identify greater information and subsequent knowledge than simple query and analysis approaches.
A large number of Engineering students drop the course after first year. Based on review of the literature, various reasons were identified for the measuring ‘relative importance’ of student drop out. These reasons were then broadly grouped in to three basic categories:
-
• Personal reasons,
-
• Program/ course related reasons.
Student dropout is a challenging task in higher education [1] and it is reported that about one fourth of students dropped college after their first year [1-3]. Recent study results show that intervention programs can have significant effects on dropout, especially for the first year. To effectively utilize the limited support resources for the intervention programs, it is desirable to identify in advance students who tend to need the support most.
In this paper, we describe the experiments and the results from a data mining techniques for the students of Institute of Engineering and Technology of VBS Purvanchal University, Jaunpur to assist the student dropout program on campus. The development of machine learning algorithms in recent years has enabled a large number of successful data mining projects in various application domains in science, engineering, and business [4, 5]. In our study, we apply machine learning algorithm to analyze and extract information from existing student data to establish predictive model. The predictive model is then used to identify among new incoming first year students those who are most likely to benefit from the support of the student retention program.
The main objective of this paper is to use data mining methodologies to find students which are likely to drop out their first year of engineering. In this research, the classification task is used to evaluate previous year’sstudent dropout data and as there are many approaches that are used for data classification, the ID3, C4.5, CART and ADT decision tree methods is used here. Information like grade in High School, grade in Senior Secondary, student’s family income, parents qualification etc. were collected from the student’s management system, to predict list of students who need special attention.
The rest of this paper is organized as follows: Section 2 presents different type of decision trees for machine learning Section 3 describes background and history of educational data mining. Section 4 describes the methodology used in our experiments about applying data mining techniques on the educational data. Section 5 illustrates the results obtained. Finally we conclude this paper with a summary and an outlook for future work in Section 6.
-
II. decision tree
Decision trees are often used in classification and prediction. It is simple yet a powerful way of knowledge representation. A decision tree is a flowchart-like tree structure, where each internal node is denoted by rectangles, and leaf nodes are denoted by ovals. All internal nodes have two or more child nodes. All internal nodes contain splits, which test the value of an expression of the attributes. Arcs from an internal node to its children are labeled with distinct outcomes of the test. Each leaf node has a class label associated with it.
The decision tree classifier has two phases [4]:
-
• Growth phase or Build phase.
-
• Pruning phase.
The tree is built in the first phase by recursively splitting the training set based on local optimal criteria until all or most of the records belonging to each of the partitions bearing the same class label. The tree may overfit the data.
The pruning phase handles the problem of over fitting the data in the decision tree. The prune phase generalizes the tree by removing the noise and outliers. The accuracy of the classification increases in the pruning phase.
Pruning phase accesses only the fully grown tree. The growth phase requires multiple passes over the training data. The time needed for pruning the decision tree is very less compared to build the decision tree.
-
A. ID3 (Iterative Dichotomise 3)
This is a decision tree algorithm introduced in 1986 by Quinlan Ross [6]. It is based on Hunts algorithm. The tree is constructed in two phases. The two phases are tree building and pruning.
-
ID3 uses information gain measure to choose the splitting attribute. It only accepts categorical attributes in building a tree model. It does not give accurate result when there is noise. To remove the noise preprocessing technique has to be used.
To build decision tree, information gain is calculated for each and every attribute and select the attribute with the highest information gain to designate as a root node. Label the attribute as a root node and the possible values of the attribute are represented as arcs. Then all possible outcome instances are tested to check whether they are falling under the same class or not. If all the instances are falling under the same class, the node is represented with single class name, otherwise choose the splitting attribute to classify the instances.
Continuous attributes can be handled using the ID3 algorithm by discretizing or directly, by considering the values to find the best split point by taking a threshold on the attribute values. ID3 does not support pruning.
-
B. C4.5
This algorithm is a successor to ID3 developed by Quinlan Ross [6]. It is also based on Hunt’s algorithm.C4.5 handles both categorical and continuous attributes to build a decision tree. In order to handle continuous attributes, C4.5 splits the attribute values into two partitions based on the selected threshold such that all the values above the threshold as one child and the remaining as another child. It also handles missing attribute values. C4.5 uses Gain Ratio as an attribute selection measure to build a decision tree. It removes the biasness of information gain when there are many outcome values of an attribute.
At first, calculate the gain ratio of each attribute. The root node will be the attribute whose gain ratio is maximum. C4.5 uses pessimistic pruning to remove unnecessary branches in the decision tree to improve the accuracy of classification.
-
C. CART
CART stands for Classification And Regression Trees introduced by Breiman [6]. It is also based on Hunt’s algorithm. CART handles both categorical and continuous attributes to build a decision tree. It handles missing values.
CART uses Gini Index as an attribute selection measure to build a decision tree .Unlike ID3 and C4.5 algorithms, CART produces binary splits. Hence, it produces binary trees. Gini Index measure does not use probabilistic assumptions like ID3, C4.5. CART uses cost complexity pruning to remove the unreliable branches from the decision tree to improve the accuracy.
-
D. ADT (Alternating Decision Tree)
ADTrees were introduced by Yoav Freund and Llew Mason [7]. However, the algorithm as presented had several typographical errors. Clarifications and optimizations were later presented by Bernhard Pfahringer, Geoffrey Holmes and Richard Kirkby [8].
An alternating decision tree consists of decision nodes and prediction nodes. Decision nodes specify a predicate condition. Prediction nodes contain a single number. ADTrees always have prediction nodes as both root and leaves. An instance is classified by an ADTree by following all paths for which all decision nodes are true and summing any prediction nodes that are traversed. This is different from binary classification trees such as CART (Classification and regression tree) or C4.5 in which an instance follows only one path through the tree.
The original authors list three potential levels of interpretation for the set of attributes identified by an ADTrees:
-
• Individual nodes can be evaluated for their own predictive ability.
-
• Sets of nodes on the same path may be interpreted as having a joint effect
-
• The tree can be interpreted as a whole.
-
I II. BACKGROUND AND RELATED WORK
Tinto [2] developed the most popular model of retention studies. According to Tinto’s Model, withdrawal process depends on how students interact with the social and academic environment of the institution.
Kember [9] describes in an Open distance learning context, researchers tend to place more emphasis on the influence of external environment, such as student’s occupation and support from their family, while the concept of social integration into an Open distance learning institution’s cultural fabric, is given less weight.
Yadav, Bharadwaj and Pal [12] conducted study on retention by selecting 432 students of MCA department, using ID3, C4.5 and ADT decision tree. The result shows that ADT algorithm produce short and accurate prediction list for the student retention purpose by applying the predictive model to the records of incoming new students.
Hijazi and Naqvi [13] conducted as study on the student performance by selecting a sample of 300 students (225 males, 75 females) from a group of colleges affiliated to Punjab university of Pakistan. The hypothesis that was stated as "Student's attitude towards attendance in class, hours spent in study on daily basis after college, students' family income, students' mother's age and mother's education are significantly related with student performance" was framed. By means of simple linear regression analysis, it was found that the factors like mother’s education and student’s family income were highly correlated with the student academic performance.
Ayesha, Mustafa, Sattar and Khan [14] describe the use of k-means clustering algorithm to predict student’s learning activities. The information generated after the implementation of data mining technique may be helpful for instructor as well as for students.
Bharadwaj and Pal [15] obtained the university students data like attendance, class test, seminar and assignment marks from the students’ previous database, to predict the performance at the end of the semester.
Bray [16], in his study on private tutoring and its implications, observed that the percentage of students receiving private tutoring in India was relatively higher than in Malaysia, Singapore, Japan, China and Sri Lanka. It was also observed that there was an enhancement of academic performance with the intensity of private tutoring and this variation of intensity of private tutoring depends on the collective factor namely socio-economic conditions.
Bharadwaj and Pal [17] conducted study on the student performance based by selecting 300 students from 5 different degree college conducting BCA (Bachelor of Computer Application) course of Dr. R. M. L. Awadh University, Faizabad, India. By means of Bayesian classification method on 17 attributes, it was found that the factors like students’ grade in senior secondary exam, living location, medium of teaching, mother’s qualification, students other habit, family annual income and student’s family status were highly correlated with the student academic performance.
Quadri and Kalyankar [18] have predicted student’s academic performance using the CGPA grade system where the data set comprised of the students gender, his parental education details, his financial background etc.
Yadav, Bharadwaj and Pal [19] obtained the university students data like attendance, class test, seminar and assignment marks from the students’ database, to predict the performance at the end of the semester using three algorithms ID3, C4.5 and CART and shows that CART is the best algorithm for classification of data.
-
I V. DATA MINING PROCESS
Success percentage of an institute can be improved knowing the reasons for dropout student. A number of parameters are considered for predicting the academic outcome of a student. Prediction models that include all personal, social, psychological and other environmental variables are necessitated for the effective prediction of the performance of the students.
-
E. Data Preparations
The data set used in this paper contains engineering students information collected from the Institute of Engineering and Technology, VBS Purvanchal University, Jaunpur for a period of five years in period from 2006-07 to 2010-11. The engineering graduate student’s data set consists of 1650 record. The year wise admitted and dropout student’s records are shown in table I.
TABLE I A dmitted and dropout students
|
Session |
B.Tech I Year |
B. Tech II Year |
Dropout |
|
2006-07 |
342 |
280 |
62 |
|
2007-08 |
349 |
279 |
70 |
|
2008-09 |
331 |
255 |
76 |
|
2009-10 |
336 |
266 |
70 |
|
2010-11 |
292 |
230 |
62 |
-
F. Data selection and Transformation
In this step only those fields were selected which were required for data mining. The data was collected through the enrolment form filled by the student at the time of admission. The student enter their demographic data (category, gender etc), past performance data (SSC or 10th marks, HSC or 10 + 2 exam marks etc.), address and contact number. Most of the attributes reveal the past performance of the students. A few derived variables were selected. While some of the information for the variables was extracted from the database. All the predictor and response variables which were derived from the database are given in Table II for reference.
The domain values for some of the variables were defined for the present investigation as follows:
-
• Branch – The courses offered by VBS Purvanchal University, Jaunpur are Computer Science and Engineering ( CSE ), Information Technology ( IT ) Mechanical Engineering ( ME ), Electrical
Engineering ( EE ), Electronics and
Communication Engineering ( ECE ) and Electronics and Instrumentation Engineering ( EIE ).
-
• Cat – From ancient time Indians are divided in many categories. These factors play a direct and indirect role in the daily lives including the education of young people. Admission process in India also includes different percentage of seats reserved for different categories. In terms of social status, the Indian population is grouped into four categories: Unreserved, Other Backward Class (OBC), Scheduled Castes (SC) and Scheduled Tribes (ST). Possible values are Unreserved, OBC, SC and ST .
-
• HSG - Students grade in High School education. Students who are in state board appear for six subjects each carry 100 marks. Grade are assigned to all students using following mapping O – 90% to 100%, A – 80% - 89%, B – 70% - 79%, C – 60% - 69%, D – 50% - 59%, E – 40% - 49%, and F - < 40%.
-
• SSG - Students grade in Senior Secondary education. Students who are in state board appear for five subjects each carry 100 marks. Grade are assigned to all students using following mapping O – 90% to 100%, A – 80% - 89%, B – 70% -79%, C – 60% - 69%, D – 50% - 59%, E – 40% -49%, and F - < 40%.
TABLE III: student related variables
|
Variables |
Description |
Possible Values |
|
Branch |
Students Branch |
{CS, IT, ME,EE, ECE, EIE} |
|
Sex |
Students Sex |
{Male, Female} |
|
Cat |
Students category |
{Unreserved, OBC, SC, ST} |
|
HSG |
Students grade in High School |
{O – 90% -100%, A – 80% - 89%, B – 70% - 79%, C – 60% - 69%, D – 50% - 59%, E – 40% - 49%, F - < 40%} |
|
SSG |
Students grade in Senior Secondary |
{O – 90% -100%, A – 80% - 89%, B – 70% - 79%, C – 60% - 69%, D – 50% - 59%, E – 40% - 49%, F - < 40% } |
|
Atype |
Admission Type |
{UPSEE, Direct} |
|
Med |
Medium of Teaching |
{Hindi, English} |
|
LLoc |
Living Location of Student |
{Village, Town, Tahseel, District} |
|
FAIn |
Family annual income status |
{BPL, poor, medium, high} |
|
FQual |
Fathers qualification |
{no-education, elementary, secondary, UG, PG, Ph.D., NA} |
|
MQual |
Mother’s Qualification |
{no-education, elementary, secondary, UG, PG, Ph.D., NA} |
|
FOcc |
Father’s Occupation |
{Service, Business, Agriculture, Retired, NA} |
|
MOcc |
Mother’s Occupation |
{House-wife (HW), Service, Retired, NA} |
|
Dropout |
Dropout: Continue to enroll or not after one year |
{Yes, No} |
-
• Atype - The admission type which may be through Uttar Pradesh State Entrance Examination ( UPSEE ) or Direct admission through University procedure.
-
• Med – This paper study covers only the colleges of Uttar Pradesh state of India. Here, medium of instructions are Hindi or English .
-
• Dropout – Dropout condition. Whether the student continues or not after one year. Possible values are Yes if student continues study and No if student dropped the study after one year.
-
G. Implementation of Mining Model
WEKA toolkit [20] is a widely used toolkit for machine learning and data mining originally developed at the University of Waikato in New Zealand. It contains a large collection of state-of-the-art machine learning and data mining algorithms written in Java. WEKA contains tools for regression, classification, clustering, association rules, visualization, and data pre-processing. WEKA has become very popular with academic and industrial researchers, and is also widely used for teaching purposes.
To use WEKA, the collected data need to be prepared and converted to (arff) file format to be compatible with the WEKA data mining toolkit.
-
H. Results and Discussion
Four classification techniques have been applied on the dataset on hand to build the classification model. The techniques are: the ID3 decision tree algorithm, the C4.5, CART decision tree algorithm and the alternative decision tree (ADT) algorithm.
After applying the preprocessing and preparation methods, we try to analyze the data visually and figure out the distribution of values. Figure 1 depicts the distribution of values of students in period from 200607 to 2010-11.
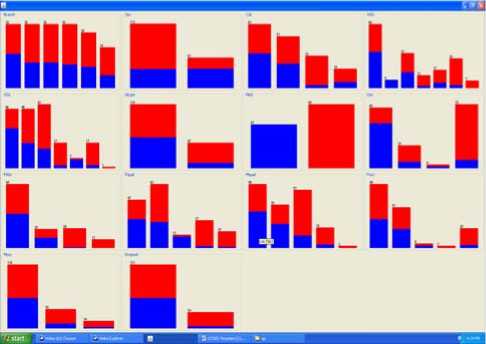
Figure 1: Visualization of the Students Categorization.
The Table III shows the accuracy percentages for each ID3, C4.5, CART and ADT decision tree algorithms for classification applied on the above data sets using 10-fold cross validation is observed as follows:
T able III: ACCURACY PERCENTAGES FOR DROPOUT
|
Algorithm |
Correctly Classified Instances |
Incorrectly Classified Instances |
|
ID3 |
90.9091 % |
3.6364% |
|
C4.5 |
89.0909% |
10.9091% |
|
CART |
86.0606% |
13.9394% |
|
ADT |
87.2727% |
12.7273% |
The tree generated by ID3 algorithm was very deep, since it started by attribute HSG, which has 7 values.
The HSG has the maximum gain ratio, which made it the starting node and most effective attribute. Other attributes participated in the decision tree were SSG, LLoc, Mocc, Branch, Sex, FAIn and Cat. Other attributes such as: Atype, FQual, MQual, FOcc and Medium appeared in other parts of the decision tree.
The ID3 tree indicated that all these attributes have some sort of effect on the dropout of student, but the most affective attributes were: HSG, SSG and LLoc. Other hints could be extracted from the tree indicates that the students with HSG = ‘O’ or ‘A’ are continue their study. Wherever Sex is taken into consideration, Male students have greater possibility of discontinuation of study than Female.
The tree generated using the C4.5 algorithm also indicated that the HSG attribute is the most affective attribute. The generated C4.5 tree is shown in figure 2.
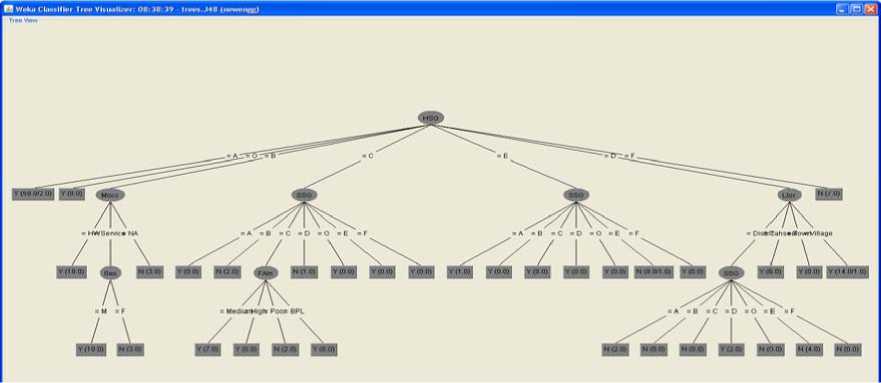
Figure 2. A decision tree generated by C4.5 algorithm
The tree generated by CART algorithm started by attribute SSG. The SSG is the starting node and most effective attribute. Other attributes participated in the decision tree were HSG, Cat, FAIn and FOcc, MOcc. Other attributes such as: Atype, FQual, MQual, Sex and Medium not appeared in the decision tree.
The CART tree indicates that the most affective attributes were: SSG, HSG and Cat. Other hints could be extracted from the tree indicates that the students with SSG = ‘E’ or ‘F’ are discontinue their study. Wherever Cat is taken into consideration, unreserved students have less possibility of discontinuation of study than other category.
The alternative decision tree (ADT) learning algorithm is shown in fig. 3, we may have multiple paths from the root to the leaves that are consistent with data and we need to sum up all the numbers appearing on these paths to see whether it is positive or negative. ADTree decision trees also provide interesting insights into hidden patterns in the student dropout data set. For example, the ADT tree decision tree shows that SSG and HSG are very relevant factor.
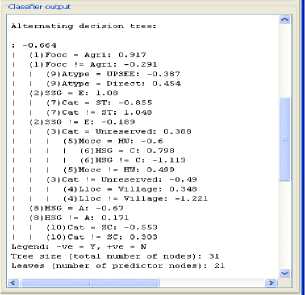
Figure 3:ADT Decision Tree
Table IV below shows the four machine learning algorithms that produce predictive models with the best precision values for dropout students in our experiments. For these algorithms, the best precision values (ranging from around 67.7% to 85.7%) are almost all accomplished when learning from the data set.
T able IV: C lassifiers A ccuracy
|
Algorithm |
Precision values for Dropout students |
|
ID3 |
85.7% |
|
C4.5 |
80.8% |
|
CART |
67.7% |
|
ADT |
72.4% |
-
V. Conclusions
Frequently used decision tree classifiers are studied and the experiments are conducted to find the best classifier for retention data to predict the student’s drop-out possibility.
On working on dropout students, many attributes have been tested, and some of them are found effective on the prediction. The HSG was the strongest attribute, then the SSG, with slight effect of FAIn (Family Annual Income) and MOcc (Mother’s Occupation).
The Medium attribute did not show any clear effect while the Category and Sex have shown some effect in some of the experiments for predicting the dropout students.
Machine learning algorithms such as the ID3 learning algorithm can learn effective predictive models from the student dropout data accumulated from the previous years, because the precision value for dropout student is highest 85.7%. The empirical results show that we can produce short but accurate prediction list for the student dropout purpose by applying the predictive models to the records of incoming new students. This study will also work to identify those students which needed special attention to reduce drop-out rate.
References Mining Educational Data to Reduce Dropout Rates of Engineering Students
- Tinto, V., "Research and practice of student retention: What next, College Student Retention: Research", Theory, and Practice, 8(1), pp. 1-20, 2006.
- Tinto, V., "Leaving College: Rethinking the cause and cure of student attrition". Chicago: University of Chicago Press, 1993.
- Tinto, V., "Dropout from Higher Education: A theatrical synthesis of recent research". Review of Education Research, 45, 89-125, 1975.
- J. Han and M. Kamber, "Data Mining: Concepts and Techniques," Morgan Kaufmann, 2000.
- Witten, I. H., Frank, E., Hall, M. A., "Data Mining: Practical Machine Learning Tools and Techniques", 3rd Ed. Morgan Kaufmann, 2011.
- J. R. Quinlan, "Introduction of decision tree", Journal of Machine learning", pp. 81-106, 1986.
- Yoav Freund and Llew Mason, "The Alternating Decision Tree Algorithm". Proceedings of the 16th International Conference on Machine Learning, pp. 124-133, 1999.
- Bernhard Pfahringer, Geoffrey Holmes and Richard Kirkby. "Optimizing the Induction of Alternating Decision Trees". Proceedings of the Fifth Pacific-Asia Conference on Advances in Knowledge Discovery and Data Mining, pp. 477-487, 2001.
- Kember, D., "Open Learning Courses for Adults: A model of student progress". Englewood Cliffs, NJ.: Educational Technology Publications, 1995.
- Ashby, A., "Monitoring Student Retention in the Open University: Detritions, measurement, interpretation and action". Open Learning, 19(1), pp. 65-78, 2004.
- Kennedy, D., & Powell, R., "Student progress and withdrawal in the Open University". Teaching at a Distance, 7, pp. 61-78, 1976.
- S. K. Yadav, B.K. Bharadwaj and S. Pal, "Mining Educational Data to Predict Student's Retention :A Comparative Study", International Journal of Computer Science and Information Security (IJCSIS), Vol. 10, No. 2, 2012
- S. T. Hijazi, and R. S. M. M. Naqvi, "Factors affecting student's performance: A Case of Private Colleges", Bangladesh e-Journal of Sociology, Vol. 3, No. 1, 2006.
- Shaeela Ayesha, Tasleem Mustafa, Ahsan Raza Sattar, M. Inayat Khan, "Data mining model for higher education system", Europen Journal of Scientific Research, Vol.43, No.1, pp.24-29, 2010.
- B.K. Bharadwaj and S. Pal. "Mining Educational Data to Analyze Students' Performance", International Journal of Advance Computer Science and Applications (IJACSA), Vol. 2, No. 6, pp. 63-69, 2011.
- M. Bray, The shadow education system: private tutoring and its implications for planners, (2nd ed.), UNESCO, PARIS, France, 2007.
- B.K. Bharadwaj and S. Pal. "Data Mining: A prediction for performance improvement using classification", International Journal of Computer Science and Information Security (IJCSIS), Vol. 9, No. 4, pp. 136-140, 2011.
- M. N. Quadri1 and Dr. N.V. Kalyanka, "Drop Out Feature of Student Data for Academic Performance Using Decision Tree", Global Journal of Computer Science and Technology Vol. 10 Issue 2 (Ver 1.0), April 2010.
- S. K. Yadav, B.K. Bharadwaj and S. Pal, "Data Mining Applications: A comparative study for Predicting Student's Performance", International Journal of Innovative Technology and Creative Engineering (IJITCE), Vol. 1, No. 12, pp. 13-19, 2011.
- Witten I. Frank E., and Hall M. "Data Mining: Practical Machine Learning Tools and Techniques", 3rd Edition, Morgan Kaufmann Publishers, 2011
