Mitigating the Impact of IoT Routing Attacks on Power Consumption in IoT Healthcare Environment using Convolutional Neural Network

Author: Samah Osama M. Kamel, Sanaa Abou Elhamayed
Journal: International Journal of Computer Network and Information Security @ijcnis
Article in issue: 4 vol.12, 2020.
Free access
IoT provides big contribution to healthcare for elderly care at home. There are many attacks in IoT healthcare network which may destroy the entire network. A propose a framework may be produced an efficient treatment for elderly care at home with low power consumption. A framework contains three phases names; medical data collection layer, routing and network layer and medical application layer. It intends to increase security performance through prediction and detection attacks in real time. Cooja simulator is used for generating real-time IoT routing datasets including normal and malicious motes based on different types of power. The generated IoT routing dataset using data augmentation (SMOTE) to increase the size of dataset. The preprocessing of the generating dataset using three methods of feature selection which are weight by rule, Chi-Squared and weight by tree importance using random forest reduce noise and over-fitting. A proposed model uses convolution neural network (CNN) to detect and predict IoT routing attacks to identify suspicious network traffic. A number of studies have been carried out in this area, but the issue of the extent of the impact of attacks on energy consumption is an interesting topic. Attacks can affect the network completely, in particular on the power consumption of smart devices. Therefore; the main target of this research is detecting and predicting different types of IoT routing attacks which have impact on power consumption and destroy the entire network. This work analyzes the impact of IoT routing attacks on different power consumption using CNN to achieve low power consumption by detecting different types of routing attacks. The experimental results show CNN can detect different types of attacks that have a bad impact on power consumption. It achieves high accuracy, precision, recall, correlation and low rate in error and logistic loss and this leads to decrease power consumption.
IoT, Healthcare, RPL Protocol, SMOTE, Convolutional Neural Network
Short address: https://sciup.org/15017212
IDR: 15017212 | DOI: 10.5815/ijcnis.2020.04.02
Text of the scientific article Mitigating the Impact of IoT Routing Attacks on Power Consumption in IoT Healthcare Environment using Convolutional Neural Network
Published Online August 2020 in MECS DOI: 10.5815/ijcnis.2020.04.02
The Internet of Things (IoT) is the most important element of the communication and information technology revolution. IoT reflects the significant role for connecting smart objects anytime, anyplace and any services through any network. The entire world looks forward to creating a new smart world to develop people's life and all work fields. IoT provides an extreme contribution in healthcare and medical devices to present a comfortable and healthy life for patients. Medical solutions provide different applications for patients and medical staff such as monitoring patients, collecting patient data, remote and real-time monitoring of patient care, fitness programs, chronic and non-chronic diseases and automated treatment and medication for elderly care at home. These solutions motivate us to achieve a healthy life and an efficient outcome in medical projects. Therefore; the IoT network provides generated dataset that is generated from smart sensors, actuators, wearable devices, RFID, smart cellular phone, transmission mediums, and interface applications. The generated data can be processed, analyzed and transmitted through a network. There are many IoT disadvantages that are represented the privacy of patient and security breaches. IoT environment exposed to many types of attacks. This topic is a very critical subject because it should secure connected smart devices, transmitted data, transmission medium and application servers. The structure of IoT healthcare contains three major elements named topology, architecture and platform. The topology is responsible for management among various smart objects to draw the scenarios of IoT healthcare environment and activities. Regarding architecture, it is the key element of the IoT healthcare network which is used to set the specification and functions of physical objects to transmit the medical information. Medical sensors and wearable devices use IPv6 and 6LoWPAN protocol to transmit medical data over the 802.154 protocol. The platform provides web and mobile applications to access medical data and support the medical community [1]. Therefore; the main layer in the IoT healthcare network is the network layer which can connect various smart devices to exchange and transmit data over IEEE 802.15 protocol using IPv6. IPv6 protocol plays an important role in the network layer because it is responsible for the connection between smart objects through IPv6 over Low-Power Wireless Personal Area Networks (6LoWPAN) [13]. Therefore; the routing process is a very important part of the structure of the IoT healthcare network which is based on Low Power and Lossy Networks (LLNs) named RPL. The Routing Protocol for Low-Power and Lossy Networks (RPL) protocol is used to build a network over constrained nodes that have limited power and memory [14]. RPL protocol is considered as attractive land for a large number of various attacks. The common RPL attacks are selective forward attacks, sinkhole attacks, Sybil attacks, wormhole attacks, blackhole attacks, hello flooding attacks, version attacks, eavesdropping and increased and decreased rank attacks. These attacks cause the exhausting of network resources such as power and memory.
There are many different attacks that consume different types of power consumption of smart devices. This leads to destroy the IoT environment. The different attacks damage the security requirements and impact on different types of power consumption. The main goal of this research is detecting IoT routing attacks that affect on the power consumtion of smart devices. The Plan of this research is summarized as follows:
• A framework of proposed model architecture is proposed for the automated treatment and medication for elderly care at home to introduce low cost, low power consumption, and achievement a convenient level of security requirements.
• Creation an environment of Healthcare IoT nodes includes normal and malicious nodes.
• Generating Real-time routing dataset (normal and malicious) using Cooja Simulation.
• Data augmentation is used to increase IoT routing dataset size to produce a robust model.
• Implementing data pre-processing and feature selection to reduce noise and over-fitting in the learning algorithm.
• Detecting IoT routing attacks using dynamic algorithm convolutional neural network to identify suspicious network traffic based on the healthcare IoT routing protocol.
• Explain the influence of different types of attacks on power consumption in healthcare IoT using generated IoT routing dataset. In addition; analyze the impact of IoT routing attacks on different power consumption using CNN to achieve low power consumption. The main reason of using CNN is that it is more flexible algorithm and introduces high accuracy.
2. Related Work
But the time of the training process takes a lot of time so we need a good GPU. Addition to; CNN requires a large Dataset to process and train the neural network and this paper presents a solution of this problem using SMOTE technique.
The organization of this research work will be as follows: section 2 presents some of the previous work, while section 3 presents the framework overview. Section 4 presents A Technical Proposed Model Approach. Section 5 discusses the learning model. Section 6 the implementation work and discussion of results while section 9 concludes the whole work.
There are several types of research in prediction and prevention of attacks in the network layer especially RPL attacks to protect the IoT system which are briefly mentioned as follows:
-
[16] the authors discussed a deep neural network model which is used to classify attacks in IoT network using three datasets that are UNSW-NB15, CIDDS-001, and GPRS in wireless and wired networks. The idea of this work was built on anomaly detection to detect different attacks. The model of this work used a deep neural network which is combined with the grid search to get the set of best parameters for each dataset. The authors used three validation methods such as cross-validation, repeated cross-validation and subsampling to reduce the variability of the datasets. Finally, the authors compared and evaluated the performance metrics which are accuracy, precision, recall and false alarm rate after applying the three validation methods. This research achieved high accuracy of about 94 %.
-
[17] the authors intended to identify many attack models of IoT which are used for security techniques. This paper has shown different attack models to identify security methods to achieve IoT security requirements. The authors tried to find machine learning models for IoT authentication, access control, malware detection and offloading to protect the IoT network. This paper discussed different many challenges to implement these models and is useful to detectin many types of attacks that impact on learning speed, decrease the risks of choosing bad defense policies. This study clarified that ML techniques with low computation and communication overhead should be inspected to improve security for IoT
systems. In addition, ML techniques provide authoritative and secure IoT services.
-
[18] the authors investigated a deep learning-based machine learning method for the detection of routing attacks for IoT. This work was implemented using the Cooja IoT simulator to generate routing data and attack data that were ranging from 10 to 1000 nodes. The idea of this work was based on a deep-learning-based attack detection methodology to detect IoT routing attacks. The authors used normal nodes and malicious nodes that are decreased rank, hello-flood and version attack in real IoT network. The authors used a combination of random forests, histograms, and pearson correlation coefficient for the feature selection process to increase the performance rate. The generated dataset was compared with UNSW-NB15 and KDDCUP99. The experimental results demonstrated that this model achieved F-Score and AUC 99 %. This research is helpful to create the IoT environment with normal and malicious motes to detect IoT routing attacks w.r.t. time
-
[19] the authors presented a smart trust management method, based on machine learning and an elastic slide window technique to assess the IoT resource trust. This method is used to differentiate broken nodes among misbehaving devices. This work was built on real-world data to identify On-Of attackers and fault nodes with a precision that up to 96% and low time consumption. This study achieved 95% faster in OA identification with comparison to other researches in trust management. This paper had shown different types of attacks and introduced a method to improve security in IoT by identification of On-Of trust attacks.
-
[20] the authors investigated a new Secure RPL (SRPL) protocol to prevent malicious nodes that may create forge topology. The idea of new secure RPL (SRPL) protocol is based on rank threshold and hash chain authentication that limits the decreased and increased rank thresholds to prevent the internal attacks which manipulate RPL metrics. This new protocol protected the network effectively but this protocol may not prevent some types of attacks which have different setting and rank.
-
[21] the authors investigated an ensemble intrusion detection technique to detect and reduce malicious events and vulnerabilities in Domain Name System (DNS), HyperText Transfer Protocol (HTTP) and Message Queue Telemetry Transport (MQTT). This ensemble had performed using three classification techniques named Decision Tree (DT), Naive Bayes (NB) and Artificial Neural Network (ANN). The authors used UNSW-NB15 and NIMS botnet datasets. This paper performed a correlation coefficient feature selection method to select the best features and get rid of the weak features to increase performance. The proposed model used performance metrics that are accuracy, Detection Rate (DR), False Positive Rate (FPR) and ROC curves to evaluate the proposed ensemble. The experiments were based on the comparison of three machine learning and the proposed ensemble model. The ensemble model achieved a high-performance rate using the UNSW-NB15 dataset and NIMS botnet datasets. The performance metrics using the UNSW-NB15 dataset are accuracy (AC) was around 99.54 %, detection rate (DR) 98.93 % and FPR 1.38 %. The performance metrics using NIMS botnet datasets were accuracy (AC) 98.29 % detection rate (DR) 97.38 % and FPR 2.01 %. This research presented different dataset and select the most significant feature to obtain high performance metrics.
-
[22] the authors presented an anomaly detection system based on collecting data from network traffic in Ad hoc On-Demand Distance Vector (AODV) to detect abnormal behavior nodes. This detection mechanism is based on Self Organizing Maps (SOM) to extract more information about the behavior of the network traffic and protocol. The experimental results had shown a high detection rate and low false alarm rate.
-
[23] the authors proposed a compression header analyzer intrusion detection system (CHA-IDS) analyses 6LoWPAN compression header data to detect routing attacks. This paper had been implemented in three steps. The first step was generating data of network traffic using the Cooja simulator. The second was usage feature selection method best first search approach to select the most important features. The third was testing this dataset using six machine learning algorithms to get the best performance metrics. The authors used three types of attacks which were hello flood, sinkhole, and wormhole. The results were compared according to the accuracy of detection, energy overhead, and memory consumption. This work achieved the best performance rate consumed by low energy overhead and memory.
-
[24] the authors have used a distributed deep learning-based IoT/Fog network attack detection system to detect IoT attacks in the distributed architecture of IoT applications. The dataset NSL-KDD traffic distribution was used in this work. The results of the experiment of a distributed attack detection system using deep learning have shown that the performance metrics such as accuracy, detection rate, false alarm rate, F1 measure, recall, and precision is better than the model using traditional machine learning algorithms such as SVM, decision trees and other neural networks. The overall accuracy of the proposed model using deep learning increased from around 96% to over 99%. This research is more useful to detecting IoT attacks the distributed architecture of IoT applications with high accuracy.
-
[25] the authors proposed a centralized intrusion detection scheme based on Support Vector Machines (SVMs) and sliding windows. The proposed model can detect black hole attacks and selective forwarding attacks with high accuracy (100 % and 85 % respectively) without exhaust the energy of network nodes. This work was based on two different types of attacks named black hole attacks and selective forwarding attacks. The selective forwarding attacks affect on power consumption of smart devices of IoT.
-
[26] the authors proposed a trust-based intrusion detection system based on RPL to detect new mobile Sybil attacks named SybM through implementation and evaluation of the performance of RPL routing protocol concerning control overhead, packet delivery, and energy consumption. The experiment results illustrated that the RPL routing protocol is
sensitive to SybM attacks. To solve this problem, the authors introduced a Trust-based IDS solution to handle identity, mobility, and control messages multicast issues.
[27] the authors introduced a proposed model named a novel intrusion detection system for the IoT to detect Wormhole attack with two kind packet relay and encapsulation with low overhead and high true positive detection rate. This proposed model used the location information of node and neighbor information to differentiate the Wormhole attack and received signal strength to detect and may prevent attacker nodes. The experimental results had shown that the proposed model achieved low power consumption. It was useful for saving network resources. The detection rate was 94%.
[28] the authors discussed the RPL topology attacks by breaking node operations to introduce two new attacks of this type named rank and local repair attack. This work proposed a specification-based ID with finite state machine design to prevent threats. The concept of this proposed model was to build manually an abstract of the normal network operation and detect malicious behaviors. This proposed model aimed to protect the routing operation attacks. In this work, the architecture of a monitoring system was designed to collect and analyze more information RPL routing topology with reasonable overhead.
[29] the authors investigated a neural network-based approach for intrusion detection on IoT network to classify DDoS/DOS patterns and normal patterns. The experimental results of the ANN model achieved over 99% accuracy and low false-positive rates.
[30] the authors proposed a testing framework for learning-based IoT traffic detection systems (TLTD). The used benchmark dataset was KDD99 which was pre-processed using a zero-mean normalization method to obtain an increase performance rate. The authors used genetic algorithms and some technical improvements to detect abnormal patterns. The work achieved high accuracy to detect abnormal behaviour of IoT traffic and the performance metrics of the experimental results were near 100 %.
3. Framework Overview
A framework of proposed model architecture is built on the idea of the automated treatment and medication for elderly care at home to improve services that are provided by healthcare organizations. At the same time, healthcare organizations present low-cost treatment and achieve a level of information security. This study explains the impact of different types of attacks on the power consumption of the IoT healthcare network.
The IoT healthcare network contains smart medical sensors and other smart devices. The generated dataset is created from smart medical sensors such as brain activity, blood pressure, and others. All smart devices record all information and daily activities about an elderly patient to be available to doctors to follow a patient case. Information is transferred to staff members who are following the elderly patient. So the healthcare IoT system provides integrated healthcare devices for an elder in their homes. Consequently; a doctor can simply follow and monitor patients' cases from any place and anytime. The generated and collected data is exposed to different threats and attacks. Attacks can manage, control and damage different smart devices. These attacks can consume the power of sensors and control or damage the entire healthcare IoT network. Subsequently, network attacks can cause significant loss of information.
So this work concentrated on the simulation real-time IoT routing attacks with different scenarios of attacks and their influences on the power consumption of sensors. From this point; we proposed model architecture to facilitate the routing process of the IoT network to detect and predict different types of attacks which have a bad effect on the power consumption of sensors.
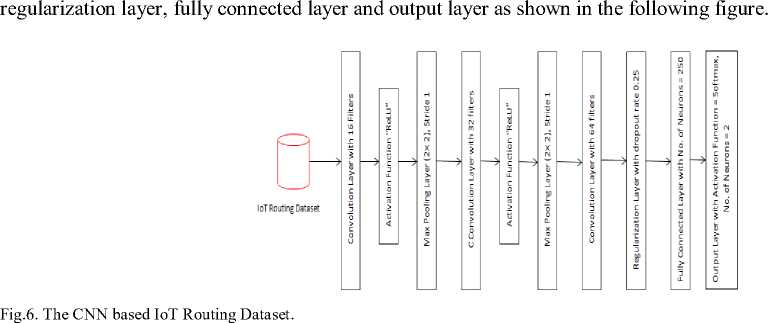
This proposed model helps us to increase awareness of security and power consumption. The structure of the framework consists of three main layers; named the medical data collection layer, routing, and network layer and medical application layer as shown in figure 1.
Figure 1 expain the process of the framework. The first stage is the medical data collection layer, it divided into three phases; data collection, data analysis, and data monitoring. The medical data collection phase is the first phase that contains the collected data from different devices such as sensors, cellular phone, and camera. The second phase is data analysis that is used to analyze every event and activates of an elderly patient. The output is processed and stored in a secure server. The data monitoring phase includes remote monitoring healthcare data, automatic record patient data such as the status of a patient and medical history.
The second stage is routing and network layer, this layer receives all information from the medical data collection layer and transmits data to the medical application layer through transmission mediums such as Wi-Fi, Bluetooth, WiMAX, ZigBee, GSM, 3G, and 4G using communication protocols. This layer is responsible for processing, management, and maintenance of healthcare data. As we mentioned above, the network layer transmits data over the RPL routing protocol. We have generated data by real-life environment simulation using the open-source Contiki-Cooja. The simulator Cooja builds different IoT network communication using the RPL protocol. So it produces a realtime network routing dataset with 5577 nodes including normal and malicious (attacks). The malicious nodes contain five types of attacks that are selective forward attack, sinkhole attack, version attack, wormhole attack and hello flooding attack. These types of attacks increase different types of power such as CPU Power, LPM Power, Listen to Power and Transmit Power.
The routing layer is the main layer in our work because the proposed model is based on real-time traffic of the core network. This layer exposes to many attacks and can be detected using an artificial intelligence awareness system to obtain a high degree of accuracy. For this reason; the most important part of the framework is the routing server management which is divided into two phases namely; feature selection and detection and prediction phases. The feature selection phase is used for pre-processing to select the effective features in the routing dataset to avoid noise, irrelevant and over-fitting to improve performance. The second phase is detection and prediction to classify the routing dataset into normal and malicious nodes [18]. Therefore, the proposed model is based on a deep learning approach to detect and predict diverse attacks that impact on power consumption of different smart devices.
The proposed model can detect each packet from each node. If the record is normal, it will be passed to the gateway server. If the record is malicious, it will be rejected. The network routing traffic is passed through gateway server and then a web platform that is can be web application or mobile. The information about an elderly patient is transferred to medical staff through SMS Modem.
As regards the medical application layer, it contains all information about the status of patients and it includes medical resources, medical care, and diagnosis staff.
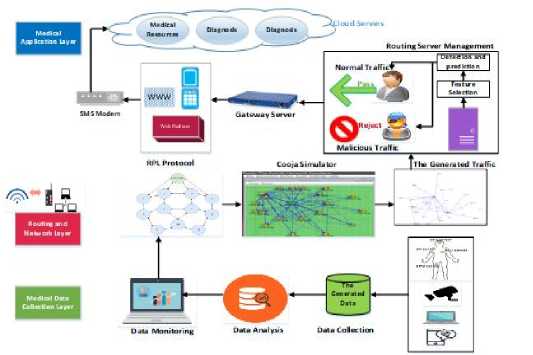
Fig.1. Methodology Flow Diagram of Framework.
4. A Technical Proposed Model Approach
The proposed model is based on the cooja simulator is used to generate many nodes including normal and malicious nodes. Many malicious nodes have a bad effect on power consumption therefore it should be analyzed and detected different types of routing attacks. This section will provide deep insight with a more detailed description of the techniques proposed model approach about simulation environment, network design setup and parameters, IoT routing attacks simulation, data pre-processing and feature selection and learning model.
-
4.1. Simulation Environment
-
4.2. Network Design Setup and Parameters
Cooja can run real RPL code on the simulated nodes. The simulator is based on 5000 motes but the simulation generated a testbed of 5577 motes (nodes) including normal and malicious motes. There are different motes such as sink motes, leaf motes, and malicious motes. The sink mote will act as the DODAG router of the network where leaf nodes will send their collected data. The number of sink motes will be one mote. The leaf motes will operate as data collectors that any leaf mote will send its data to its parent until data arrive at the sink node. The number of leaf motes in this experiment is 4465 motes. The number of malicious motes is 1156 motes which include many attacks such as a selective forward attack, sinkhole attack, version attack, wormhole attack and hello flooding attack. As we mentioned above, the simulation experiment scenario generated 5577 motes including normal (sink) and malicious motes using the Cooja simulator. Table 1 shows the Cooja simulator.
The experiment has conducted a simulation of the IoT network by running real sensor code in the Cooja simulator for Contiki3.0 OS. Cooja simulator is run C programming language. The experiment has performed using a virtual machine (workstation 15) with 16 GB RAM and an operating system 64-bit Ubuntu (Ubuntu 16).
The Cooja simulator creates a real environment of IoT that consists of many of sensors (normal and malicious), physical layer, network layer, transport layer, radio medium, transmission range and the position of sensors.
Table 1. The Simulation Parameters
|
Parameters |
Value |
|
Simulator |
Cooja - for Contiki3.0 |
|
Physical layer |
IEEE 802.15.4 |
|
Network layer |
RPL- IPV6 |
|
Transport layer |
UDP |
|
Motes |
Sink motes – Malicious motes |
|
No. of sink motes |
4465 |
|
No. of malicious motes |
1156 |
|
Radio Medium |
Unit Disk Graph Medium - Distance Loss (UDGM) |
|
Transmission range |
200×200 m |
|
Random seed |
123,456 |
|
Positioning |
Random |
The Cooja simulator generates many motes (4465 sink motes and 1156 malicious) in transmission range 200*200 m. The position of all motes is random. We implemented different network topologies for simulating IoT routing attacks with different scenarios using the Cooja network simulation as shown in Figures 2 and 3.
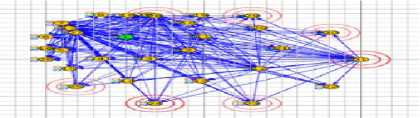
Fig.2. Network Simulation without Attacks.
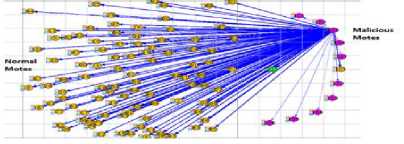
Fig.3. Network Simulation with Attacks.
-
4.3. IoT Routing Attacks Simulation
-
4.4. Data Pre-processing and Feature Selection
After the simulation has started, the IoT routing dataset has generated including normal and malicious nodes. The generated routing dataset contains approximately 5621 instances and 21 features. The generated features are Node, Received, Dups, Lost, Hops, Rtmetric, ETX, Churn, Beacon Interval, CPU Power, LPM Power, Listen Power, Transmit Power, Power, On-Time, Listen Duty Cycle, Transmit Duty Cycle, Avg. Inter Packet, Min Inter Packet, Max Inter Packet, and Class. It was obvious that the scenarios of different malicious nodes initiated to obtain all the packet of
neighbor nodes (normal nodes) in the network. The generated routing dataset consists of 4465 normal motes and 1156 malicious motes inclusive (147 hello flooding attacks, 321 selective forward attacks, 135 sinkhole attacks, 117 wormhole attacks, and 392 version attacks). It is necessary to sort the generated IoT routing dataset by simulation power such as CPU power, LPM power, Listen power, the total power and ETX. The main aim of this evaluation will be based on an analysis of different types of malicious nodes that may affect power consumption.
One of the main targets of this paper is building different scenarios of IoT routing attacks that affect power consumption. The proposed model implemented five different attack scenarios that are selective forward attack, sinkhole attack, version attack, wormhole attack and hello flooding attack as shown in the following table [51,18,52].
Table 2. The Discribtion of IoT Routing Attacks
|
Attack |
Description |
|
selective forward attack |
Malicious nodes forward all RPL packets to disrupt routing paths and drop the rest of the data traffic packets. Those malicious nodes may remain attractive to their neighbor nodes by the continuity of forwarding the control packets. |
|
sinkhole attacks |
Malicious node tries to make it attractive to neighbor nodes to route traffic through it instead of a legitimate node. This type of attack is not important to damage the network but when it combines with a selective forwarding attack it will influence the disruption of a network. |
|
version attack |
It occurs when a malicious node announces a higher version number of a DODAG tree. Nodes in the network receive DIO messages with the new number version. Then these nodes start the new structure of the DODAG tree to make network topology inefficiency. It can be implemented using the code in RPL files such as rpl_icmp6.c in the Cooja simulator by changing the DAG version to force mote to send DIO messages with a higher dag version. |
|
wormhole attack |
It consists of two external malicious nodes to create a connection between each other. And they forward packet to be faster than legitimate paths to make themselves more attractive to their neighbor nodes (victims). The target of this attack is to control the routing traffic flow. |
-
A. Data Pre-processing
The most significant advantage of deep learning is that it is a flexible method with variable data. But the obtained dataset after the simulation is small and variable so it is not adequate for deep learning because deep learning algorithm has been implemented in the best way with large size of dataset size. So it is a big obstacle to implement deep learning using the small size of the dataset. To solve this problem, data augmentation is used to increase dataset size to enhance the dataset by increasing the number of instances to produce a robust model and prevent over-fitting. The most common method is Synthetic Minority Over-Sampling Technique (SMOTE) which generates pseudo instances in the minority class by creating synthetic instances rather than by duplication instances. "Synthetic records are generated in feature space by taking each minority class sample and introducing synthetic instances along the line segments link any/all of the minority class nearest neighbors" [53]. The selection of the nearest neighbors is random.
Weka simulator Ver. 3.9 (open sources) is used to apply SMOTE technique. There are 4465 normal motes in the majority class and 1156 malicious motes in the minority class which include 147 hello flooding attacks, 321 selective forward attacks, 135sinkhole attacks, 117 wormholes attacks, and 392 version attacks. Figure 4 shows the number of instances in each class in the generated routing dataset distribution.
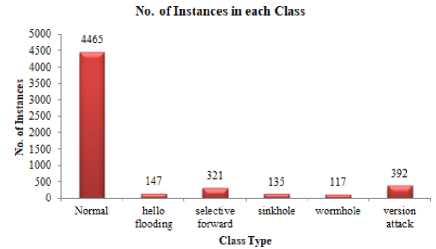
Fig.4. No. of Instances in Each class.
The experiment starts with ten nearest neighbors, a random seed is 2000 and the percentage of oversampling will specify according to the required boost of instances number. This experiment will repeat with different oversampling rate to increase the size of the generated routing dataset. The process can be explained as the following steps [53]:
SMOTE Process
Function
-
• Define the number sample of the minority class sample from 1-i
-
• Compute the number of nearest neighbor (1-k)
Process
-
1. Take the difference between a sample of the minority class and nearest neighbor
-
2. Choose the random number between 0 and 1
-
3. Multiply the result of step 3 by the random number (0-1)
-
4. Add the previous result to sample of minority class
-
5. Generate new synthetic along the line segment of its nearest neighbor
-
6. Repeat these steps with the nearest neighbor
End the function
Where (i) is a number of samples of the minority class, k is the number of the nearest neighbor.
Five experiments are using different oversampling rates 100%, 200%, 300%, 400%, and 500%. Every experiment will repeat four times to increase the size of the generated dataset. The wormhole class is the minority group with comparison to the other classes which are hello flooding, selective forward, sinkhole and version attacks. Consequently, after the first experiment has implemented using oversampling 100%, the wormhole class increased from 117 to 468
instances. The result of the first experiment has shown that the hello flooding and sinkhole classes became lower than the other classes. So the second experiment has applied to the result of the previous experiment. This experiment has performed using an oversampling rate of 200% to increase the minority classes that are hello flooding and sinkhole. It is apparent from the second experiment that the instances number of hello flooding and sinkhole increased from 147 to 588 instances and from 135 to 540 instances respectively. The results of the previous experiment have illustrated that selective forward class became the lowest class. Therefore, it is more important to implement the third experiment with an oversampling rate of 300%. Then the selective forward class increased from 312 to 1560 instances. Distinctly, the third experiment revealed that the number of instances in the selective forward class became bigger than the others. Subsequently, it is more important to complete the rest of the experiments. In the fourth experiment with oversampling 400%; the number of instances of the wormhole and version attack increased significantly. Then the wormhole and version attack classes included 2340 and 1960 instances respectively. From the result of this experiment; the hello flooding and sinkhole became the minority classes with comparison to the other classes. The final experiment with oversampling 500% has implemented. The results have shown that hello flooding class and sinkhole class have an extremely large number of instances. After the experiments have entirely accomplished, the obtained results showed that the size of the generated routing dataset increased from 5577 instances to 17092 instances. The following table illustrates the obtained results from the experiments.
Table 3. The Result of Experiment using SMOTE
|
Label |
No SMOTE |
100% SMOTE |
200% SMOTE |
300% SMOTE |
400% SMOTE |
500 % SMOTE |
|
Normal |
4465 |
4465 |
4465 |
4465 |
4465 |
4465 |
|
Hello Flooding |
147 |
147 |
588 |
588 |
588 |
3528 |
|
Selective Forward |
321 |
312 |
312 |
1560 |
1560 |
1560 |
|
Sinkhole |
135 |
135 |
540 |
540 |
540 |
3240 |
|
Wormhole |
117 |
468 |
468 |
468 |
2340 |
2340 |
|
Version Attack |
392 |
392 |
392 |
392 |
1960 |
1960 |
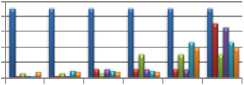
Figure 5 explains the stages of using oversampling rates in each experiment.
I
Z
5 DOO 4000
1000 0

The Rile of Orersamjuliig
Fig.5. The Experiment Results using SMOTE w.r.t the Rate of Oversampling.
И Normal d hell о flooding иselective forward e sinkhole ■womhde 8 version attack
-
B. Feature Selection
There are many inappropriate features because of the complexity of IoT nature which contains a different form of data with diverse features. Therefore; the feature selection is a very important step to remove irrelevant and duplicated features to get a robust learning model and increase the performance rate. In this work, the experiment of the feature selection process is implemented using three feature selection algorithms that are weight by rule (One-R), Chi-Squared and weight by tree importance using random forest. Rule (One-R) is used for creating a good classifier to predict classes using many rules, not one rule. Chi-Squared can be used to identify the differences between observed and expected values. Weight by tree importance using random forest is used to obtain a robust model that has the most significant features with minimum time.
Weight by rule or One-R is a simple feature selection approaches based on feature weights. The idea of the One-R algorithm is built on the evaluation of features according to the error rate. It generates one rule for each feature and then it calculates the error rate for each attribute. It selects the attribute with its rule that has a minimum error rate. Therefore the attribute with high weight is more significant features than others [55]. The selected features that have high weights are CPU power, LPM power, Power, Beacon interval, On-time, Listen Power, Listen duty cycle, Avg. inter-packet, Max inter packet, Transmit power, Transmit duty cycle, Min. inter packet and Received.
Chi-Squared is a statistic algorithm that calculates the weight of attributes concerning the class attribute. It is used to set if an observed frequencies distribution differs from the theoretically expected frequencies. This algorithm is used to estimate the numeric features by sorting the values of the feature. By calculation of X2 value for each pair of approaching intervals in the feature and merging the pair of these intervals with the lower value of x. this process will continue till contradiction is found in the dataset. The attribute has only one value; it removed [55]. The following equation calculates the value of X2
* 2 = е ; .1 е
c j=1
( O j - E j ) 2
E ij
Where X 2 is the chi-square statistic, O is the observed frequency and E is the expected frequency.
The most important features which have high weights are Power, LMP power, CPU power, Listen power, received, Liten Duty cycle, On-time, Beacon interval and transmit power.
The third approach of feature selection is Weight by tree importance which calculates the features by analyzing the split points of a Random Forest model-based model. This technique calculates the weight of the attributes according to the evaluation of the extracted features using the split points of random forest trees [18]. The target of this technique is to detect and fix the noise and avoid over-fitting in the generated model. The random forest tree generates different models that estimate different values of features. So each node of each tree gives the value of the feature.
The most important features are CPU power, LMP power, On-time, Rtmetric, Recieved, Beacon interval, transmit power and Listen power.
The conclusion from the three experiments, the common features had been selected according to high weights to create the feature subset. The selected feature subset contains the following features: CPU power, LMP power, Listen power, Transmit power, Power, Beacon interval, On-time, Received, Listen duty cycle, Transmit duty cycle, Max inter packet, Avg. inter-packet, Min. inter packet, Rtmetric, and ETX.
5. Learning Model
The final step of this work is a learning model based on deep learning. Deep learning is a type of machine learning that uses consecutive layers to gradually reproduce high-level features. Deep learning may be flexible and very domainspecific. It consists of an input layer, multiple hidden layers, and the output layer. In particular, we develop the learning model based on the convolution neural network (CNN). Convolutional neural networks consist of a group of layers that can be classified by their functionalities. The proposed model is based on CNN structure which is implemented through a group of processes called convolution layer, batch normalization layer, activation layer, pooling layer, regularization layer, and fully connected layer. The proposed model consists of three convolution layers, two max-pooling layers,
The first layer in the proposed model is the convolution layer. Generally, CNN has many layers and each layer has a number of neurons that are arranged in three dimensions: width, height, depth. The first hidden layer (L-1) has many numbers of neurons. The selected specific region of neurons is selected and connects to one neuron in the second hidden layer (L) [57]. The small region selected small is called the local receptive field. The local receptive field is moved across the whole first layer. It is noticed that it will be a distinct neuron in the second layer for each local receptive field. The weight matrix and bias are used to differentiate the transition operation from a hidden layer to the next hidden layer. It is used to reduce parameters number. The equation of weight and bias is as follows:
f ( x i , w i , b ) = Ei w i x i + b
Where: xi is an instance, is the weight of instance and b is bias. The following table describes the parameters of the first convolutional layer.
Table 4. The First Convolution Layer Parameters
|
window size |
N = 4×4 |
|
Activation Maps |
64 |
|
Number of filters |
16 |
|
Filter size |
F= 2×2 |
|
Stride |
S=1 (One step) |
|
The Output of the first convolutional layer |
Input to the activation function ReLU |
The filters are used to give the size of the specific part of the convolution layer to create an activation map. Stride is used to reducing the size of the next layer. It helps us to decide how much overlap you want between which is two output values in a layer. The following equation gives the size of the activation function.
The activation function size = 1 +--—
Where N is window size, F is filter size and S is stride.
The process of the convolutional layer is that the first element in the local receptive field multiplies by the first element in the filter and so on. The summation of the final result is one element in the activation function. When we move one stride from left to right by one neuron we create the second element in the activation function. For each filter, we get one activation function. The following graph shows the process of creating an activation function. Batch normalization layer makes networks robust to get high performance and avoid bad initialization of weights to reduce the covariance shift to prevent the instability of the network.
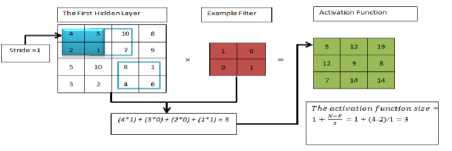
Fig.7. The Process of Convolutional Layer.
The next layer is activation layer that is used to adjust the generated output and increase the non-linearity of the network. The activation function is used for transforming the summed weight of input data into activation output. ReLU is preferred because it will produce input directly if it is positive, otherwise, it will produce zero to achieve better performance [57]. ReLU converts all negative values in the dataset into zero. At the same time, the dataset becomes small with a created feature map that is created at every layer. The following equation can be presented as follows:
f ( x ) = max(0, x )
ReLU is used to increases the training speed of the network so the training process will be fast.
The layer is pooling layer that is used to reduce the spatial dimension of the hidden layer and it is used to reduce the complexity of the further layer to make features more robust to avoid noise and distortion. The following table presents the parameters of Max-pooling.
Table 5. The Max-pooling Layer Parameters
|
window size |
2×2 |
|
Activation Maps |
64 |
|
Number of filters |
16 |
|
Filter size |
F= 2×2 |
|
Stride |
S=2 |
|
The Output of the first convolutional layer |
Input to the activation function ReLU |
The max-pooling has a one stride size. In this case, we can reduce the size of the hidden layer. The following figure shows the process of the max-pooling layer. The result of the max-pooling is processed by the second convolution layer with 32 filters and the stride size is two. The parameters of the second convolutional layer are illustrated in the following table.
Table 6. The Second Convolutional Layer
|
Number of filters |
32 |
|
Kernel size |
[2, 2] |
|
Stride |
S=2 |
The third convolution layer parameters can be presented in the following table.
Table 7. The Third Convolution Layer Parameters
|
Number of filters |
64 |
|
Kernel size |
[2, 2] |
|
Stride |
S=2 |
The next layer is the regularization layer or dropout layer which is used to prevent over-fitting and reduce complexity. Some nodes are selected randomly and their values are zero by probability (P) during the training process. In the testing process, these nodes are measured by P. The probability of dropping randomly a node between zero and one is called dropout rate [59].
Table 8. The Parameters of Regularization Layer and the Fully Connected Layer
|
dropout rate |
0.25 |
|
The fully connected layer |
Number of neurons = 250 |
|
Activation function |
ReLU |
|
Filter size |
F= 2×2 |
|
Stride |
S=2 |
|
The Output of the first convolutional layer |
Input to the activation function ReLU |
In the fully connected layer; each neuron is connected to every neuron in both the previous layer and the next layer. The last layer is the output layer with a softmax activation function based on cross-entropy and two neurons to produce trust results. The following equation describes the output of a fully connected layer with the softmax function:
s ( y, ) = ^p
Z j exp y j
Where y j is the output of j-th neuron
The cross-entropy equation between the output value and the label value can be described as the following
|
equation: |
H ( p , q ) = Zx p ( x )log q ( x ) (6) x Algorithm Learning Model based on CNN Input IoT routing dataset Process For I =1 to N do For each batch of Bm, input data do Compute the results of the convolutional layer Compute the activation function (ReLU) Implement the max-pooling process Compute result of the fully connected layer with a softmax function Compute errors by using the loss function based on cross-entropy between the output value and the label value End for End |
Where N is the maximum number of epoch and Bm is the size of the minimum batch used in the learning model.
6. Performance Metrics
The performance metrics used for evaluation are accuracy, error, class prediction, F-measure and logistic loss.
Accuracy: accuracy is the ratio of the number of correct predictions and the total number prediction. Formally, the equation of accuracy can be represented as follows
AC =
TP + TN
TP + TN + FP + FN
Where: TP = True Positives, TN = True Negatives, FP = False Positives, and FN = False Negatives.
Error: the classification error can be defined as the ratio between incorrect predictions and the total number prediction as follows.
Error =
FP + FN
TP + TN + FP + FN
Precision: it measures the ratio between the true positive (TP) and a total of both true positive and false positive (TP and FP).
Precision =
TP
TP + FP
Recall: it measures the ratio between the true positive (TP) and the total number of true positive and false negative (FN)
Recall =
TP
TP + FN
F-measure or F1 score: it transfers the balance between the precision and the recall.
( Precision * recall )
F - measure = 2*--------------- Precision + recall
Correlation: it is related to the correlation coefficient which measures the correlation between the label and prediction attributes.
n (ZXY )-(Z X )(Z Y)
In Z X 2 " ( Z X ) ‘ ][ n ( Z Y ’) " ( Z Y ) 2 ]
Where: x is the first feature, y is another feature and n is the sample size.
Logistic loss: it is related to cross-entropy. It is used to minimize the error between the predicted value and the desired output. It measures the performance of a classification model where the prediction input is a probability value between 0 and 1. It should be a small value. Logistic loss increases as the predicted probability deviate from the actual value.
Logistic Loss = - Z m j yc log( P ) (13)
Where: m is the number of class labels, p is the predicted probability of class c, y is a binary indicator (0 or 1) if the class label is correct classification.
7. Experimental Results
The experimental results are based on two simulators that are Cooja simulator and RapidMiner. The Cooja simulator is described in section four. The RapidMiner is a data science software platform that provides an integrated environment for data preparation, machine learning, deep learning, text mining, and predictive analytics. It is used for business, commercial applications, research, education, training, rapid prototyping, and application development. It supports the machine learning process including data preparation, results visualization, model validation and optimization. The RapidMiner is used to create many models of machine learning. The RapidMiner is used to build the training model and estimate the performance metrics.
As we mentioned above, the IoT routing dataset is generated using the Cooja simulator.
After using the SMOTE technique, the size of the IoT routing dataset increased which is used for the deep learning model.
In the learning model, we divided IoT routing dataset into five groups according to the type of malicious motes. The five groups or datasets are normal-hello flooding, normal-selective forward, normal-sinkhole, normal-wormhole, and normal-version attacks groups. Each group contains two classes that are named normal class and any type of five malicious motes. Table 9 presents five groups of the dataset and the number of instances in each group.
Table 9. Five Created Datasets with Number of Instances
|
Dataset Name |
No. of Instances |
|
|
Normal-Hello Flooding |
Normal (4465) |
Hello Flooding (3528) |
|
Normal-Selective Forward |
Normal (4465) |
Selective forward (1560) |
|
Normal-Sinkhole |
Normal (4465) |
Sinkhole (3240) |
|
Normal-Wormhole |
Normal (4465) |
Wormhole (2340) |
|
Normal-Version Attacks |
Normal (4465) |
Version Attacks (1960) |
The target of this division of IoT routing dataset is to know the effect of each attack on power consumption. Each training process uses 80 % for training and 20 % for the test. The IoT attack prediction model starts with the candidate features and using the CNN process which is applied to the five groups of datasets. During the training process, the learning model in this experiment is based on the number of epochs and neurons. Therefore; the number of epoch and neurons are related to accuracy and loss. In other meaning; when the number of epoch and neurons will increase the accuracy will increase and loss will decrease as shown in the following figures.
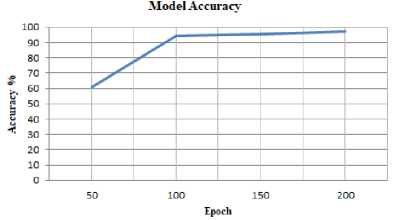
Fig.8. Model Accuracy.
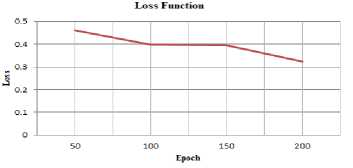
Fig.9. Model Loss Function.
Therefore, the proposed model is based on using 250 neurons and 200 epochs to obtain high-performance metrics to detect and predict different types of attacks that are effective in power consumption.
The following Figure shows that the experiment of the RapidMiner is based on using normal-hello flooding dataset to build the learning model.
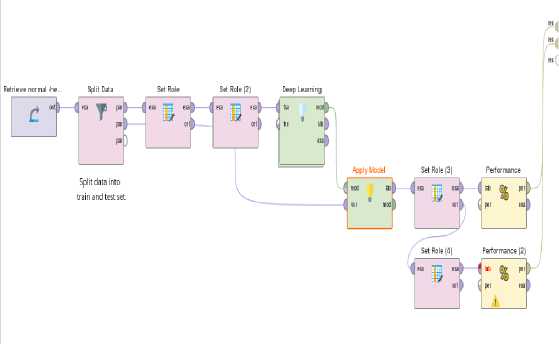
Fig.10. The RapidMiner Experiment using Normal-Hello Flooding Dataset
The first dataset named normal-hello flooding have obtained high accuracy (96.87%), low error (3.13%), high precision (94.85%) and recall (99.65%), high F-measure (97.19%), high correlation (93.8 %) and low logistic loss (0.325) as shown in the following table. The rates of the performance metrics of the detection hello flooding attack are high.
Table 10. The Performance Metrics of the Normal-Hello Flooding Dataset
|
AC % |
Error % |
Precision % |
Recall % |
F-measure % |
Correlation % |
Logistic Loss |
|
96.87 |
3.13 |
94.85 |
99.65 |
97.19 |
93.8 |
0.325 |
These results have shown that the proposed model can detect and predict hello flooding attack which affects power consumption such as transmit power. The following table illustrates the rate of transmission power in malicious motes in the IoT network. It is obvious that the values of transmit power in case of hello flooding attack and normal case are 0.020228 and 0.006416 respectively. It can be observed that malicious nodes (hello flooding attacks) have encountered a large rate of transmit power. This led to massive energy consumption. When we detect hello flooding attack, the value of transmit power will minimize.
Table 11. The Difference between Transmit Power in Normal and Hello Flooding Motes
|
CPU Power |
LPM Power |
Listen Power |
Transmit Power |
Label |
|
0.648495 |
0.143865 |
59.976901 |
0.020228 |
Hello flooding |
|
0.795579 |
0.139412 |
59.98279 |
0.016319 |
Hello flooding |
|
0.42086 |
0.150757 |
59.991524 |
0.006416 |
Normal |
|
0.395442 |
0.151527 |
59.991243 |
0.006677 |
Normal |
The evaluation results of the second dataset named normal-selective forward are shown in the following table. The table shows that the selective forward can be detected with high performance metrics. The results achieve high accuracy (96.02%), precision (99.61%) and recall (84.5%), high F-measure (91.49%), high correlation (89.4%), low error (3.98 %) and low logistic loss (0.328).
Table 12. The Performance Metrics of the Normal-Selective Forward Dataset.
|
AC % |
Error % |
Precision % |
Recall % |
F-measure % |
Correlation % |
Logistic Loss |
|
96.02 |
3.98 |
99.61 |
84.59 |
91.49 |
89.4 |
0.328 |
These results have shown that the proposed model can detect and predict a selective forward attack that affects power consumption such as transmit power and CPU power. It can be noticed that malicious nodes (selective forward attacks) consume transmit power and CPU power that are 0.02733 and 1.332297 respectively. After the detection of a selective forward attack, the value of transmit power and CPU power will be decreased. In normal case, the values are 0.005654 and 0.397325 respectively. The following table explains the rate of transmission power and CPU power in the IoT network.
Table 13. The Difference between Transmit Power and CPU Power in Normal and Selective Forward Motes
|
CPU Power |
LPM Power |
Listen Power |
Transmit Power |
Label |
|
1.105401 |
0.130347 |
59.975084 |
0.021012 |
selective forward |
|
1.332297 |
0.122629 |
59.974324 |
0.02733 |
selective forward |
|
0.397325 |
0.15147 |
59.992768 |
0.005654 |
Normal |
|
0.392529 |
0.151615 |
59.991352 |
0.006848 |
Normal |
The results of the third dataset named normal-sinkhole have shown high-performance metrics. The following table illustrates that the performance metrics of sinkhole detection achieved high rate. It achieves high accuracy (98.57%), precision (99.84%) and recall (96.84%), high F-measure (98.32%), high correlation (97.1), low error (1.43%) and low logistic loss (0.319) as shown in the following table.
Table 14. The Performance Metrics of the Normal-Sinkhole Dataset
|
AC % |
Error % |
Precision % |
Recall % |
F-measure % |
Correlation % |
Logistic Loss |
|
98.57 |
1.43 |
99.84 |
96.84 |
98.32 |
97.1 |
0.319 |
These results have shown that the proposed model can detect and predict sinkhole attack which affects power consumption such as transmit power and CPU power. The following table explains the rate of transmission power and CPU power in the IoT network. It was noticed that selective forward attacks consume transmit power and CPU power that are 0.021388 and 0.95022 respectively. The value of transmit power and CPU power will be declined after applying the detection process. The values of transmit power and CPU power in normal case are 0.005654 and 0.397325 respectively.
Table 15. The difference between transmit power and CPU power in normal and sinkhole motes
|
CPU Power |
LPM Power |
Listen Power |
Transmit Power |
Label |
|
0.927884 |
0.134789 |
59.979652 |
0.0252 |
Sinkhole |
|
0.95022 |
0.134638 |
59.954175 |
0.021388 |
Sinkhole |
|
0.397325 |
0.15147 |
59.992768 |
0.005654 |
Normal |
|
0.392529 |
0.151615 |
59.991352 |
0.006848 |
Normal |
The evaluation results of applying the proposed model based on the normal-wormhole dataset are shown in the following table. It achieves high accuracy (98.09%), high precision (99.5%) and recall (94.4%), high F-measure (97.15%), high correlation (95.8%), low error (1.91%) and low logistic loss (0.32).
Table 16. The Performance Metrics of the Normal-Wormhole Dataset
|
AC % |
Error % |
Precision % |
Recall % |
F-measure % |
Correlation % |
Logistic Loss |
|
98.09 |
1.91 |
99.5 |
94.4 |
97.15 |
95.8 |
0.32 |
The proposed model can detect and predict a wormhole attack which has an impact on power consumption such as CPU power and transmit power. The value of CPU power and transmit power decreased after applying the proposed model that are 1.136487 and 0.037185 respectively. The following table explains the rate of CPU power and transmission power in the IoT network in wormhole attack and normal case.
Table 17. The Difference between CPU Power and Transmit Power in Normal and Wormhole Motes
|
CPU Power |
LPM Power |
Listen Power |
Transmit Power |
Label |
|
1.136487 |
0.132298 |
59.955316 |
0.037185 |
Wormhole |
|
1.119939 |
0.132156 |
59.957206 |
0.036254 |
Wormhole |
|
0.397325 |
0.15147 |
59.992768 |
0.005654 |
Normal |
|
0.392529 |
0.151615 |
59.991352 |
0.006848 |
Normal |
The performance metrics of the last dataset named normal-version attack are closed to 90%. It achieves high accuracy (90.40%), high precision (95.05%), high recall (80.08%), high F-measure (88.56%), high correlation (81.8%), low error (9.60%) and low logistic loss (0.350) as the following table.
Table 18. The Performance Metrics of the Normal-Version Attack Dataset
|
AC % |
Error % |
Precision % |
Recall % |
F-measure % |
Correlation % |
Logistic Loss |
|
90.40 |
9.60 |
95.05 |
80.08 |
88.56 |
81.8 |
0.350 |
The proposed model can detect and predict version attack which has an impact on all types of power consumption. The value of power declined when the proposed model is applied to the normal-version attack group. In case of version attack, the values of all power consumption are high. The following table explains the rate of power in the IoT network.
Table 19. The Difference between Power in Normal and Version Attack Motes
|
CPU Power |
LPM Power |
Listen Power |
Transmit Power |
Label |
|
1.36423 |
0.243052 |
59.973865 |
0.023063 |
version attack |
|
1.57890 |
0.543346 |
59.974344 |
0.032444 |
version attack |
|
0.397325 |
0.15147 |
59.992768 |
0.005654 |
Normal |
|
0.392529 |
0.151615 |
59.991352 |
0.006848 |
Normal |
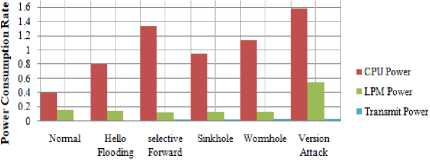
From the previous results, it is noticed that the effect of attacks on power consumption types. The rates of power in attack cases are a higher rate than in the normal case. Therefore; it had to be detection IoT routing attacks using CNN because they consumed power of smart devices in the IoT environment. Also; this leads to consuming power in the IoT network and destroys the structure of the network because it consumes the power of nodes. The following chart shows the relationship between all types of power in normal cases and malicious cases. All IoT routing attacks can affect on all power consumption.
Рочег Consumption in Normal and Attacks Cases
Label
Fig.11. Power Consumption in Normal and Attacks Cases
8. Conclusion
In this paper, we proposed framework architecture for IoT healthcare to support elderly care at home to increase security performance. The framework included the proposed model which is based on real-time routing traffic to create an environment of IoT nodes includes normal and malicious nodes. The proposed model had been implemented through many stages. First; the proposed used Cooja simulator to generate IoT routing dataset based on power consumption which including normal and malicious motes. The proposed model was based on using deep learning to obtain a robust model and high-performance metrics. Therefore; the size of the IoT routing dataset had been increased using SMOTE to produce a robust model. The generated IoT routing dataset was developed with three feature extraction approaches that are weight by rule (One-R), Chi-Squared and weight by tree importance using the random forest to remove irrelevant and duplicated features. These methods had improved the generated IoT routing dataset to reduce noise and over-fitting in the learning model and obtain the most significant feature to obtain a robust model.
The proposed model had been implemented using CNN because it is more flexible algorithm and introduces high accuracy. The proposed model based on CNN can detect IoT routing attacks and had identified suspicious network traffic in real-time. The experimental results achieved the detection of IoT routing attacks with accurate classification using the proposed model based on CNN. The experimental results had shown that IoT routing attacks can be detected with high performance metrics that can affect on power consumption types. The proposed model achieved high accuracy, precision, recall, high F-measure, high correlation, low error and low logistic loss. From results; it is clear that the rates of power in attack cases are a higher rate than in the normal case. Therefore; it should detect different types of IoT routing attacks because they affected and consumed power of smart devices. This led consuming power in the IoT network and destroys the structure of the network. This paper had analyzed different types of IoT routing attacks and different types of power consumption of nodes in IoT environment. By this way; it can be decreased the power consumption and maintain the stability of the IoT network. The future work will focus on the modification of CNN algorithm because the training process takes more time.
References Mitigating the Impact of IoT Routing Attacks on Power Consumption in IoT Healthcare Environment using Convolutional Neural Network
- S. M. Riazul Islam, Daehan Kwak, MD. Humaun Kabir, Mahmud Hossain, Kyung-Sup Kwak, “The Internet of Things for Health Care: A Comprehensive Survey”, IEEE Access, vol. 3, pp. 678 – 708, 2015. “DOI: 10.1109/ACCESS.2015.2437951”
- Stephanie B. Baker, Wei Xiang, Ian Atkinson, “Internet of Things for Smart Healthcare: Technologies”, Challenges and Opportunities”, IEEE Access, vol. 5, pp. 26521 – 26544, 2017. “DOI: 10.1109/ACCESS.2017.2775180”
- M. Teresa Villalba, Manuel de Buenaga, Diego Gachet, Fernando Aparicio, “Security Analysis of an IoT Architecture for Healthcare”, In: Mandler B. et al. (eds) Internet of Things. IoT Infrastructures, IoT360, Lecture Notes of the Institute for Computer Sciences, Social Informatics and Telecommunications Engineering, Springer, Cham, vol 169, pp. 454–460, 2016. “DOI: 10.1007/978-3-319-47063-4_48”
- Pallavi Sethi and Smruti R. Sarangi, “Internet of Things: Architectures, Protocols, and Applications”, Journal of Electrical and Computer Engineering, vol. 2017, pp. 1-25, 2017. “DOI: 10.1155/2017/9324035”
- Mustafa Abdullah Azzawi, Rosilah Hassan and Khairul Azmi Abu Bakar, “A Review on Internet of Things (IoT) in Healthcare”, International Journal of Applied Engineering Research, vol. 11, no. 20, pp. 10216-10221, 2016.
- Aaditya Jain, Bhupendra Kumar Soni, “Secure Modern Healthcare System Based on Internet of Things and Secret Sharing of IoT Healthcare Data”, International Journal Advanced Networking and Applications, vol. 08, Issue 06, pp. 3283-3289, 2017.
- Shantha Mary Joshitta R, Arockiam L, “EPC Based Authentication of Devices in the Smart Healthcare System”, International Journal of Electrical Electronics & Computer Science Engineering, vol. 4, Issue 4, pp. 6-11, 2017.
- Inayat Ali, Sonia Sabir, Zahid Ullah, “Internet of Things Security, Device Authentication and Access Control: A Review”, International Journal of Computer Science and Information Security (IJCSIS), vol. 14, no. 8, pp. 1-11, 2016.
- Hezam Akram Abdul-Ghani, Dimitri Konstantas, Mohammed Mahyoub, “A Comprehensive IoT Attacks Survey based on a Building-blocked Reference Model”, International Journal of Advanced Computer Science and Applications (IJACSA), vol. 9, no. 3, pp. 355-373, 2018.
- Usama Salama, Lina Yao, Hyeyoung Paik, “An Internet of Things Based Multi-LevelPrivacy-Preserving Access Control for Smart Living”, Informatics, vol.5, no. 23, pp. 1-18, 2018. “DOI: 10.3390/informatics5020023”
- Ruan de A. C. Mello, Admilson de R. L. Ribeiro, Fernando M. de Almeida, Edward D. Moreno, “Mitigating Attacks in the Internet of Things with a Self-protecting Architecture”, The Thirteenth Advanced International Conference on Telecommunications (AICT 2017), Venice, Italy, pp. 14-19, June 25 – 29 2017.
- Shantha Mary Joshitta R, L. Arockiam, “A Neoteric Authentication Scheme for IoT Healthcare System”, International Journal of Engineering Sciences & Research Technology (IJESRT), vol. 5, pp. 296-303, June 25 – 29 2017. “DOI: 10.5281/Zenodo.192911”
- Abhishek Verma, Virender Ranga, “Analysis of Routing Attacks on RPL based 6LoWPAN Networks”, International Journal of Grid and Distributed Computing, vol. 11, no. 8, pp.43-56, 2018.
- Anthéa Mayzaud, Rémi Badonnel, Isabelle Chrisment, “A Taxonomy of Attacks in RPL-based Internet of Things”, International Journal of Network Security, vol.18, no.3, pp.459-473, 2016.
- Sim Ahmad Alabsi, Mohammed Anbar, Selvakumar anikam, “A Comprehensive Review on Security Attacks in Dynamic Wireless Sensor Networks based on RPL protocol”, International Journal of Pure and Applied Mathematics, vol. 118, vo. 20, pp. 653-667, 2018.
- Bayu Adhi Tama and Kyung-Hyune Rhee, “Attack Classification Analysis of IoT Network via Deep Learning Approach”, Information & Communication Technology Evolution (ReBICTE), vol. 3, no. 15, pp. 1-9, 2017. “DOI: 10.22667/ReBiCTE.2017.11.15.015”
- Liang Xiao, Xiaoyue Wan, Xiaozhen Lu, Yanyong Zhang, Di Wu, “IoT Security Techniques Based on Machine Learning: How Do IoT Devices Use AI to Enhance Security?”, IEEE Signal Processing Magazine, vol. 35, Issue 5, , pp. 41 – 49, 2018. “DOI: 10.1109/MSP.2018.2825478”
- Furkan Yusuf Yavuz, Devrim ÜNAL, Ensar GÜL, “Deep Learning for Detection of Routing Attacks in the Internet of Things”, International Journal of Computational Intelligence Systems, vol. 12, pp. 39-58, 2018.
- Jean Caminha, Angelo Perkusich, Mirko Perkusich, “A Smart Trust Management Method to Detect On-Off Attacks in the Internet of Things”, Hindawi, Security and Communication Networks, vol. 2018, pp. 1-10, 2018.
- Ghada Glissa, Abderrezak Rachedi, Aref Meddeb, “A secure routing protocol based on RPL for Internet of Things”, 2016 IEEE Global Communications Conference (GLOBECOM), 4-8 Dec. 2016, Washington, DC, USA, pp. 1-6. “DOI: 10.1109/GLOCOM.2016.7841543”
- Nour Moustafa, Benjamin Turnbull, Kim-Kwang Raymond Choo, “An Ensemble Intrusion Detection Technique based on proposed Statistical Flow Features for Protecting Network Traffic of Internet of Things”, IEEE Internet of Things Journal, pp. 1-16, 2018. “DOI: 10.1109/JIOT.2018.2871719”
- Traian Avram, Seungchan Oh, Salim Hariri, “Analyzing Attacks in Wireless Ad Hoc Network with Self-Organizing Maps”, Fifth Annual Conference on Communication Networks and Services Research (CNSR '07), 14-17 May 2007, Canada, pp. 166 – 175. “DOI: 10.1109/CNSR.2007.15”
- Mohamad Nazrin Napiah , Mohd Yamani Idna Bin Idris, Roziana Ramli, Ismail Ahmedy, “Compression Header Analyzer Intrusion Detection System (CHA - IDS) for 6LoWPAN Communication Protocol”, IEEE Access, Special Section on Security Analytics and Intelligence for Cyber Physical Systems, vol. 6, pp. 16623- 16638, 2018. “DOI: 10.1109/ACCESS.2018.2798626”
- Abebe Abeshu Diro, Naveen Chilamkurti, “Distributed attack detection scheme using deep learning approach for Internet of Things”, Future Generation Computer Systems, vol. 82, pp. 761-768, 2018. “DOI: 10.1016/j.future.2017.08.043”
- Sophia Kaplantzis, Alistair Shilton, Nallasamy Mani, Y. Ahmet S¸ ekercio˘ glu, “Detecting Selective Forwarding Attacks in Wireless Sensor Networks using Support Vector Machines”, 2007 3rd International Conference on Intelligent Sensors, Sensor Networks and Information, 3-6 Dec. 2007, Melbourne, Qld., Australia, pp. 335 – 340. “DOI: 10.1109/ISSNIP.2007.4496866”
- Faiza Medjek, Djamel Tandjaoui, Imed Romdhani, Nabil Djedjig, “Performance Evaluation of RPL Protocol Under Mobile Sybil Attacks”, 2017 IEEE Trustcom/BigDataSE/ICESS, 1-4 Aug. 2017, Sydney, NSW, Australia, “DOI: 10.1109/Trustcom/BigDataSE/ICESS.2017.351”
- Pavan Pongle, Gurunath Chavan, “Real Time Intrusion and Wormhole Attack Detection in Internet of Things”, International Journal of Computer Applications, Vol. 121 No. 9, pp. 1-9, 2015.
- Anhtuan Le, Jonathan Loo, Yuan Luo, Aboubaker Lasebae, “Specification-based IDS for securing RPL from topology attacks”, 2011 IFIP Wireless Days (WD), 10-12 Oct. 2011, Niagara Falls, ON, Canada, pp. 1-3. “DOI:10.1109/WD.2011.6098218”
- Elike Hodo, Xavier Bellekens, Andrew Hamilton, Pierre-Louis Dubouilh, Ephraim Iorkyase, Christos Tachtatzis and Robert Atkinson, “Threat analysis of IoT networks Using Artificial Neural Network Intrusion Detection System”, 2016 International Symposium on Networks, Computers and Communications (ISNCC), 11-13 May 2016,, Yasmine Hammamet, Tunisia, pp. 1-6. “DOI:10.1109/ISNCC.2016.7746067”
- Xiaolei Liu, Xiaosong Zhang, Nadra Guizani, Jiazhong Lu, Qingxin Zhu, Xiaojiang Du, “TLTD: A Testing Framework for Learning-Based IoT Traffic Detection Systems”, Sensors, vol. 18, no. 8, pp. 1-13, 2018. “DOI:10.3390/s18082630”
- Ashutosh Bandekar, Ahmad Y. Javaid, “Cyber-attack Mitigation and Impact Analysis for Low-power IoT Devices”, 2017 IEEE 7th Annual International Conference on CYBER Technology in Automation, Control, and Intelligent Systems (CYBER), 31 July-4 Aug. 2017, Honolulu, HI, USA, pp. 1631 – 1636. “DOI: 10.1109/CYBER.2017.8446380”
- Yang Xin, Lingshuang Kong, Zhi Liu, Yuling Chen, Yanmiao L, Hongliang Zhu, Mingcheng Gao, Haixia Hou1, Chunhua Wang, “Machine Learning and Deep Learning Methods for Cybersecurity”, IEEE Access, vol. 6, pp. 35365 – 35381, 2018. “DOI: 10.1109/ACCESS.2018.2836950”
- Nadia Chaabouni, Mohamed Mosbah, Akka Zemmari, Cyrille Sauvignac, Parvez Faruki, “Network Intrusion Detection for IoT Security based on Learning Techniques”, IEEE Communications Surveys & Tutorials, pp. 1-32, 2019. “DOI: 10.1109/COMST.2019.2896380”
- Divya Sharma, Ishani Mishra, Sanjay Jain, “A Detailed Classification of Routing Attacks against RPL in Internet of Things”, International Journal of Advance Research, Ideas and Innovations in Technology, vol. 3 Issue 1, pp. 692-703, 2017.
- Binbin Chen, Yuan Li, and Daisuke Mashima, “Analysis and Enhancement of RPL under Packet Drop Attacks”, 2018 10th International Conference on Communication Systems & Networks (COMSNETS), 3-7 January 2018, Bengaluru, India, pp. 167 – 174. “DOI: 10.1109/COMSNETS.2018.8328194”
- Mahmood Alzubaidi, Mohammed Anbar, Samer Al-Saleem, Shadi Al-Sarawi, Kamal Alieyan, “Review on Mechanisms for Detecting Sinkhole Attacks on RPLs”, 2017 8th International Conference on Information Technology (ICIT), 17-18 May 2017, Amman, Jordan, pp. 369 – 374. “DOI: 10.1109/ICITECH.2017.8080028”
- LinusWallgren, Shahid Raza, Thiemo Voigt, “Routing Attacks and Countermeasures in the RPL-Based Internet of Things”, Hindawi Publishing Corporation, International Journal of Distributed Sensor Networks, vol. 2013, pp. 1-11, 2013.
- Patrick Olivier Kamgueua, b Emmanuel Nataf, Thomas Djotio Ndie, “Survey on RPL enhancements: a focus on topology, security and mobility”, Elsevier, Computer Communications, vol.120, pp.10-21, 2018. “DOI: 10.1016/j.comcom.2018.02.011”
- Jun Jiang and Yuhong Liu and Behnam Dezfouli, “A Root-based Defense Mechanism Againt RPL Blackhole Attacks in Internet of Thing Networks”, Proceedings, APSIPA Annual Summit and Conference 2018, 12-15 November 2018, Hawaii, pp. 1194- 1199
- Pericle Perazzo, Carlo Vallati, Giuseppe Anastasi, and Gianluca Dini, “DIO Suppression Attack Against Routing in the Internet of Things”, IEEE Communications Letters, vol. 21, no. 11, pp. 2524- 2527, 2017.
- R. Stephen, Dr. L. Arockiam, “RIAIDRPL: Rank Increased Attacks (RIA) Identification Algorithm for Avoiding Loop in the RPL DODAg”, International Journal of Pure and Applied Mathematics, vol. 119, no. 16, pp. 1203-1210, 2018.
- Firoz Ahmed, Young-Bae Ko, “Mitigation of black hole attacks in Routing Protocol for Low Power and Lossy Networks”, Security and Communication Networks, vol. 9, pp. 5143–5154, 2016. “DOI: 10.1002/sec.1684”
- Karishma Chugh, Aboubaker Lasebae, Jonathan Loo, “Case Study of a Black Hole Attack on 6LoWPAN-RPL”, The Sixth International Conference on Emerging Security Information, Systems and Technologies, August 19-24, 2012, Rome, Italy, pp. 157-162, 2012.
- OlivierBrun,YonghuaYin, ErolGelenbe, “Deep Learning with Dense Random Neural Network for Detecting Attacks against IoT-connected Home Environments”, Procedia Computer Science, vol. 134, pp. 458-463, 2018.
- Sunil Bhutada,Preeti Bhutada, “Applications of Artificial Intelligence in Cyber Security”, International Journal of Engineering Research in Computer Science and Engineering (IJERCSE), vol 5, Issue 4, pp. 214-219, 2018.
- Preeti Mishra, Vijay Varadharajan, Uday Tupakula, mmanuel S. Pilli, “A Detailed Investigation and Analysis of using Machine Learning Techniques for Intrusion Detection”, IEEE Communications Surveys & Tutorials, pp. 1-46, 2018. “DOI: 10.1109/COMST.2018.2847722”
- Amrita Ghosal, Subir Halder, “Intrusion Detection in Wireless Sensor Networks: Issues, Challenges and Approaches”, Springer, Wireless Networks and Security, pp. 329–367, 2013. “DOI: 10.1007/978-3-642-36169-2_10”
- Dharmini Shreenivas, Shahid Raza, Thiemo Voigt, “Design Of Intrusion Detection System For Dos Attack In 6lowpan And RPL Based IoT Network”, International Journal of Innovative Technology and Exploring Engineering (IJITEE), vol. 8, Issue-11, pp. 3840-3844, 2019.
- Bayu Adhi Tama, Kyung-Hyune Rhee, “Attack Classification Analysis of IoT Network via Deep Learning Approach”, Information & Communication Technology Evolution (ReBICTE), vol. 3, no. 15, pp. 1-10, 2017.
- Dave Eastman, Sathish A.P Kumar, “A Simulation Study to Detect Attacks on Internet of Things”, 2017 IEEE 15th International Conference on Dependable, Autonomic and Secure Computing, 15th Intl Conf on Pervasive Intelligence and Computing, 3rd Int. Conf. on Big Data Intelligence and Computing and Cyber Science and Technology Congress, 6-10 Nov. 2017, Orlando, FL, USA, pp. 645 – 650. “DOI. 10.1109/DASC-PICom-DataCom-CyberSciTec.2017.113”
- Mohamed Lamine Messai, “Classification of Attacks in Wireless Sensor Networks”, International Congress on Telecommunication and Application’14, University of A.MIRA Bejaia, 23-24 April 2014, Algeria, pp. 1-5
- Vasileios Iosifidis, Eirini Ntoutsi, “Dealing with Bias via Data Augmentation in Supervised Learning Scenarios”, Proceedings of the International Workshop on Bias in Information, Algorithms, and Systems co-located with 13th International Conference on Transforming Digital Worlds (iConference 2018), March 25th, 2018, Sheffield, United Kingdom, pp. 24-29.
- Sebastien C. Wong, Adam Gatt, Victor Stamatescu, “Understanding data augmentation for classification: when to warp?”, 2016 International Conference on Digital Image Computing: Techniques and Applications (DICTA), 30 Nov.-2 Dec. 2016. , Gold Coast, QLD, Australia. DOI: 10.1109/DICTA.2016.7797091
- Kadhim B.S. Al Janabi, Rusul Kadhim, “Data Reduction Techniques: A Comparative Study for Attribute Selection Methods”, International Journal of Advanced Computer Science and Technology, vol. 8, no. 1, pp. 1-13, 2018.
- Pinar Yildirim, “Filter Based Feature Selection Methods for Prediction of Risks in Hepatitis Disease”, International Journal of Machine Learning and Computing, vol. 5, no. 4, pp. 258- 263, 2015.
- Pan Wang, Feng Ye, Xuejiao Chen, Yi Qian, “DataNet: Deep Learning based Encrypted Network Traffic Classification in SDN Home Gateway”, IEEE Access, vol. 4, pp. 1-12, 2018.
- David Gil, Magnus Johnsson, Higinio Mora, Julian SzymaNski, “Review of the Complexity of Managing Big Data of the Internet of Things”, Wiley, Hindawi, Complexity, vol. 2019, pp. 1-12, 2019. “DOI: https://doi.org/10.1155/2019/4592902”
- Nitish Srivastava, Geoffrey Hinton, Alex Krizhevsky, Ilya Sutskever, Ruslan Salakhutdinov, “Dropout: A Simple Way to Prevent Neural Networks from Overfitting”, Journal of Machine Learning Research, vol. 15, pp. 1929-1958, 2014.
- Saad Albawi, Tareq Abed Mohammed, Saad Al-Zawi, “Understanding of a convolutional neural network”, 2017 International Conference on Engineering and Technology (ICET), 21-23 Aug. 2017, Antalya, Turkey, pp. 1-7. “DOI: 10.1109/ICEngTechnol.2017.8308186”
- Sunil Kumar, Ilyoung Chong, “Correlation Analysis to Identify the Effective Data in Machine Learning: Prediction of Depressive Disorder and Emotion States”, International Journal of Environmental Research and Public Health, vol. 15, no. 12, pp. 1-24, 2018.
