Modeling and optimizing patients’ flows inside emergency department based on the simulation model: a case study in an algerian hospital
Автор: Oussama Derni, Fatma Boufera, Mohamed Faycal Khelfi
Журнал: International Journal of Information Engineering and Electronic Business @ijieeb
Статья в выпуске: 4 vol.11, 2019 года.
Бесплатный доступ
In Algeria, as in many other countries, the Emergency Department (ED) of the hospital, is the main entrance to the hospital, which provides Healthcare to patients threatened with death, and which faces several issues, emphasized by resource limitation. Our work presents a description of patient flow inside the ‘ED’ of Chalabi Abdelkader Hospital, Mascara, Algeria. This study aims to prevent the care complication scheme by adopting a workflow approach in order to design the patient flow in the chosen ‘ED’. The objective is to enhance patients’ flows, to improve the quality of the patient supervision, by targeting the minimization of the total and waiting times. A simulation model of the study system will be built based on the acquired data, and it will be validated by domain experts for a maximal rapprochement to the reality. Then, many simulations instances will be realized using Rockwell ARENA simulator to evaluate the impact of the proposed solutions. As a result of this study, we provided to ‘ED’ supervisors many improvement solutions and recommendations to the issues identified in the modeling phase.
Emergency department, Modeling, Workflow, Optimization, Simulation, Arena Rockwell, Length of stay, Waiting times
Короткий адрес: https://sciup.org/15016181
IDR: 15016181 | DOI: 10.5815/ijieeb.2019.04.03
Текст научной статьи Modeling and optimizing patients’ flows inside emergency department based on the simulation model: a case study in an algerian hospital
Published Online July 2019 in MECS
Nowadays, the challenges are growing up significantly in most healthcare organization, specifically in hospital emergency departments, due to the increased number of health care demands [1-3], the appearance of new kind of pathologies, and the absence of a deep study of ‘ED’ needs, specifically in Algeria.
The key issues encountered in such a system, are summarized in the lack of resources (human and material), the long waiting times of patients, and the highest rate of patients who leave the ‘ED’ without been seen by a practitioner. These issues affect the delivered care quality.
Moreover, the inefficiency of time management has a big impact on the treatments quality and the satisfaction of patients [4, 5], especially in overcrowding situations [6], which prolong the total duration of the patient inside the ‘ED’ and raise the death rate. In order to minimize the total duration of the patient at the ‘ED’ and to improve the care quality, many techniques of the industrial domain have been applied in healthcare area [7, 8].
The main objectives of this work are presented in the minimization of the waiting and the total time of patients inside the ‘ED’ for better performance. Additionally, we attempt to reduce the duration of the different operations in patient admission process.
In order to achieve our main objective described at the beginning of this section, we going to use a Workflow approach for modeling the case study system, in order to lift the lid from the lacks and to improve the performance of the ‘ED’ at different stages.
Discrete Event Simulation (DES) is a common technique used in the study of systems’ dynamics. It is an operative technique in dealing with systems, where the change of the state of a system, over time, is a series of discrete events. In our case, we use DES in the evaluation of the impact of many proposed optimization solutions. A simulation model was constructed using the simulator Rockwell Automation Arena v15, which is a DES software for process automation and simulation. It has been effectively used in many recent kinds of research [911].
The goal of the developed model is to examine the influence of many improvements scenarios targeting medical staffs, resources, as well as the structure of the studied system. In order to propose to ‘ED’ supervisors numerous solutions, and to provide an understanding of system’ comportment, by identifying the lacks, and the causes which have an impact on its performance.
The proposed approach allowing us to achieve the expected performances and results, it will be realized on the base of three main steps: 1) Analyze and study the actual system with data collection, 2) Modeling patient flows using Workflow, in order to identify the glitches, 3) Building a simulation model to measure the impact of the proposed solutions.
This paper is organized as follows. Section II presents a background of this study. Second III provides the methodology of this research; it starts with a short description of the studied ‘ED’. Then we explain the flowchart of Workflow patient admission process and present the collected data. Additionally, we going to highlight the simulation parameters, and describe the simulation model. In section IV, we propose many improvement solutions and we evaluate the impact of each of those solutions by running many simulation instances. The simulation results will be discussed in section V. Finally, the last section provides a general conclusion of the presented work with future looks.
-
II. Related Works
Many researchers tried optimizing ‘ED’ performances by reducing the waiting times and the total length of stay (LOS) of patients in ‘EDs’. In the research of [12], the authors proposed an agent-based simulation tool for the evaluation of fast-track treatment. The proposed tool is dedicated to studying the comportment variation of entities, and resources in the system. As a result, they reached a significant reduction in the term of waiting time.
In [13], researchers developed a decision support tool for the department of surgery of a public hospital in Italy, based on a simulation-optimization approach. For the recognition of the suitable adjustment of the available resources, to reach better performance, by allowing managers to select the priority objective.
Discrete event simulation techniques are frequently been used to estimate the future capacity of new ‘ED’ extensions. In recent research of [14], the authors explore the role that computer simulation modeling should play in research, and in the development of ‘ED’ systems. They provide a description of the four fundamental approaches to computer simulation modeling, besides their uses; those approaches are presented in System Dynamics modeling, Discrete-Event Simulation, Agent-Based Simulation, and Monte Carlo Simulation.
Authors in [15] introduced an interactive simulationbased decision support framework to examine the impact of potential alternatives based on the decision makers’ preferences. They concluded that the releasing of ‘ED’ outflows by in-patient bed administration is more efficient than increasing the ‘ED’ physical capacity.
Deficiency of resources in EDs is one of the main reason behind the long waiting time and the higher rate of the patient left without being seen (LWBS). In the research of [16], researchers used a simulation optimization approach to find the appropriated configuration in ‘ED’ resources, including nurses, general practitioners, and beds. After running many simulation instances under different budget constraints, they reached an improvement of 8.1% in LOS with the current budget, and 9.5% with a maximum of 35.5 budget units.
Researchers in [17] have presented a DES model combined with suitable meta-models to enhance patient flow and alleviate congestion by changing the number of ‘ED’ resources. They evaluate the performance of the system for different configuration of resources, and then a meta-model technique was chosen to replace the computationally expensive DES model. As a result, the total average waiting times of patients were minimized by 48%.
In [18], researchers developed a protocol for early detection of patients with uncomplicated sepsis, in addition to severe sepsis and septic shock. They built a Workflow model to understand the current state of sepsis care in the studied ‘ED’. As a result of their study, they concluded that early screening interventions can lead to expedited delivery of care to patients, with sepsis in the ‘ED’ and could serve as a model for other facilities.
Few authors have focused on human errors in the ‘ED’, which affect the quality of health care and has an impact on the waiting times. In [19], the authors developed a simulation-optimization model by modeling human errors. They evaluate three types of errors (unsafe transportation, repeated venipuncture, and sampling errors). Many scenarios approved by experts were defined, the results illustrate that the addition of nurse and physician in the ‘ED’ would reduce human errors, patient duration, and queue length.
-
III. Methodology
As explained at the end of section I, our approach is based on three mains phases. Initially, we start by collecting the necessary data from the concerned ‘ED’, and then we use the data as inputs parameters to build the simulation model, which is the second phase. Finally, we run many simulation instances of the proposed improvement adjustments and discuss the obtained results.
The obtained gains from applying our approach are to offer to ‘ED’ supervisors, many improvement solutions and recommendations to the identified issues in the modeling phase. As well, we measured the impact and the reached improvement of each of those solutions.
-
A. Description of Chalabi Abdelkader emergency department
The studied emergency department of Chalabi Abdelkader hospital (Non-University Public Hospital Establishment) is situated in Mascara city, Algeria. Is receiving more than 5000 patients per month based on the collected data for two years, from January 2015 to
December 2016. It has a capacity of 16 patients’ rooms, along with one critical room for trauma patients or patients with dangerous injuries. The emergency department includes two waiting rooms, one for adults and the other for minors, which are used simultaneously for the triage process by a triage nurse.
Besides, there are five rooms for short stay hospitalization including 11 beds, two rooms for sewing and care treatment, plus one room for orthopedic. Patients with serious circumstances may bypass triage to be directed to the vital emergency reception, and then treated directly by a surgeon in the surgical unit; on contrary low and medium acuity patients are sent to the waiting room to be classified by a nurse depends on their conditions.
Patients are classified into five categories based on their states (critical, emergent, urgent, non-urgent, and minor) using the Emergency Severity Index (ESI). Acuity level 1 is the most dangerous, patient need immediate treatment, whereas level 5 is least urgent and often represents clinical type patients. Critical patients have the highest priority in the emergency department, and the system should permanently be ready to accept new critical case-patients.
Emergent and urgent Patients (Acuity levels 1,2) patients must be served in average time less than 15 minutes from arrival time, as for those with low-acuity they can wait for a long time or leave without been seen which a common issue is. Fig. 1 show the physical structure of the case study ‘ED’.

hospitalization room for pediatric
care room for pediatric
pediatric consultation
medical office general practitioner
staffs administrative office
room for internal doctors
osteopath room
hospitalization beds
о

Care room for adules
sewing room
reanimation
room
surgical block
Other services
Fig.1. The physical structure of Chalabi Abdelkader Emergency Department
-
B. Workflow model for patient admission process
Fig. 2 represents a flowchart of the workflow of the patient admission process at the selected ‘ED’. It shows the possible patient trajectories inside the emergency department. Workflow provides a basis for the discrete event simulation model. The model is depicted based on the existent patient flow of the studied system. Patient arrival is either walking or by the ambulance, then patients are classified on arrival by a triage nurse. The triage nurse effects an initial evaluation of the patient state, based on their signs and symptoms. Next, according to ESI, she classifies the patient in one of the 5 severity levels. A patient in level 1 have a critical state and should be treated immediately while a patient in level 5 is, in fact, a clinical patient with a more stable state. After this step, we figure two typical patient trajectories, patients with severity level 1 and 2 carry to vital emergency (VE) to be treated by a surgeon, whenever the surgery success, patient will be moved to short-stay hospitalization unit (SSHU) for a duration less than 24 hours, the patient transferred to another service. Otherwise, the patients with the non-critical state are directly consulted by a nurse and then by a general practitioner (GP) before being referred to the short-stay hospitalization unit of the emergency department to monitor their states. At the medical consultation stage, the GP will decide whatever patient needs any supplementary tests; otherwise, she will be discharged if her state is non-urgent (ESI is 4 or 5). The occurrence at which these different paths occur in the model is decided probabilistically, based on historical data of the two years (2015, 2016) retrieved from the emergency department records.
-
C. Data collection phase
One of the essential phases before moving on to any upcoming step is data collection. It is one of the important and harder phases due to the miss, and absence of complete data in most Algerian hospitals. Authors have based on ‘ED’ archives of the two years (2015, 2016), besides interviews with staffs to collect the necessary data.
Authors present the collected data in the form of graphical charts to facilitate its readability. We tried to separate adult and pediatric statistics for more visibility. Fig. 3 shows curves of adults consultation number per month for the two years (2015, 2016), where Fig. 4 is for pediatric. We can observe that the average consultation number for pediatric is less compared with an adult, which they have the averages of 2300 and 5000 patients/month, respectively.
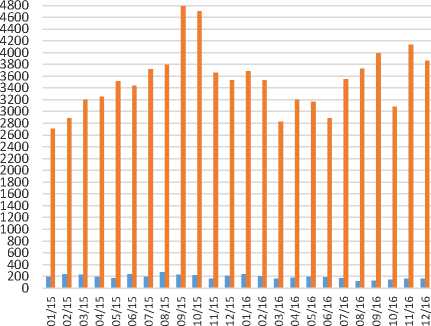
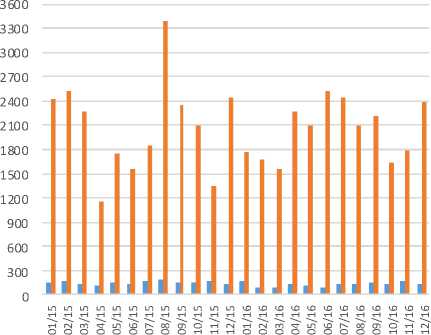
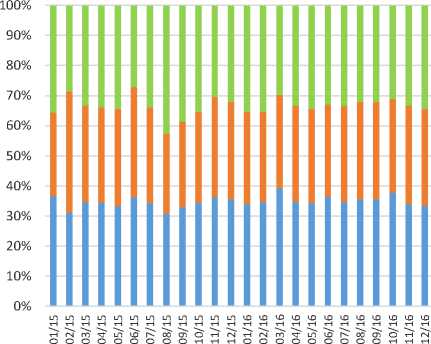
Figs. 5 and 6 present histograms of the numbers of treated patients, and hospitalization for adults and pediatrics, respectively. The average number of hospitalization for adults during the two years is about 180 patients per month, which is the twice of pediatrics admitted hospitalization number. Fig. 7 shows the percentages of consultation by categories, which we believe that it will be helpful for future use.
One of the interesting points, when we study such as system, is time and operations durations, which reflect the performance and the quality of the current state of the system. Table 1 shown the important durations at the different stages of the patient admission process. We can observe that the total time spent by the patient in ‘ED’ has an average of 210 minutes, which is a long period for non-urgent and minor cases.
The extended time of LOS is caused in the first place by the long waiting time at the doctor, and in the second place by the long duration of complementary tests, which it has an average duration of 50 minutes. After a deep analysis and investigation, we found that the longer duration of waiting time at the doctor and complementary tests are caused by the lack of doctors and the absence of a radiology material, respectively.
Table 1. Operations duration at the different stages of patient admission process
|
ED key performance indicators (KPIs) |
Duration (minutes) |
|
Average patient total length of stay |
210 |
|
Nursing consultation waiting time |
7 |
|
Nursing consultation time |
6 |
|
Medical examination waiting time |
130 |
|
Doctor examination time |
12.5 |
|
Average complementary tests time |
50 |
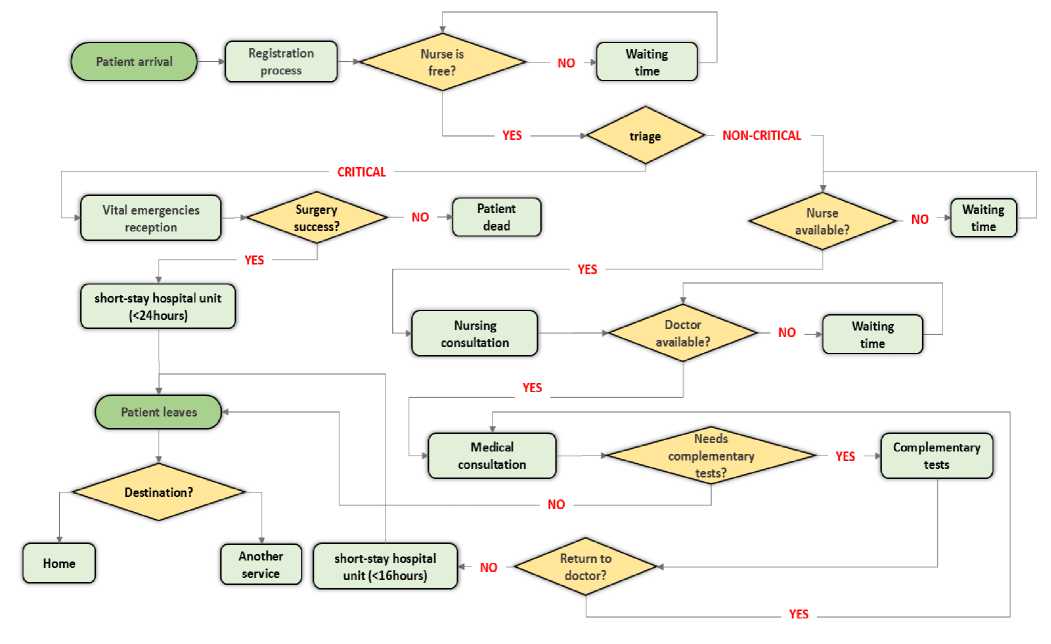
Fig.2. Patient flowchart of the workflow admission process
500 0


• Year 2016 • Year 2015
Fig.3. The number of adult consultation per month during two years (2015, 2016)


—Year 2016 —Year 2015
Fig.4. The number of pediatric consultation per month during two years (2015, 2016)
■ Number of hospitalizations
■ Number of treatments
Fig.5. The number of hospitalized and treated patients from January 2015 to December 2016 (Adults)
■ Number of hospitalizations ■ Number of treatments
Fig.6. Number of hospitalized and treated patients from January 2015 to December 2016 (Pediatrics)
■ Males
■ Females
■ Pediatrics
Fig.7. Percentage of consulted patients by category from January 2015 to December 2016
D. Simulation model
One of the crucial phase before building a simulation model is data collection; it is one of the important and necessary phases. Authors have based on ‘ED’ archives of the two last years (2015, 2016) and interviews with staffs to collect the necessary data, and then we model these data with statistical distributions in order to use them as input parameters for the simulation model (see Table 2).
The simulation model was built based on a depth understanding of the current ‘ED’ processes. The model was constructed by the simulator Rockwell Arena v15. Table 3 shows the descriptions of the basics components of the used simulator. While Fig. 8 shows the design of the simulation model in Rockwell Arena v15 simulator.
The model encompasses seven processes (registration, triage, nursing examination, medical examination, complementary tests, surgical operation, patient hospitalization), each of those require a dedicated set of resources. Patient flow from process to another is handled using decision components, each decision is implemented based on the probabilistic model extracted from the collected data. The simulation of patient arrival is realized using an entity generator labeled “Patient Arrival” (see Fig. 8). The generation follows an exponential distribution, which is effective to model the arrival process in such a case.
The proposed model was validated by domain experts, as well by conducting many simulation instances, to compare the results with the real data based on a set of ‘ED’ keys performance indicators. In order to make our model as close as possible to reality, we run the simulation for a duration of one month with 10 replications for each adjustment. The obtained results are the average outputs of those replications.
Table 2. Simulation parameters
|
Parameters |
Distribution functions of random variables(minutes) & probability measurement |
Description |
|
Patient arrival rate |
Exp(8.61) |
Exponential distribution is used with time between two patients arrivals has a mean of 8.61 minutes. |
|
Registration time |
Uniform(1,2) |
The registration time from the arrival until the entrance to the waiting room. |
|
Triage time |
Uniform(1,3) |
triage operation has an average time between 1 to 3 minutes |
|
Nursing examination time |
Uniform(4,8) |
The time of examination by a nurse. |
|
Medical examination time |
Uniform(7,15) |
doctor visit duration takes an average time between 7 to 15 minutes |
|
Complementar y tests durations |
Triangular(15, 45, 90) |
Duration of complementary tests including (radiology, lab test, scanner) |
|
Surgical operation time |
Uniform(60,180) |
the average time in operating room has uniform distribution between 60 and 180 minutes |
|
Successful surgery rate |
97% |
97% of surgery operation success. |
Table 3. Description of the common used graphical components under Rockwell Arena v15 simulator
|
Rockwell Arena v15 Graphical Components |
Description |
|
Create 1 |
Used to generate the tokens, based on a parameterized expression (e.g. [Random(expo), 8.61]) |
|
----------------------------------------------- 1 ■ Process 1 •• 0 |
The entity used to represent a specific process, which delayed every token passed through it by a defined duration (constant, expression). It includes also a queue. |
|
Tn* Decide 1 ► |
Decision entity used to change the flow direction based on a well-defined percentage. |
|
•H Dispose 1 W i |
This entity has a role of an end point of all system tokens, mainly used as a statistic data collector. |
Table 4. Comparison between the real data and simulation results of the system
|
ED key performance indicators (minutes) |
ED collected data |
Simulation data |
|
Average patient total length of stay |
210 |
210.82 |
|
Nursing consultation waiting time |
7 |
6.83 |
|
Nursing consultation time |
6 |
5.99 |
|
Medical examination waiting time |
130 |
138.29 |
|
Doctor examination time |
12.5 |
12.49 |
|
Average complementary tests time |
50 |
50.02 |
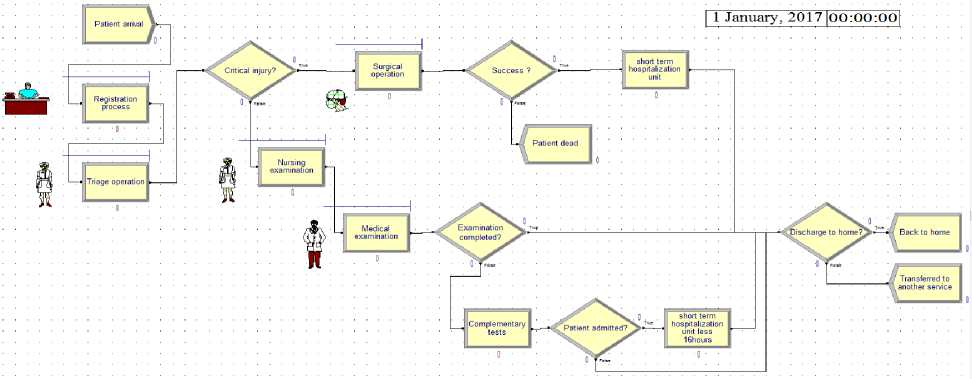
Fig.8. Simulation model of the case study ‘ED’ under the simulator Rockwell Arena v15
-
IV. Improvement solutions
After identifying the influence factors on the patient long length of stay at the emergency department, we proposed some solutions to reduce the effect of longer length of stay and the waiting time of patients, by evaluating two improvements adjustments plus merging both in a third one, as follows:
-
• Adding a nurse with the doctor.
-
• Including radiology.
-
• Adding (nurse + radiology)
Then we used Rockwell Arena simulator to simulate each of the proposed changes, for a duration of 30 days. Results are calculated based on the average simulation output of 10 replications for each scenario. Table 5 shows the impact of the proposed adjustments for the three scenarios compared to the current state of the system.
Table 5. Simulation results of the proposed solutions
|
ED key performance indicators (minutes) |
Benchmark scenario (current system) |
Scenario 1 (adding a nurse) |
Scenario 2 (adding radiology) |
Scenario 3 (adding nurse, radiology) |
|
Average patient LOS |
210.82 |
201.17 |
191.37 |
180.99 |
|
Average total waiting time |
144.81 |
132.59 |
142.89 |
132.47 |
|
Nursing examination waiting time |
6.83 |
6.79 |
6.80 |
6.65 |
|
Nursing examination time |
5.99 |
6.00 |
6.00 |
6.01 |
|
Medical examination waiting time |
138.29 |
125.92 |
135.76 |
125.81 |
|
Medical examination time |
12.49 |
12.39 |
12.50 |
12.48 |
|
Average complementar y tests lost time |
50.02 |
50.12 |
29.98 |
30.04 |
-
V. Results Discussion
As is shown in Table 5, for each suggested scenario we have calculated the ‘ED’ key performance indicators, which includes the LOS, waiting times and processes times. Each solution has a partial impact on the system. In the following, we going to discuss for each solution the rate of reached improvement compared with the current state of the system, results discussion will be presented based on the different ‘ED’ KPI, as follow:
-
1. The total length of stay: apparently, scenario 1 (adding a nurse) has a partial improvement on the system with minimization of 4.57%, while
-
2. Waiting times: scenario 1 and 3 provides a reduction of 8.43% in medical examination waiting time, while scenario 2 has a minor reduction (less than 2%). For the total waiting time, scenario 3 offers a minimization of 8.52%, which is acceptable for improving the system performances.
-
3. Operation durations: scenario 1 has a minor impact on doctor consultation duration. Contrary, adding radiology (scenario 2) has a big effect on the minimization of the total operation time by minimizing the average complementary tests duration by 40%.
scenario 2 presents an acceptable reduction of 9.22% from an average of 210.82 to 191.37
minutes. Scenario 3 is the most effective in term of LOS reduction; it provides a minimization of 14.14%, its implementation will offer a significant benefice on the enhancement of the care quality.
As we have seen the implementation of Scenario 3, will have the highest improvement on the system performance at the different level of the patient admission process. While its implementation cost will be higher than the other proposed solutions.
-
VI. Conclusion
In this paper, a general approach is proposed for the improvement of hospital emergency department. We started with the analysis and the collection phase of the necessary data from the system. Then, we modeled patient flows using a Workflow. An important phase, which is the calculation of probabilities of the different patient alternatives inside the ‘ED’, is realized in the phase of simulation model building. Then, we have used the simulator Rockwell Arena v15, for the evaluation of the different proposed improvement adjustments, based on the noticed system lacks. We conclude that adding a nurse and radiology, which is missed in the current system, is the efficient choice for ‘ED’ managers to improve their system. Depending on the budget, managers can implement any of the proposed solutions. On the other hand, we found that the increase of the number of the non-urgent patient at the emergency department has a relation with the negligence of clinics by the population, which it has an observed influence on longer waiting time. A public awareness campaign will be useful to distinguish the difference between EDs and clinics, and to get an answer to the question “should I go to an emergency department or to a clinic?”. As a perspective, studying the cost of each proposed solution, and the possibility of its implementation in reality, will increase the opportunity of its application in real life.
Список литературы Modeling and optimizing patients’ flows inside emergency department based on the simulation model: a case study in an algerian hospital
- Richards JR, van der Linden MC, Derlet RW. Providing care in emergency department hallways: demands, dangers, and deaths. Advances in Emergency Medicine. 2014:7pp.
- Hsia RY, Nath JB, Baker LC. California Emergency Department Visit Rates For Medical Conditions Increased While Visit Rates For Injuries Fell. Health Affairs, 2015, 34(4):621-626.
- Elder E, Johnston A.NB, Crilly J. Review article: Systematic review of three key strategies designed to improve patient flow through the emergency department. Emergency Medicine Australasia, 2015, 27:394-404.
- Jennings N, Clifford S, Fox AR, O’Connell J, Gardner G. The impact of nurse practitioner services on cost, quality of care, satisfaction and waiting times in the emergency department: A systematic review. International Journal of Nursing Studies, 2015, 52(1):421-435.
- Saghafian S, Austin G, Traub SJ. Operations research/management contributions to emergency department patient flow optimization: Review and research prospects. IIE Transactions on Healthcare Systems Engineering, 2015, 5(2): 101-123.
- Di Somma S, Paladino L, Vaughan L, Lalle I, Magrini L, Magnanti M. Overcrowding in emergency department: an international issue. Internal and Emergency Medicine, 2015, 10(2): 171-175.
- Goyal M, Jadhav AP, Bonafe A, Diener H, Pereira VM, Levy E, Baxter B, Jovin T, Jahan R, Menon BK, Saver JL. Analysis of Workflow and Time to Treatment and the Effects on Outcome in Endovascular Treatment of Acute Ischemic Stroke: Results from the SWIFT PRIME Randomized Controlled Trial. Radiology, 2016, 279(3):888-897.
- Weigl M, Beck J, Wehler M, Schneider A. Workflow interruptions and stress atwork: a mixed-methods study among physicians and nurses of a multidisciplinary emergency department. BMJ Open, 2017, 7(12):1-7.
- Joshi V, Lim C, Teng SG. Simulation Study: Improvement for Non-Urgent Patient Processes in the Emergency Department. Engineering Management Journal, 2016, 28(3):145–157.
- Oh C, Novotny AM, Carter PL, Ready RK, Campbell DD, Leckie MC. Use of a simulation-based decision support tool to improve emergency department throughput. Operations Research for Health Care, 2016, 9:29-39.
- Kim BBJ, Delbridge TR, Kendrick DB. Adjusting patients streaming initiated by a wait time threshold in emergency department for minimizing opportunity cost. International Journal of Health Care Quality Assurance, 2017, 30(6):516-527.
- Kaushal A, Zhao Y, Peng Q, Strome T, Weldon E, Zhang M, Chochinov A. Evaluation of fast track strategies using agent-based simulation modeling to reduce waiting time in a hospital emergency department. Socio-Economic Planning Sciences, 2015, 50:18-31.
- Ozcan YA, Tànfani E, Testi A. Improving the performance of surgery-based clinical pathways: a simulation-optimization approach. Health Care Management Science, 2017, 20(1):1-15.
- Azadeh A, Ahvazi MP, Haghighii SM, Keramati A. Simulation optimization of an emergency department by modeling human errors. Simulation Modelling Practice and Theory, 2016, 67:117-136.
- Abo-Hamad W, Arisha A. Simulation-based framework to improve patient experience in an emergency department. European Journal of Operational Research, 2013, 224:154-166.
- Keshtkar L, Salimifard K, Faghih N. A simulation optimization approach for resource allocation in an emergency department. QScience Connect, 2015, 8:1-11.
- Zeinali F, Mahootchi M, Sepehri MM. Resource planning in the emergency departments: A simulation-based metamodeling approach. Simulation Modelling Practice and Theory, 2015, 53:123-138.
- Gatewood MO, Wemple M, Greco S, Kritek PA, Durvasula R. A quality improvement project to improve early sepsis care in the emergency department. BMJ Quality & Safety, 2015, 24(12):1-9.
- Laker LF, Torabi E, France DJ, Froehle CM, Goldlust EJ, Hoot NR, Kasaie P, Lyons MS, Barg-Walkow LH, Ward MJ, Wears RL. Understanding Emergency Care Delivery through Computer Simulation Modeling. Society for Academic Emergency Medicine, 2017, 25(2):17pp.

