Modeling changes in climate indices of Arctic Regions (by the example of Arkhangelsk)
")
Author: Larisa I. Zelenina, Svetlana I. Fedkushova
Journal: Arctic and North @arctic-and-north
Section: Ecology
Article in issue: 17, 2014.
Free access
Changes in climate indices by the example of Arkhangelsk have been analyzed.
Climate model, climate scenario, climate forecast, computer model, trend model, the adequacy of the model, regional climate models
Short address: https://sciup.org/148319812
IDR: 148319812 | UDC: 519.233.5
Text of the scientific article Modeling changes in climate indices of Arctic Regions (by the example of Arkhangelsk)
As a result of materials investigation of meteorological observations in all the regions of the world it is established, that climate is not considered to be permanent, but it is put into changes. According to estimates of some authors, based on these investigations, from the beginning of the 20th century increase of average yearly temperature in a surface layer through the territory of Russia comprised from 0,9 to 1,1°С [1, p. 10].
Climatic indexes of the region
For checking of this fact we have collected and analyzed data on changes of average yearly temperature, the basis for research was chosen Arkhangelsk. Researches are based on archival data from web-sites of Hydrometeorology and Environmental Monitoring Agency and meteorological center1 2. For comparison were taken data on climate in 2002 and 2013.
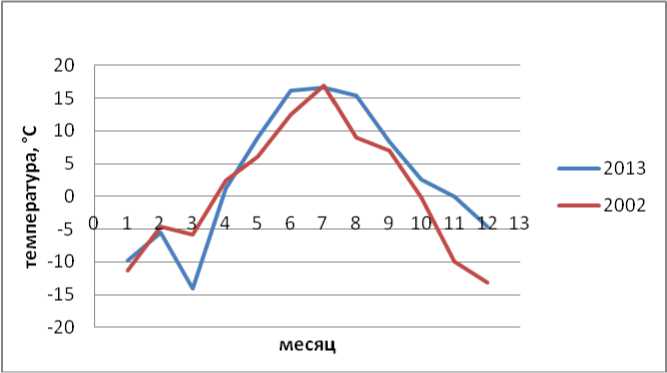
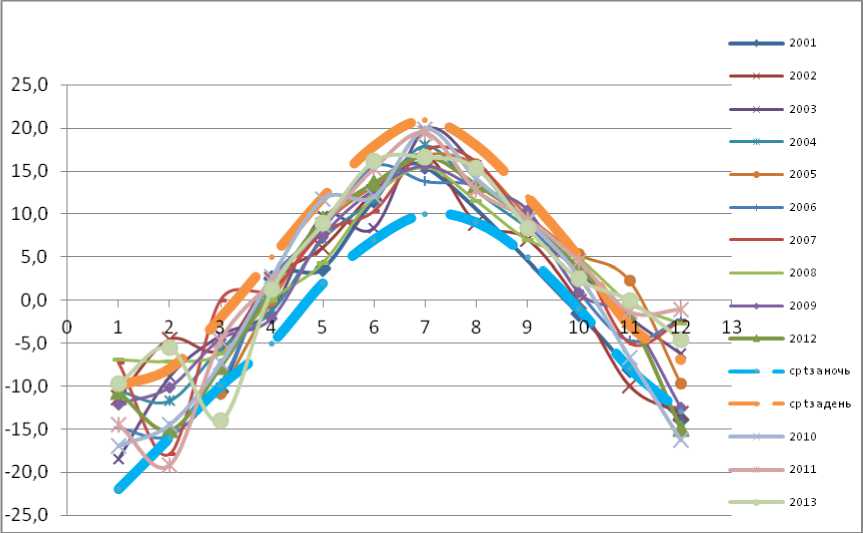
Pic. 1. Diagram of monthly average temperatures in Arkhangelsk
According to the analysis of average monthly temperature it was conducted monthly ranging of years on temperature conditions. Temperature leaders appeared to be years mostly after 2005. Inside the top ten of the warmest years were years from the whole period of investigation. In the year 2010 we noticed the biggest number of temperature peaks: in April, May, July and December. The coldest years were mostly before 2006, but February 2011 as the coldest is on the first place.
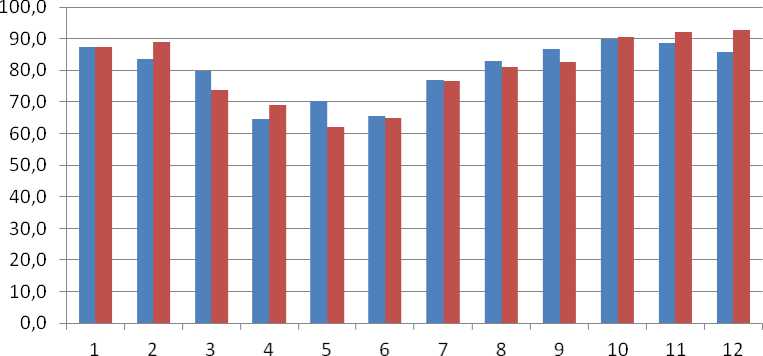
Climate is much influenced by moisture gradient. Below we can see actual value of average relative degree of humidity for Arkhangelsk in years 2002 and 2013. The highest relative degree of humidity is noticed in winter period and in late autumn (81-92%), the lowest in April—June (63-
69%).
■ 2002
■ 2013
Pic. 2. Changes of relative degree of humidity, Arkhangelsk
By that, monthly analysis of data showed, that the lowest humidity was noticed in May, 2013 (62%), the highest (93%) — in November 2003 г.
Ranging of average monthly humidity estimated, that there are many years with above normal humidity: 10 years in January and October. With number of below normal humidity is 8
years in February and 7 in March, April and December.
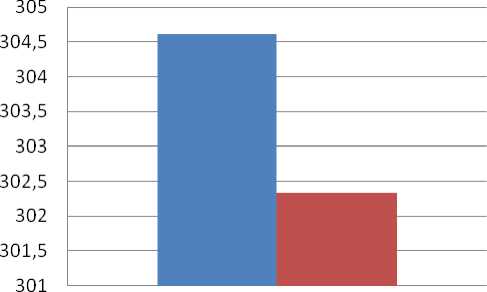
It was also investigated changes of oxygen content of atmospheric air (year average).
■ 2002
■ 2013
Pic. 3. Content of О2 in the air, Arkhangelsk
According to this estimates we can make a result on reduction of oxygen in the air in practically 0,7%. In such a way, tendency to warming and moisturization of climate is marked.
Based on experimental data of temperature changes in Arkhangelsk over the period since 2001 to 2013 there were calculated average temperatures monthly (pic.4).
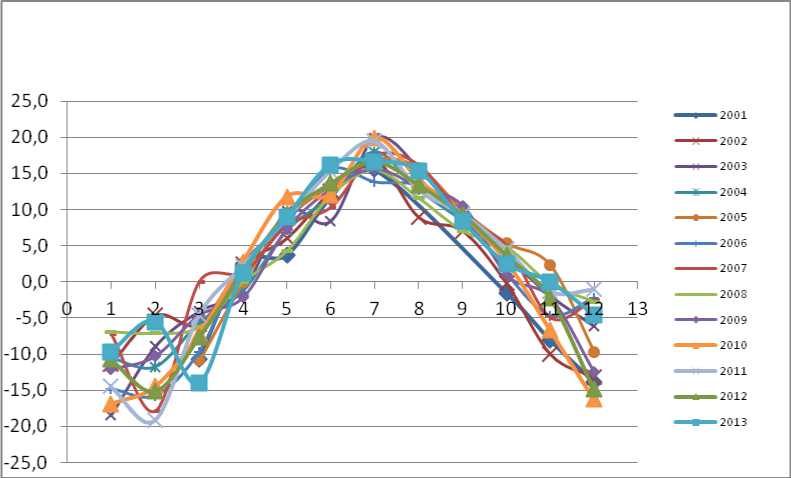
Pic 4. Diagram of average monthly temperatures in Arkhangelsk
To explore changes of average monthly temperatures of Arkhangelsk, climatic data of monthly average night and daily temperatures taken from the web-site of Federal Service of Rus- sia on Hydrometeorology and Monitoring of the Environment were applied to this diagram.
Pic. 5. Derivations from the norm of monthly average temperatures
In such a way, we can see according to the picture 5, that during the period 2001 till 2013 the average monthly temperature in Arkhangelsk has been changing within the fixed climate value, which is characteristic for this city. Exceptions were anomalous values: January 2007, 2008; February 2002, 2011, 2013; March 2002, 2013; November 2002, 2005, 2013 and December 2010, 2011, 2013. The year 2013 featured all anomalies.
In picture 6 we can see seasonal changes of average temperature.
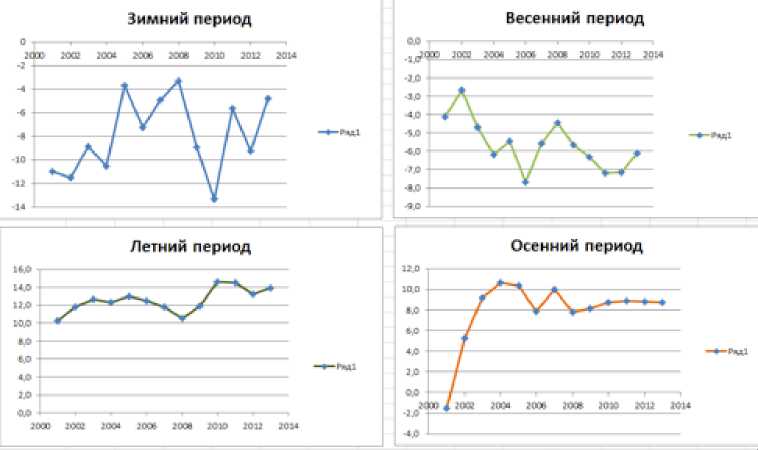
Pic. 6. Seasonal changes of average temperatures
Summary table of data of average yearly changes of temperature for Arkhangelsk for the period 2001—2013 was discharged. Its results are introduced in picture 7.
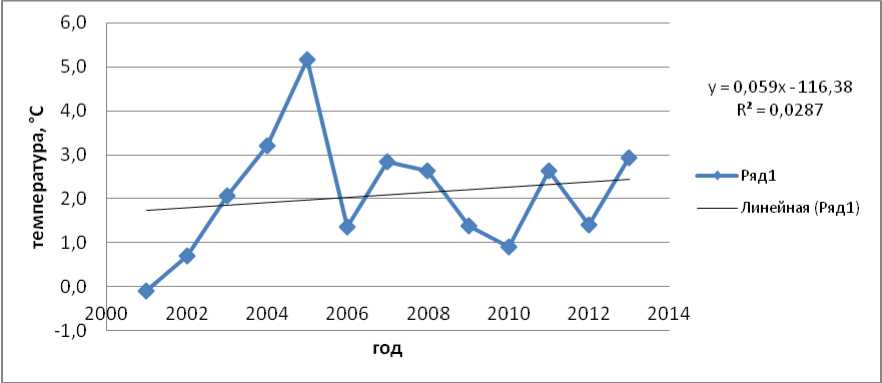
Pic. 7. Changes of average yearly temperature in Arkhangelsk
Trend line gives evidence to rise of yearly average temperature.
Based on time series there was created a Brown model with adaptive parameter of adaptation:
у(0 = 4>('-1)М('-1)'£е (0 = у(0 - ЯО
Л(0 = Л^-1) + 40-1) + 0-Р2)-в(04(r) = 4('-D + (i-0)2-e(O
«, = М
К, = —,Если -К( -» 0,=> система • адекватна
Ег=0-Т)-Ем+УЕг^ =(i-y )•£;_! +у -|eJ
Following parameter values were found: Model is considered to be exact and adequate:
=2,28, E=14,6, =0,613.
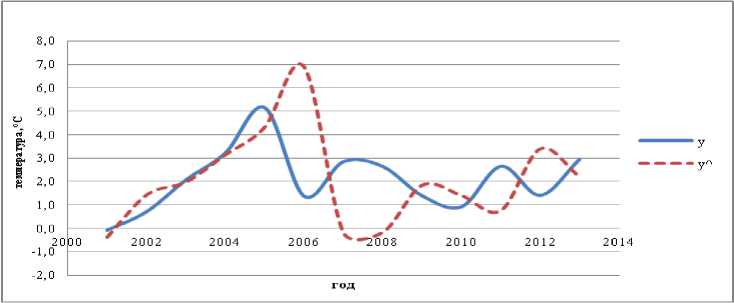
Pic. 8. Changes of average year-round temperature, Arkhangelsk
Brown model with adaptive parameters of adaptation
Based on this model an interval and point forecasts for 3 years in advance were formed.
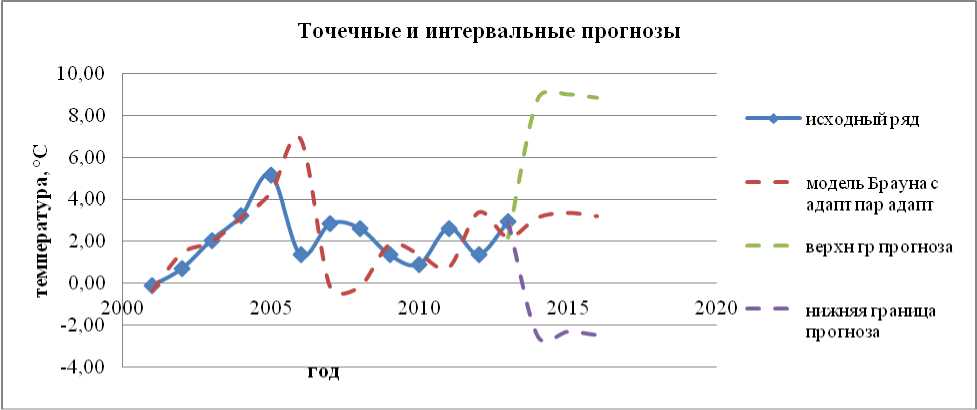
Pic. 9. Point and interval forecasts of average year-round changes for Arkhangelsk
The result of analysis of average year-round changes of humidity for Arkhangelsk city for the period 2001—2013 is shown in picture 10.
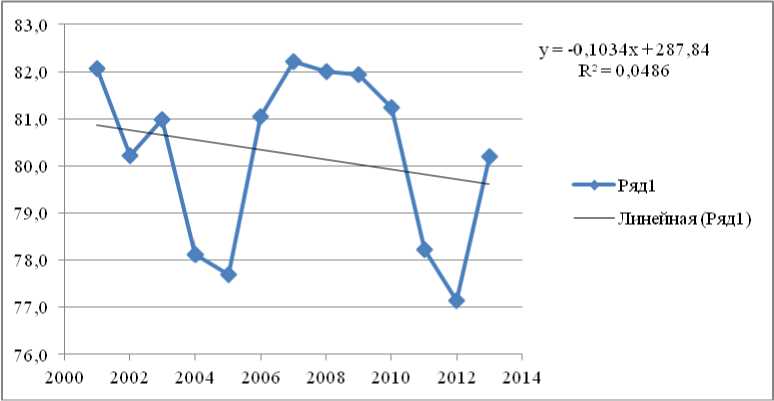
Pic. 10. Changes of average year-round humidity, Arkhangelsk
Trend line speaks for lowering of average year-round changes of humidity for 0,9% during the overviewed period of time (12 years).
Based on methods of stochastic simulation a multiplicative model for given data was created, according to which it was also created a forecast of average year-round humidity changes for 3 years in advance:
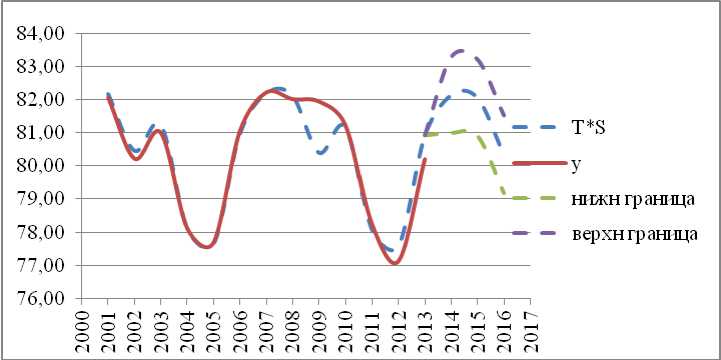
Picture 11. Point and interval forecasts of average year-round changes for Arkhangelsk
In such a way, to the year 2017 humidity for geographical space of Arkhangelsk will reduce for 2% in comparison with 2001.
To confirm conclusions reached on forecast climate changes with the help of service of web-site «FSBI Institute of global climate and ecology of Roshydromet (Hydrometeorology and Environmental Monitoring Agency) and the RAS (Russian academy of sciences) there was created a point forecast of climate data changes to the year 2025.
Results of program analysis can be seen in following pictures:
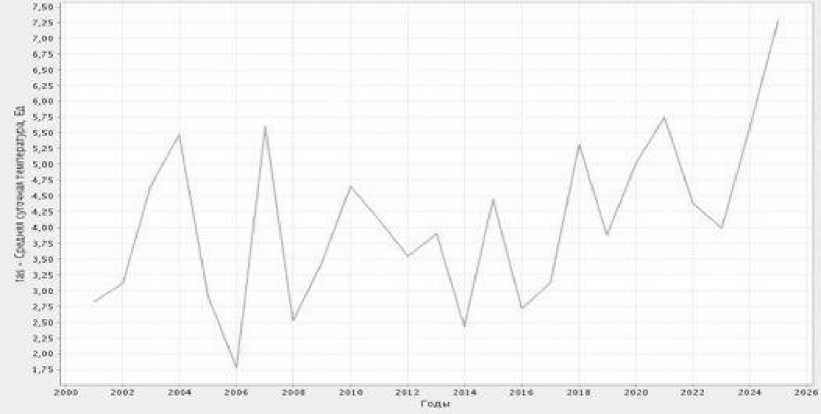
Pic. 12. Model: INM - IVM RAS, anthropomorphic scenario: commit, climate average daily temperature
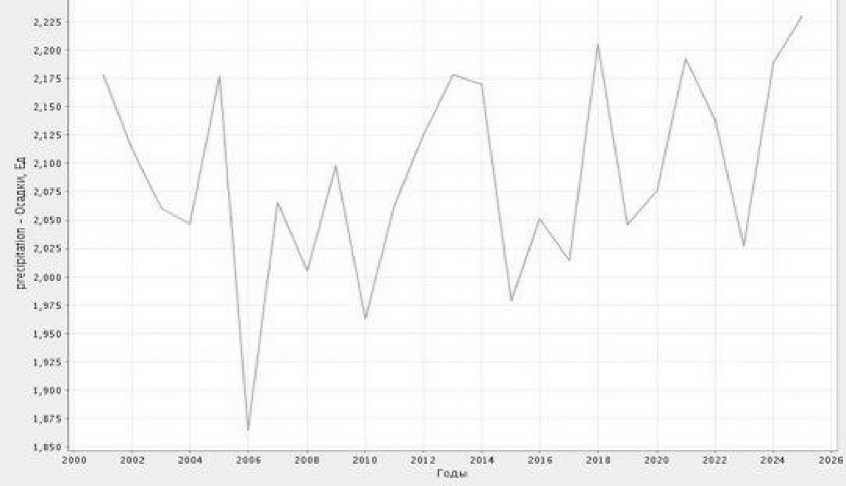
Pic. 13. Model: INM - IVM RAS, anthropomorphic scenarion: commit, climatic variable of precipitation
Conclusion
In such a way, created models of average temperature changes in this region and results of regional model of Institute of global climate and ecology of Roshydromet (Hydrometeorology and Environmental Monitoring Agency) and the RAS (Russian Academy of Sciences) let us make con-elusions about the increase of average daily year-round temperature for 0,1 °C a year, about the increase of amount of precipitation for 0,002 mm and reduction of atmosphere pressure for 1,85 points.
Consequently, climate of the European North, in particular of Arkhangelsk region is changing, and it anyway will influence economic life of the region.
References Modeling changes in climate indices of Arctic Regions (by the example of Arkhangelsk)
- Dimnikov V.P. Problemy modelirovaniya klimata i ego izmeneniy [Problems of modeling climate and its changes]. Moscow, Institute of computing mathematic of the RAS, 2006, 27 p.
- Zelenina L.I., Fedkushova S.I. Prognozirovaniye i posledstviya izmeneniya klimata Arkticheskogo regiona [Forecasting and effects of climate changes in Arctic region]. Arctic and North, 2012, no. 5, pp. 109—113.
