Modeling economic security risks for Russian regions in the context of sanctions pressure

Author: Oleg A. Golovanov, Aleksandr N. Tyrsin, Elena V. Vasilyeva
Journal: Economic and Social Changes: Facts, Trends, Forecast @volnc-esc-en
Section: Public administration
Article in issue: 5 т.16, 2023.
Free access
The article investigates the problem of ensuring Russia's economic security in the conditions of increasing sanctions pressure. In order to assess and analyze emerging risks, we propose a multifactorial model that considers the economic security of Russian regions as a complex multidimensional system influenced by various interrelated risk factors. We use a list of indicators for monitoring and assessing Russia's economic security, approved by Presidential Decree 208, dated May 13, 2017. For the purpose of risk modeling, we establish two-level threshold values (“soft” and “hard”) of indicators based on expert assessment. The information base of the study includes data of the Federal State Statistics Service for Russia, as well as data in the context of constituent entities of the Ural Federal District by month for the period from January 2016 to March 2023. According to the calculation results, the aggravation of sanctions imposed by unfriendly countries has negatively affected the economic security of Russia as a whole and that of constituent entities of the Ural Federal District. Within the analyzed period, the risks created are significantly lower in comparison with the consequences of the COVID-19 pandemic, and they tend to decrease. Regional analysis shows that the most significant risk factor is the condition of agriculture, which has been significantly affected by the quarantine and sanctions restrictions imposed. Modeling economic security risks for Russian regions on the basis of the proposed approach in dynamics will help to promptly assess the current situation and put forward management recommendations in a timely manner, when economic security is compromised.
Economic security, risk analysis, probability of an unfavorable outcome, crisis, country, region, sanctions, pandemic
Short address: https://sciup.org/147242066
IDR: 147242066 | UDC: 338.14+332.142 | DOI: 10.15838/esc.2023.5.89.3
Text of the scientific article Modeling economic security risks for Russian regions in the context of sanctions pressure
The article was prepared in accordance with the research plan of the Institute of Economics of the Ural Branch of the Russian Academy of Sciences.
Since 2014, the sanctions pressure (financial, trade, economic and other restrictions) on the Russian economy by unfriendly countries has been increasing. According to the Economic Security Strategy of the Russian Federation for the period up to 2030, the use of such discriminatory measures is one of the main challenges and threats; therefore, it is especially important, in the context of aggravation of geopolitical contradictions with Western countries, to develop a set of measures to neutralize emerging risks. For this reason, it is necessary to study the risks of economic security in a regional context, given the significant heterogeneity of RF constituent entities and the specifics of the implications of sanctions restrictions for them.
Despite the rather long duration of the sanctions, as E.T. Gurvich and I.V. Prilepskiy point out (Gurvich, Prilepskiy, 2016), there is no consensus on the scale of their impact on the Russian economy not only on a quantitative, but also on a qualitative level. Moreover, the results of surveys and various calculations of effects demonstrate a wide range of assessments and are often contradictory. For example, in a World Bank report1 published in April 2023, Russia’s GDP is estimated to decline by only 0.2% at the end of the year, although in January the forecast for the fall was 3.3%. Such changes in the assessment of the impact of sanctions pressure are explained by the rapidly changing international situation, which adds its own adjustments. Obviously, at present the study of this problem is limited by too many unknown “variables”; therefore, within the framework of this article, the goal is to model the risks of economic security of Russian regions in the context of sanctions pressure.
The aim of the work is to describe a model of multifactorial risk in relation to the tasks of the monitoring on the example of assessing the economic security of Ural Federal District (UFD) regions under the conditions of sanctions pressure.
To consider economic security risks for the territory, scientific works use qualitative and quantitative assessment methods; both have their advantages and limitations. On the one hand, mathematical methods used for uncertainty analysis require a significant amount of data, which researchers do not always have (Soshnikova et al., 1999; Aven, 2019). On the other hand, the methods of qualitative analysis (method of expert assessments, SWOT analysis, ABC analysis, etc.) for the study of socio-economic systems admit a certain subjectivism (Vasiliev et al., 2015; Ilyenkova, 2016; Karanina, Maksimova, 2022; Benzaghta et al., 2021; Ginevicius et al., 2022). It is also worth noting the expert-statistical Bayesian approach used for scenario forecasting of territorial development (Bryant, Zhang, 2016; Graziani, 2020).
In this regard, we agree with (Mityakov, 2019; Lobkova, 2022) who point out that the most common approach to assessing economic security risks is to measure deviations of individual indicators from their established thresholds. Depending on the degree of the deviation, different levels (zones) of risk are determined. For example, V.K. Senchagov and S.N. Mityakov (Senchagov, Mityakov, 2011) use zone theory to rank normalized indicators by five risk zones (catastrophic, critical, significant, moderate risk, and stability). To assess the risks of economic security in the context of the digital transformation of the regional economy, E.V. Lobkova (Lobkova, 2022) applied the theory of fuzzy sets, according to which the selected indicators should be considered as corresponding or not corresponding to a certain level of economic security and risk with the use of quantitative boundaries. Within the framework of this approach, the assessment of economic security risks is reduced to the quantification of individual dangerous outcomes without taking into account the contribution of each factor in a multidimensional system; i.e. it is assumed that they are mutually independent, and the probability of their simultaneous occurrence is neglected. Adaptive filtering methods and time series models are commonly used in risk forecasting tasks (Lukashin, 2003; Devianto, Fadhilla, 2015; Liu, Yu, 2022).
Logical-probabilistic risk models also do not take into account the mutual dependence of risk factors (Solozhentsev, 2006; Cox, 2009). In recent years, copulas have been successfully used to model dependencies in enterprise risk management, finance, and insurance (Cherubini et al., 2004; Joe, 2014). However, finding a suitable copula structure is not a trivial task and requires large samples (Behrensdorf et al., 2019), which is difficult to implement in regional risk analysis tasks due to limited data.
We should note that risk factors are generally mutually dependent and can appear simultaneously, which leads to an increase in the impact of their occurrence. Therefore, the analysis of the economic security of such complex multidimensional stochastic systems as the economic security of Russia’s regions in conditions of limited data and the relationship of risk factors, becomes an urgent scientific problem, and its solution has theoretical and practical significance.
To analyze the socio-economic stability of a complex multidimensional system, we use the multidimensional risk model (Tyrsin, Surina, 2017). We define a group of the most informative risk factors Х 1 , X 2 , .„,Xm , that describe the disturbances of the system, associated with external and internal factors. Thus, we obtain a representation of the system in the form of a random vector X = (X 1 , X2,..., Xm ) with a certain probability density p x( x ), the components of which are risk factors.
Based on a priori information, we identify geometric areas of unfavorable outcomes, the boundaries of which are based on the threshold values of indicators obtained through expert assessment and the best values Q j , j = 1,2, .„, m in terms of safety. In the absence of a priori information about Q j we consider them equal to mathematical expectations Ц у = M[X y ] of the corresponding indicators X j , i.e. 9 j = ц , , j = 1,2, .„, m . In this case dangerous situations will be the cases of large and unlikely deviations of sample values xt j of any component X j relative to Q j and the probability of an unfavorable outcome of each of the components X j will be defined as follows:
P(Dj) = P(Xj G Dj) = P(Xj e Dj), Dj = [x: d- < x < d+), where d-, d+ — left and right boundaries of acceptable values, determined on the basis of expert assessments and limiting the area of favorable outcomes. In this case, d- < d*.
Let us introduce the lower b- and upper b + threshold levels of permissible deviations relative to values Q j as bj" = 9 j - d- and b j = d j - 9 j , while the corresponding areas of favorable outcomes D j for each component X j will be described by the range (9 - b j < x < b j + 9 j ).
If there is only the right boundary of acceptable values d j , then we consider d- = -от and
D j = [x: x < dj] = (x: x < b + + 9 j }, otherwise, when determining only the left boundary d- we obtain d j = +ot and D j = [ x: x > d - } = (x: x > 9 j - b - }. The expression d- = -от or d j = +ot means that the values of risk factor X j less than or more than Q j are as safe as X y (0 y ).
Next, it is necessary to generalize the definitions described above to take into account the mutual influence of the components on the occurrence of adverse outcomes by presenting them as a multidimensional area of dangerous situations (risk zone) D . D = R m \D, where D — area of favorable outcomes. Thus, from a geometric point of view, the optimal representation of the range of acceptable values D will be an m -axis ellipsoid of the following form:
—
D =
{ m
X = (xt, % 2 ,^, X m ): ^
)=1
-< bj
< 1
I
with the center at the point 0 ' = (9 ] , 9 2 ,..., 9 ^ ),
and V/ = 1,2, .„, m.
6 j ((ri/ + d^fl,
d j = —от v d * = +^, d- > —от л dj" < +от,
((b j + b+}/2, d j > ^»Xd^ < +ot, b j = b- , d + = +ot,
6/, d"= -ot.
Then, for a random vector X the probability of an unfavorable outcome will be as follows:
P(D) = P(XE D),
D =
|x = (X i , %2, ^, x m
m
):£
( x/ - 9^
¥
"f
Therefore, risk zone D will be the outer region of an m -axis ellipsoid, the semi-axes for each of the coordinates of which will correspond to onedimensional case D j and be equal to b j , respectively. Obviously, when the outcome does not lie on one of the axes, then event (X e D) can be realized in the absence of risk deviations in all the components (situations X e D and V j X j ^ D j are possible).
To estimate the single contribution of an indicator or a group of indicators to probability P ( D ), we introduce
P(D-) = P(D/D k ),
D - = |x " = (% ! ,_, X k-1 , x k+1 ,^, x m : 2 ™i^^^- > 1
where D- — area of adverse outcomes after excluding one-dimensional region D k corresponding to risk factor X k .
Then the absolute and relative change in the probability of an unfavorable outcome of a multidimensional system due to the addition of factor X k is as follows:
^P(Dk) = P(D) - P(D-), 5P(D k ) = ^P(D k )/P(D-).
The probability estimate P ( D ) is based on the use of the Monte Carlo statistical test method2. Let us explain the essence of this procedure. We assume that we have some sample of data represented by matrix X n x m , which we conditionally call the general population. We denote its probability density p x( x ). We must repeatedly generate new observations z , = (z t1 , ..., z im ) with distribution law p x( x ). Then the probability estimate P ( D ) will be equal to the frequency
M
P№ = -, where N – total number of generated observations zi (i = 1,..., N), M — number of outcomes when generated observation zk e D.
To reproduce sample Xnxm, it is necessary to know the distribution law of a multidimensional population. We will consider it Gaussian. First, the use of the normal distribution law relies on the central limit theorem3.
Second, such idealization is not so critical, and if there is any reason to believe that the probability densities of the components of a random vector X have more elongated tails, then this will practically not affect the number of outcomes M (for us, only the condition X e D is important).
Third, the general population in this case will relate to small samples, which makes it impossible even to approximate the distribution law of a random vector X .
Therefore, we will consider distribution law p x( x ) Gaussian. Then, to find its parameters, we estimate sample covariance matrix 2X = (,ач ) т х т and vector of average values (X 1 ,..., Xm) and consider them equal to the theoretical covariance matrix and the vector of mathematical expectations, respectively. The generation of a random vector Z = ( Z 1, ... , Zm ) is performed as follows:
ztk = Y^a-k^jUj + Xk, к = 1,..., m, i = 1, .„, N, where U 1, . , Um — mutually independent, normally distributed random variables with zero mathematical expectations and unit variances. Equating cov(Zk, Zt) = cov(Xk, Xt) = okl and solving the corresponding system of m nonlinear equations, we obtain the following formulas for calculating coefficients akj:
akl =
Z l—1 „ „ j=i a ij ak j
a il
■, l < k , k = 1, ^ , m ,
„ - L _v‘-1„2 ^kk I *^kk у ^kj .
Obviously, the distributions of random vectors X and Z coincide, i.e. p x( x ) = p z( x ). Therefore, we have convergence in the probability of sample distribution p ^ (x) of the generated model data to distribution p x( x ), and the required sample size for a given reliability can be determined using standard statistical criteria.
The use of covariance matrix Σ x for risk factors allows us to take into account the relationship between them, which distinguishes this mathematical model from the well-known risk analysis models.
Researchers at the Institute of Economics of the Ural Branch of the Russian Academy of Sciences (Kuklin et al., 2018) analyzed the risks to welfare in regions of the Ural Federal District, based on annual data for 2001–2016. However, a static version of risk analysis was considered here. It is of interest to transfer this approach to a dynamic option, which will help to conduct an ongoing risk monitoring based on monthly or quarterly values of socio- economic indicators, to assess the current situation in an operational mode and to form management recommendations in a timely manner, if there is a decrease in economic security in the regions.
Assessment data
The information base for the study of economic security risks includes the statistical data of the Federal State Statistics Service in the context of RF constituent entities by month from January 2016 to March 2023. The choice of the time interval is due to the presence of several crisis periods, and it will allow us to see a capacious picture of the instability of the systems under consideration. Table 1 presents a list of indicators used for risk modeling, compiled on the basis of indicators for monitoring and assessing Russia’s economic security, approved by the Presidential Decree 208, dated May 13, 2017. To ensure stability of the estimation of the covariance matrix, we chose eight factors, the impact of which on economic security turned out to be the most significant. We should note that in
Table 1. Indicators of economic security of the region and their threshold values
|
Symbol |
Indicator, measurement unit |
Threshold value |
|
|
“Soft” |
“Hard” |
||
|
X 1 |
Industrial production index, % compared to the corresponding month of the previous year |
not less than 89 |
not less than 85 |
|
X 2 |
Work performed by the type of activity “Construction”, % to the corresponding month of the previous year |
not less than 86 |
not less than 80 |
|
X 3 |
Retail trade turnover, in comparable prices, % to the corresponding month of the previous year |
not less than 90 |
not less than 85 |
|
X 4 |
Average monthly nominal accrued wages of employees of organizations, % to the corresponding month, adjusted for inflation* |
not less than 96 |
not less than 95 |
|
X 5 |
Registered unemployment rate, % |
not more than 4.6 |
not more than 6.0 |
|
X 6 |
Agricultural production index, % to the corresponding period of the previous year** |
not less than 93 |
not less than 90 |
|
X 7 |
Investments in fixed assets at the expense of all sources of financing, for the full range of economic entities, at comparable prices, % to the corresponding period of the previous year** |
not less than 86 |
not less than 85 |
|
X 8 |
Production index by the type of economic activity “Mining”, % to the corresponding month of the previous year |
not less than 85 |
not less than 80 |
|
* Recalculated taking into account the consumer price index. ** Interpolated from quarterly data. Source: own compilation. |
|||
the scientific literature (Serebrennikov et al., 2018; Pavlov, 2019; Anisimov, 2022) the composition of the approved indicators is criticized; proposals for its clarification are substantiated. For example, individual indicators are more likely to characterize welfare and progressive development, rather than risks. Nevertheless, for the purposes of our study, the use of its reduced version (eight out of 40 indicators) is substantiated by two reasons:
-
• presence of a fairly close correlation between many socio-economic indicators; therefore, risk analysis on the selected part of the indicators as a whole allows for an adequate assessment of economic security;
-
• at the regional level, some indicators from the list are not available, and some are not published promptly.
The sanctions pressure had a significant impact on such areas as construction, investment and mining; but when analyzing the risks of economic security in the regional context, the indicators characterizing the situation in these areas (Х2, Х7 and Х8), were not considered, which is due to several reasons. First, their monthly dynamics are not representative; a more accurate picture is provided by the annual values of the indicators, since the implementation of various projects in Russian regions is carried out on demand rather than on a regular basis. In this regard, a fairly stable picture is observed if we look at the average Russian values. Second, for certain regions, low values and dynamics in terms of construction, investment and mining may be conditionally acceptable. “Failures” in these areas below the threshold value for the region may not always mean the onset of risks; at the same time, from the standpoint of ensuring economic security at the national level, most likely, this is an indicator of deterioration. Third, the regions are part of the country as a system, and taking into account the division of labor, different climatic, geographical, natural and other conditions for each region, part of the indicators for monitoring economic security turns out to be insignificant.
The proposed model of multifactorial risk allows us to vary the risk factors used; therefore, depending on the objectives of the study, the list of indicators presented in Table 1 can be changed.
A separate methodological task of our study is to determine the threshold values of economic security indicators. There are two approaches to the content of the term “threshold”. The first approach is to interpret threshold as an acceptable target value, examples of its use are the 1996 Economic Security Strategy of the Russian Federation4 and the 2020 Food Security Doctrine of the Russian Federation5; the second approach considers threshold as a limit value of an indicator widely used in the theory of economic security. Our study is based on the second approach, the threshold value is understood as a quantitatively determined value of the indicator, the excess of which signals the transition of the economic security of the territory to a qualitatively new state.
To establish the threshold value of economic security indicators, various methods are used: comparative analysis (comparison with the world or average Russian level) and expert assessments (Lobkova, 2022). In the scientific literature (Krivorotov et al., 2019; Lokosov, 2021), expert assessments are the most common way to determine threshold values. Thus, S.Yu. Glazyev and V.V. Lokosov set the threshold critical values based on the results of special studies, expert assessments and mathematical modeling (Glazyev, Lokosov, 2012). This method is also incorporated into the methodology for determining threshold values of the main (priority) risk factors and threats to the economic security of economic entities, developed by V.I. Avdiysky and V.K. Senchagov (Avdiysky, Senchagov, 2014). S.N. Mityakov, E.S. Mityakov and T.A. Fedoseeva (Mityakov et al., 2020) used expert assessments and international comparisons when choosing threshold values. A.B. Vissarionov and R.R. Gumerov (2017) consider that expert evaluation method has the following disadvantage: each indicator and its limit values are considered in isolation from other indicators and without taking into account historical analogies. Therefore, within the framework of our study, threshold values were selected by expert assessment based on the most striking crisis phenomena in Russia in 1998 and 2009. In addition, for a more accurate assessment of economic security risks, the methodology proposed by A.I. Tatarkin and A.A. Kuklin is considered (Tatarkin et al., 1997), which allows quantifying the presence, nature and level of risk manifestation and its dynamics, using a system of threshold values: from “soft” to “harder” ones.
Initially selected “soft” threshold values based on crisis values, poorly reflect the unfavorable situations of those regions in which the behavior of risk factors is more unpredictable and chaotic, and if the region goes beyond the threshold values in the same way, than on the national level this will not determine unambiguously the crisis phenomenon for the region. In this regard, the “hard” threshold values that were set depending on the degree of fluctuation of the risk factors under consideration were tightened and defined.
To study general trends in ensuring economic security, we tested the risk analysis model using data for Russia; and to identify the regional specifics of the impact of sanctions pressure we used data on RF constituent entities. The model is implemented using C++ programming language in Microsoft Visual Studio 2019. Figure 1 shows an assessment of the probability of Russia’s economic security indicators falling into the risk zone.
Figure 1. Assessing the probability of Russia’s economic security indicators falling into the risk zone
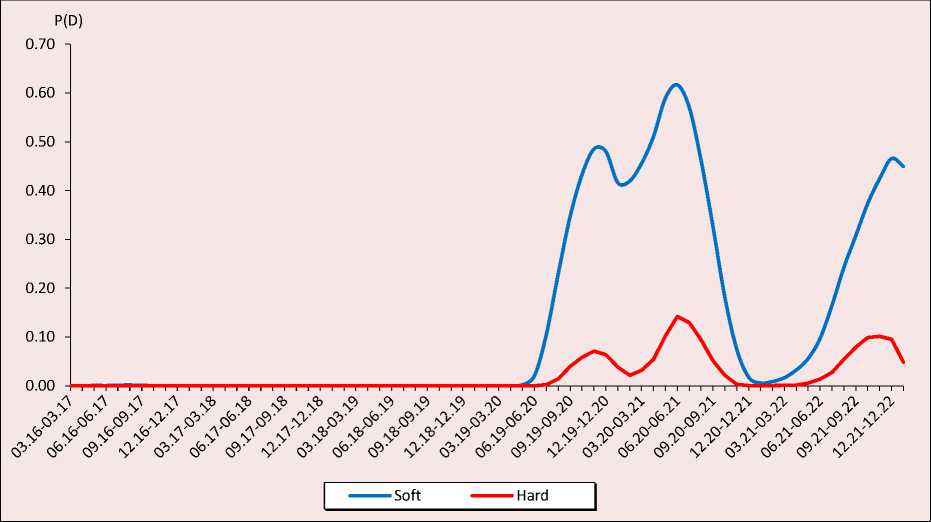
Source: own compilation.
Due to the fact that the study is based on monthly data, we clearly see random deviations and seasonal fluctuations, which can lead to a bias in the risk assessment. To exclude the influence of such outliers while maintaining the nature of the dynamics of indicators, the analysis used averaged values for six-month periods. Also, taking into account the principle of generating statistical tests of the Monte Carlo method using a covariance matrix, the study considered a period of 12 months in increments of 1 month, the choice of which is due to the number of indicators in the model.
Thus, the increase in the probability of falling into the risk zone in Figure 1 at the point 06.19– 06.20 (in the period from June 2019 to June 2020) can be interpreted as the inclusion in the analysis of the crisis month or the first manifestation of the deterioration of economic security in June 2020.
According to the dynamics of the assessment obtained, two periods of increasing risks to Russia’s economic security are clearly distinguished. The first period is associated with two waves of the COVID-19 pandemic and the introduction of restrictive measures, the second with increased sanctions pressure. Within the analyzed time period, the risks of the first period are more significant for ensuring the economic security of the country. Due to the fact that the “soft” threshold values are based on the crisis phenomena of the annual indicators of the Russian Federation, the peaks of the probability of falling into the risk zone in Figure 1 are much more pronounced for the “soft” values than for the “hard” ones.
The calculations show that the main factors enhancing the risks to Russia’s economic security during the pandemic were a decline in retail trade (X3), an increase in unemployment (X5) and a decline in mining (X8). The coronavirus pandemic and the measures taken to limit its spread have led to a significant reduction in retail trade in Russia. Thus, at the end of 2020, the index of physical volume of retail trade turnover amounted to 96.8%, with the most serious decline noted in April 2020 (78.0% compared to the same period in 2019). In the “pandemic” period, HSE researchers (Simachev et al., 2021) identified several stages of the retail crisis associated with the introduction of lockdowns, short-term hyped consumer demand, unpreparedness to increase online trading, and a decrease in effective demand.
By the end of 2020, the unemployment rate in Russia, calculated according to the ILO methodology, was 5.8%, which is an acceptable value and demonstrates the successful neutralization of the threats of a pandemic in the field of employment. At the same time, there was an unprecedented increase in registered unemployment, caused by the expansion of financial support to the unemployed through the employment service and the simplification of procedures for registering citizens with employment centers. Before the pandemic, no more than a quarter of the total number of unemployed were registered with the employment service, while in the second quarter of 2020, almost two-thirds received state support, and in the third quarter – almost three-quarters of the unemployed (Soboleva, Sobolev, 2021).
The restrictive measures introduced in Russia have led to a decline in demand for energy resources and, as a result, a reduction in the production of hydrocarbons. For example, in April 2020, gasoline production decreased by 20.1% compared to April 2019, and its sales at gas stations – by 40–50%6. In addition, the volume of mineral production fell sharply in May 2020 after the conclusion of a deal within OPEC+ to reduce oil production7.
In the second “sanctions” period, the following factors that led to increasing probability of deterioration of economic security were identified: a reduction in retail turnover ( X 3) and a decrease in wages ( X 4). In order to protect the domestic food market and stabilize prices the Government of the Russian Federation imposed restrictions on the export of a number of goods from Russia, in 2022; nevertheless, retail turnover in Russia decreased by 6.5% on average due to problems with logistics and changes in consumer behavior. The crisis phenomena had a noticeable impact on the labor market, but during the pandemic they were reflected in the growth of unemployment, while in the “sanctions” period they were manifested in the fall in wages, which is more typical for the Russian labor market. According to V.E. Gimpelson and R.I. Kapelyushnikov, such a nonstandard mode of adaptation of the labor market to shocks of different nature is called “Russian model”, when price adaptation dominates over quantitative (Gimpelson, Kapelyushnikov, 2015).
Obviously, depending on the specialization and socio-economic characteristics the impact of sanctions pressure for ensuring economic security varies significantly across Russia’s regions. According to different classifiers of regions, the Ural Federal District includes RF constituent entities that belong to different types. Yu.G. Lavrikova points out that the Ural Federal District is a median macroregion (occupies a median position in Russia) and has a unique territory, its composition has all types of regions (Lavrikova, 2017). Thus, the Kurgan and Tyumen oblasts8 represent the agrarian-industrial type, the Sverdlovsk Oblast – industrial and commercial type, Khanty-Mansi and Yamalo-Nenets autonomous okrugs – energy and resource type, the Chelyabinsk Oblast – industrial type.
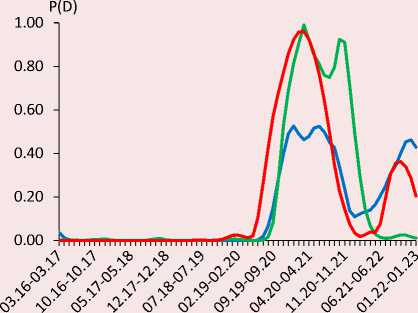
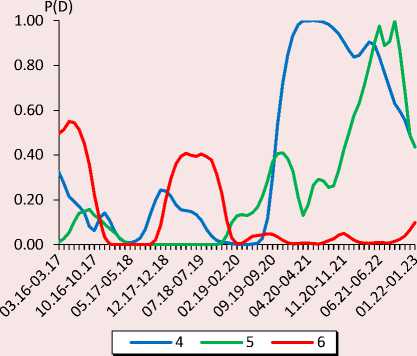
Figures 2 and 3 reflect calculations of the probability of the economic security indicators of Ural Federal District regions falling into the risk zone. Since the “soft” thresholds were set based on the annual national indicators, the calculations obtained on their basis reflect to a lesser extent the state of economic security of the regions, and, accordingly, describe the probability of an unfavorable outcome not so effectively (see Fig. 2). The results of the assessment using “hard” thresholds (see Fig. 3) exclude individual bursts of economic security risk, which may be a reaction of the region’s economy to insignificant disturbances. Since in the course of the study we consider monthly data (rather than annual data), such bursts have a sufficiently strong impact on risk assessment; in this case it is advisable to consider first of all an assessment with “hard” thresholds.
As a result of the analysis, it can be seen that in general the dynamics of economic security indicators and risk factors for individual regions of the district coincide. Tables 2 and 3 show grouped factors that have made the greatest contribution to the increase in the risk of economic security of the district’s regions.
Figure 2. Assessing the probability of economic security indicators of Ural Federal District regions falling into the risk zone for “soft” thresholds:
1 – Sverdlovsk Oblast, 2 – Chelyabinsk Oblast, 3 – Tyumen Oblast, 4 – Kurgan Oblast, 5 – Khanty-Mansi Autonomous Okrug, 6 – Yamalo-Nenets Autonomous Okrug
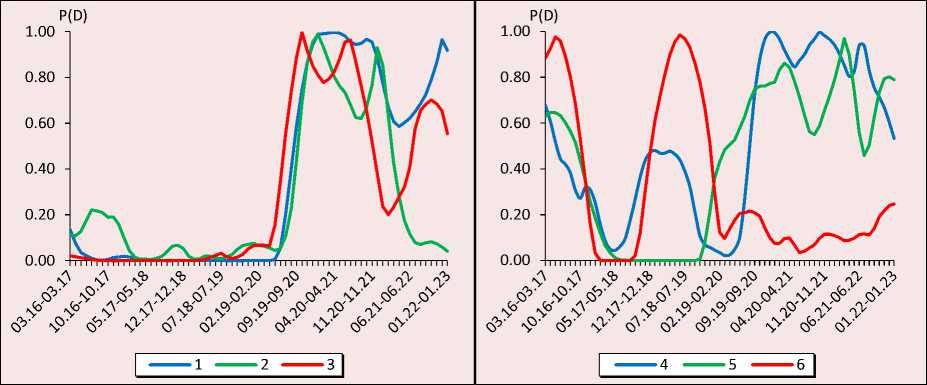
Source: own compilation.
Figure 3. Assessing the probability of economic security indicators of Ural Federal District regions falling into the risk zone for “hard” thresholds:
1 – Sverdlovsk Oblast, 2 – Chelyabinsk Oblast, 3 – Tyumen Oblast, 4 – Kurgan Oblast, 5 – Khanty-Mansi Autonomous Okrug, 6 – Yamalo-Nenets Autonomous Okrug
I — 1 ' 2 3]
Source: own compilation.
Table 2. Factors that have made the greatest contribution to increasing the risk to economic security in the Sverdlovsk, Chelyabinsk and Tyumen oblasts
|
Constituent entity of the UFD |
Crisis period |
|
|
2020–2021 |
2022 |
|
|
Sverdlovsk Oblast |
(0.23) (0.26) (0.14) |
(0.38) (0.19) |
|
Chelyabinsk Oblast |
(0.12) (0.1) (0.84) |
– |
|
Tyumen Oblast |
(0.42) (0.2) |
(0.19) |
|
Note (here and in Table 3 ): the absolute single (isolated, private) contribution calculated by formula (1) is given in parentheses. Source: own compilation. |
||
Table 3. Factors that have made the greatest contribution to increasing the risk to economic security in the Kurgan Oblast, Khanty-Mansi and Yamalo-Nenets autonomous okrugs
|
Constituent entity of the UFD |
Crisis period |
||
|
2016–2018 |
2018–2020 |
2020–2023 |
|
|
Kurgan Oblast |
(0.1) |
(0.1) (0.23) (0.28) |
(0.12) (0.65) |
|
Khanty-Mansi Autonomous Okrug |
(0.15) (0.16) |
(0.3) (0.27) |
(0.97) |
|
Yamalo-Nenets Autonomous Okrug |
(0.37) |
– |
|
Source: own compilation.
According to the calculations obtained on the basis of “hard” thresholds, two clear peaks of increased economic security risks associated with the impact of the consequences of the pandemic and the tightening of sanctions pressure were identified in the Sverdlovsk and Tyumen oblasts. In these two periods, a significant factor was the reduction in agricultural production in both oblasts ( X 6), and in the Sverdlovsk Oblast there is also a decline in retail turnover ( X 3). In addition, during the pandemic, the greatest contribution to the deterioration of the economic security of the Sverdlovsk and Tyumen oblasts was made by the increase in registered unemployment ( X 5). The deterioration in the dynamics of retail turnover and unemployment is typical of crisis periods in the Russian economy as a whole, while the reduction in agricultural production is caused by regional peculiarities. In the
Sverdlovsk Oblast, agricultural production volumes decreased from the third quarter of 2020 to the second quarter of 2022. At first, crop production decreased as a result of natural and climatic conditions, which led to a decrease in the yield of grain, potatoes and vegetables ( Tab. 4 ), and then, due to quarantine and sanctions restrictions, there was a decline in the volume of livestock production ( Tab. 5 ), depending on the import of equipment, breeding cattle, and seed material (Kabanova, 2023). In the second half of 2022, the agriculture of the oblast adapted; at the end of the year in the Sverdlovsk Oblast there was an increase in agricultural production by 8.9% (crop production – by 20.6%, animal husbandry – by 1.7%) as a result of the implementation of “protective” government measures, record harvest of grain crops, as well as due to the “low” comparison bases. In other regions
Table 4. Yield of grain and leguminous crops, centners per 1 ha of harvested area
|
Territory |
2016 |
2017 |
2018 |
2019 |
2020 |
2021 |
2022 |
|
Russian Federation |
26.2 |
29.2 |
25.4 |
26.7 |
28.6 |
26.7 |
33.6 |
|
Ural Federal District |
16.2 |
19.2 |
16.1 |
16.9 |
13.8 |
12.1 |
21.4 |
|
Kurgan Oblast |
16.3 |
18.6 |
16.2 |
16.9 |
13.5 |
11.1 |
21.9 |
|
Sverdlovsk Oblast |
17.7 |
22.5 |
19.4 |
22.3 |
20.9 |
16.7 |
27.5 |
|
Tyumen Oblast |
18.8 |
23.3 |
20 |
22.4 |
19.9 |
16.3 |
26.7 |
|
Chelyabinsk Oblast |
14.5 |
16.8 |
13.4 |
13 |
8.6 |
9.2 |
16.5 |
|
Source: Rosstat. |
|||||||
Table 5. Livestock production index, %
According to the estimates obtained, the Chelyabinsk Oblast clearly shows an increase in economic security risks only during the pandemic; moreover, two waves can be traced in this regard. The factors influencing such growth were as follows: decrease in wages adjusted for inflation ( X 4), decline in agricultural production ( X 6), and increase in the registration of citizens with employment centers ( X 5). The labor market has adapted to socioeconomic instability by dismissing employees and using part-time, shortened working week. During the period of aggravating anti-Russian sanctions, the probability of deterioration of the economic security in the Chelyabinsk Oblast was not revealed.
The results of assessing the probability of the Kurgan Oblast’s indicators reaching “hard” thresholds indicate that from the point of view of ensuring economic security among the regions of the Ural Federal District, the Kurgan Oblast is largely exposed to various risks. Three peaks of increased economic security risks have been identified. The first peak in the Kurgan Oblast was observed in 2016 (when an external shock in 2014–2016 caused a recession in Russia (Golyashev et al., 2017). In 2016, the most significant factor was the continuing decline in wage level (X4). In 2018, during the period of stagnation of the Russian economy (Tsukhlo, 2019), the second peak is recorded, associated with an increase in registered unemployment (X5), reduction in industrial production (X1), namely in the production of food products and finished metal products, as well as in agriculture (X6). During the pandemic (the third peak), the main factors promoting the growth of economic security risks were the decline in industrial (X1) and agricultural (X6) production. Within the time period under consideration, the negative impact of the tightening of sanctions of unfriendly countries on ensuring economic security in the Kurgan Oblast has not been established.
Several periods of increasing economic security risks have been identified in Khanty-Mansi Autonomous Okrug. The peak of the first period is recorded in 2016, when the devaluation of the ruble in 2014–2015 and the introduction of the food embargo led to an economic downturn, an increase in consumer prices and, accordingly, a decrease in household incomes and consumer demand, which resulted in a reduction in retail trade turnover ( X 3) and wages ( X 4) in the Autonomous Okrug. The second period began in 2019, had a negative influence on the dynamics of industrial ( X 1) and agricultural ( X 6) production, and intensified in 2021 (almost the sole contribution of X 6). Since the main share in the processing production of Khanty-Mansi Autonomous Okrug is occupied by the production of oil, gas and gas condensate, the decline in economic activity during periods of instability is reflected in the reduction of its volumes. There is no such reduction in Yamalo-Nenets Autonomous Okrug, which is similar in specialization, since during the period under review there was an increase in production as a result of the development of new oil and gas condensate fields – Novoportovsky and Vostochno-Messoyakhsky, and also due to the fact that the largest oil and gas plant Yamal LNG has reached its planned capacity (Kolpakov, Safina, 2020). In general, the highest risk probability indicators for Yamalo-Nenets Autonomous Okrug were revealed in 2016 with the greatest impact of a reduction in retail trade turnover ( X 3) and in 2018 as a result of a decrease in livestock production ( X 6). There was no significant deterioration in the economic security of the autonomous okrugs of the Tyumen Oblast during the period of strengthening anti-Russian sanctions.
Conclusion
Regions’ economic security is affected by a variety of risk factors, which often turn out to be interrelated. In order to evaluate and analyze them, we put forward a multifactorial model within the framework of this study. Modeling the economic security risks for Russian regions was carried out on the example of constituent entities of the Ural Federal District. The results obtained indicate that it is possible to use the considered multifactorial risk model to study the dynamics of economic security of Russian regions.
We have found that the situation at the national level is fairly stable, because economic security indicators try to remain within their thresholds, while the situation at the regional level varies. Among the constituent entities of the Ural Federal District, the Kurgan Oblast, characterized by low socio-economic potential, and the autonomous okrugs of the Tyumen Oblast, whose economy significantly depends on foreign economic conditions, are the most exposed to risks.
The increase in sanctions pressure on the part of unfriendly countries has had a negative impact on ensuring the economic security of Russia as a whole and that of individual regions of the Ural Federal District. However, within the analyzed period, the risks created are significantly lower in comparison with the impact of the COVID-19 pandemic, and they tend to decrease. According to the results of the regional analysis, the most significant factor is the state of agriculture. In 2022, this very factor made the greatest contribution to the increase in risk in the constituent entities of the Ural Federal District (except for the Chelyabinsk Oblast and Yamalo-Nenets Autonomous Okrug, where the deterioration of the situation was not detected). But its influence subsided by the end of the year due to significant antisanctions measures aimed at supporting businesses and citizens, as well as due to record crop yield.
It is important to note that the results we obtained with the help of modeling economic security risks for Russian regions may be a shortterm consequence of the anti-sanctions policy, and they do not allow us to draw unambiguous conclusions about the achievement of peak values and the desire of the system to stabilize. Obviously, the impact of sanctions pressure on ensuring the regions’ economic security is of a long-term nature and will require further research.
References Modeling economic security risks for Russian regions in the context of sanctions pressure
- Anisimov A.L. (2022). Limitations on the effectiveness of institutionalization of economic development: On the example of the Economic Security Strategy of the Russian Federation for the period up to 2030. Finansovye rynki i banki, 3, 9–11 (in Russian).
- Avdiysky V.I., Senchagov V.K. (2014). Methodology for determining the threshold values for main (priority) risk factors and threats to the economic security of business entities. Ekonomika. Nalogi. Pravo, 4, 73–78 (in Russian).
- Aven T. (2019). The Science of Risk Analysis: Foundation and Practice. Routledge. DOI: 10.4324/9780429029189
- Behrensdorf J., Broggi M., Beer M. (2019). Reliability analysis of networks interconnected with copulas. ASCEASME.Journal of Risk and Uncertainty in Engineering Systems, Part B Mechanical Engineering, 5, 041006-9. DOI 10.1115/1.4044043
- Benzaghta M.A., Elwalda A., Mousa M.M. et al. (2021). SWOT analysis applications: An integrative literature review. Journal of Global Business Insights, 6(1), 54–72. DOI: 10.5038/2640-6489.6.1.1148
- Bryant J., Zhang J.L. (2016). Bayesian forecasting of demographic rates for small areas: Emigration rates by age, sex, and region in New Zealand, 2014–2038. Statistica Sinica, 26, 1337–1363. DOI: 10.5705/ss.2014.200t
- Cherubini U., Luciano E., Vecchiato W. (2004). Copula Methods in Finance. Chichester, UK: Wiley. Cox L.A. Jr. (2009). Risk Analysis of Complex and Uncertain Systems. Springer.
- Devianto M.D., Fadhilla D.R. (2015). Time series modeling for risk of stock price with value at risk computation. Applied Mathematical Sciences, 9(56), 2779–2787. DOI: 10.12988/ams.2015.52144
- Gimpelson V.E., Kapelyushnikov R.I. (2015). The Russian labour market model: Trial by recession. Zhurnal Novoi ekonomicheskoi assotsiatsii, 2(26), 249–253 (in Russian).
- Ginevicius R., Gedvilaite D., Stasiukynas A., Suhajda K. (2022). Complex expert assessment of the state of business enterprises. Acta Polytechnica Hungarica, 19(2), 135–150. DOI: 10.12700/APH.19.2.2022.2.8
- Glazyev S.Yu., Lokosov V.V. (2012). Assessment of threshold values of indicators of the state of Russian society and their use in the management of socio-economic development. Vestnik Rossiiskoi akademii nauk, 82(7), 587–614 (in Russian).
- Golyashev A.V., Grigor’ev L.M., Lobanova A.A., Pavlyushina V.A. (2017). Features of recession recovering: Income and inflation. Prostranstvennaya ekonomika=Spatial Economics, 1, 99–124. DOI: 10.14530/se.2017.1.099-124 (in Russian).
- Graziani R. (2020). Stochastic population forecasting: A Bayesian approach based on evaluation by experts. In: Mazzuco S., Keilman N. (Eds.). Developments in Demographic Forecasting. The Springer Series on Demographic Methods and Population Analysis, 49, 21–42. Cham: Springer. DOI: 10.1007/978-3-030-42472-5_2
- Gurvich E.T., Prilepskiy I.V. (2016). The impact of financial sanctions on the Russian economy. Voprosy ekonomiki, 1, 5–35. DOI: 10.32609/0042-8736-2016-1-5-35 (in Russian).
- Ilyenkova N.D. (2016). Stages of the risk and economic security analysis program. In: Analiz i sovremennye informatsionnye tekhnologii v obespechenii ekonomicheskoi bezopasnosti biznesa i gosudarstva: sbornik nauchnykh trudov i rezul’tatov sovmestnykh nauchno-issledovatel’skikh proektov [Analysis and Modern Information Technologies in Ensuring the Economic Security of Business and the State: Collection of Scientific Papers and Findings of Joint Research Projects]. Moscow: Auditor (in Russian).
- Joe H. (2014). Dependence Modeling with Copulas. New York: Chapman and Hall/CRC.
- Kabanova E.E. (2023). Prospects of the Russian agricultural complex in the conditions of sanctions. Ekonomicheskoe razvitie Rossii=Russian Economic Developments, 30(4), 44–52 (in Russian).
- Karanina E.V., Maksimova N.A. (2022). Assessment of economic security risks of industrial enterprises by developing a multiple regression model. Problemy analiza riska=Issues of Risk Analysis, 19(2), 30–38. DOI: 10.32686/1812-5220-2022-19-2-30-38 (in Russian).
- Kolpakov A.Yu., Safina E.V. (2020). Assessment of the costs of the oil-producing sector of Russia to reduce the risks of permafrost degradation under the influence of climate change. Nauchnye trudy: Institut narodnokhozyaistvennogo prognozirovaniya RAN, 18, 186–200. DOI: 10.47711/2076-318-2020-186-200 (in Russian).
- Krivorotov V.V., Kalina A.V., Belik I.S. (2019). Threshold values of indicators for diagnostics of economic security the Russian Federation at the present stage. Vestnik UrFU. Seriya: Ekonomika i upravlenie=Bulletin of Ural Federal University. Series Economics and Management, 18(6), 892–910. DOI: 10.15826/vestnik.2019.18.6.043 (in Russian).
- Kuklin A.A., Tyrsin A.N., Pecherkina M.S., Nikulina N.L. (2018). Risk diagnostics and management for welfare in regions (in the example of the Ural Federal District). Prostranstvennaya Ekonomika=Spatial Economics, 2, 36–51. DOI: 10.14530/se.2018.2.036-051 (in Russian).
- Lavrikova Yu.G. (2017). Features of the processes of new industrialization in the Ural region. In: Neoindustrial’no orientirovannye preobrazovaniya v ekonomicheskom prostranstve Ural’skogo makroregiona [Neo-Industrially Oriented Transformations in the Economic Space of the Ural Macroregion]. Yekaterinburg: Ural’skii gosudarstvennyi ekonomicheskii universitet (in Russian).
- Liu T., Yu Z. (2022). The analysis of financial market risk based on machine learning and particle swarm optimization algorithm. EURASIP Journal on Wireless Communications and Networking, 31. DOI: 10.1186/s13638-022-02117-3
- Lobkova E.V. (2022). Application of the theory of fuzzy sets in the assessment of economic security risks in the context of the digital transformation of the regional economy. Ekonomicheskie nauki, 208, 111–118. DOI: 10.14451/1.208.111 (in Russian).
- Lokosov V.V. (2021). Assessment of socio-economic risks by method of extremely critical (threshold) indicators. Narodonaselenie=Population, 24(3), 8–17. DOI: 10.19181/population.2021.24.3.1 (in Russian).
- Lukashin Yu.P. (2003). Adaptivnye metody kratkosrochnogo prognozirovaniya vremennykh ryadov [Adaptive Methods of Short-Term Forecasting of Time Series]. Moscow: Finansy i statistika.
- Mityakov S.N. (2019). Methods for assessing economic security risks. Ekonomicheskaya bezopasnost’=Economic Security, 2(1), 23–27. DOI: 10.18334/ecsec.2.1.100618 (in Russian).
- Mityakov S.N., Mityakov E.S., Fedoseeva T.A. (2020). The system of indicators of economic security of a municipality as an integral element of a multi-level system of economic security. Mir novoi ekonomiki=The World of New Economy, 14(4), 67–80. DOI: 10.26794/2220-6469-2020-14-4-67-80 (in Russian).
- Pavlov V.I. (2019). Problems and contradictions in the implementation of the Russian Federation’s economic security strategy for the period up to 2030. Ekonomicheskaya bezopasnost’=Economic Security, 2(1), 39–45. DOI: 10.18334/ecsec.2.1.100621 (in Russian).
- Senchagov V.K., Mityakov S.N. (2011). Using the index method to assess the level of economic security. Vestnik Akademii ekonomicheskoi bezopasnosti MVD Rossii, 5, 41–50 (in Russian).
- Serebrennikov S.S., Morgunov E.V., Mamaev S.M., Shervarli I.A. (2018). The strategy of economic safety of the Russian Federation for the period up to 2030. Vestnik Tomskogo gosudarstvennogo universiteta. Ekonomika=Tomsk State University Journal of Economics, 41, 20–28. DOI: 10.17223/19988648/41/1 (in Russian).
- Simachev Yu.V., Fedyunina A.A., Ershova N.V., Misikhina S.G. (2021). Russian retail before, during and after the COVID-19 crisis. EKO=ECO, 5(563), 29–52 (in Russian).
- Soboleva I.V., Sobolev E.N. (2021). Open and latent unemployment in the context of the pandemic. Ekonomicheskie i sotsial’nye peremeny: fakty, tendentsii, prognoz=Economic and Social Changes: Facts, Trends, Forecast, 14(5), 186–201. DOI: 10.15838/esc.2021.5.77.11 (in Russian).
- Solozhentsev E.D. (2006). Stsenarnoe logiko-veroyatnostnoe upravlenie riskom v biznese i tekhnike [Scenario Logic-Probabilistic Risk Management in Business and Technology]. Second edition. Saint Petersburg: Biznes-pressa.
- Soshnikova L.A., Tamashevich V.N., Uebe G., Shefer M. (1999). Mnogomernyi statisticheskii analiz v ekonomike [Multidimensional Statistical Analysis in Economics]. Moscosw: YuNITI-DANA.
- Tatarkin A.I., Kuklin A.A., Romanova O.A. et al. (1997). Ekonomicheskaya bezopasnost’ regiona: edinstvo teorii, metodologii issledovaniya i praktiki [Economic Security of the Region: Unity of Theory, Research Methodology and Practice]. Yekaterinburg: Izd-vo Ur. un-ta.
- Tsukhlo S.V. (2019). Russian industry 2018: Stagnant but not in crisis. Ekonomicheskoe razvitie Rossii=Russian Economic Developments, 26(2), 45–48 (in Russian).
- Tyrsin A.N., Surina A.A. (2017). Modeling of risk in multidimensional stochastic systems. Vestnik Tomskogo gosudarstvennogo universiteta. Upravlenie, vychislitel’naya tekhnika i informatika=Tomsk State University Journal of Control and Computer Science, 39, 65–72. DOI: 10.17223/19988605/39/9 (in Russian).
- Vasiliev V.L., Ustyuzhina O.N., Sedov S.A. (2015). Risk and economic security: Relationship and methodology of the analysis. Kazanskii ekonomicheskii vestnik, 3(17), 90–94 (in Russian).
- Vissarionov A.B., Gumerov R.R. (2017). Concerning the use of indicators’ marginal (threshold) values of the RussianFederation economic security. Upravlencheskie nauki=Management Sciences, 7(3), 12–20 (in Russian).
