Modeling renewable electricity production in Azerbaijan

Author: Niftiyev I.M., Rustamli E.F., Mammadli R.M.
Journal: Economic and Social Changes: Facts, Trends, Forecast @volnc-esc-en
Section: Global experience
Article in issue: 1 т.17, 2024.
Free access
Azerbaijan is an oil-rich country in the South Caucasus with great potential for developing the renewable energy sector, which currently accounts for only a small share of total energy production. Increased electricity generation from renewables can bring various economic and environmental benefits, such as greater energy security, sustainability and resource conservation, decentralized power generation, technological innovation, and climate change mitigation. Although there are a growing number of studies on Azerbaijan’s green energy or energy transition, the dynamics of its relatively longitudinal per capita renewable electricity generation have not been fully explored. Moreover, most studies ignore the role of technological change and profound institutional and policy variables in the energy transition. Our study fills this gap by applying dynamic ordinary least squares modeling (DOLS) on annual data to identify the key economic, institutional, and policy determinants in the period from 1990 to 2021. We reveal that economic variables such as oil prices, trade openness, CO2 emissions, accession to the Kyoto Protocol, and crisis periods were positively and statistically significantly associated with renewable electricity production in Azerbaijan. However, institutional quality variables (e.g., government effectiveness), GDP per capita, and primary energy consumption were negatively and statistically significantly associated with renewable electricity. Our findings hold the potential to furnish essential insights into enhancing renewable energy production across both short- and long-term horizons. Consequently, policymakers, decision-makers, and scholars stand to gain valuable insights from the outcomes of our research.
Azerbaijan economy, electricity production, dynamic ordinary least squares, green economy, renewable energy
Short address: https://sciup.org/147243332
IDR: 147243332 | UDC: 338.4 | DOI: 10.15838/esc.2024.1.91.14
Text of the scientific article Modeling renewable electricity production in Azerbaijan
The investigation into the fundamental determinants of renewable energy production yields manifold societal benefits. Primarily, these efforts can bolster energy security by mitigating the reliance on imported fossil fuels (Moriarty, Honnery, 2016). Subsequently, these sources exhibit negligible greenhouse gas emissions, positioning them as a pivotal component in the transition towards a low-carbon economy and the concomitant mitigation of emissions1. Furthermore, the pivot to renewable energy augments public health by mitigating air pollution, thus engendering enhanced community well-being (Singh et al., 2010; Wolch et al., 2014). This transition also harbors the potential to cultivate employment avenues, particularly within the domains of manufacturing, installation, and maintenance of renewable energy infrastructure2. Finally, in regions where traditional biomass predominates, the embracement of renewable sources has the capacity to alleviate the burdens on rural livelihoods by abating the temporal and labor-intensive obligations associated with fuelwood collection and concurrently expanding access to modern energy services3.
Oil-rich nations are increasingly endeavoring to transition from conventional fossil-fuel-based energy production. This shift is propelled by several factors that imbue the production of renewable energy with considerable potential to bolster the long-term economic growth and development strategies of oil-rich countries (Ostergaard et al., 2021). This transition offers benefits such as diversifying domestic energy production, which can also be exported, as well as reducing production costs, including the adverse environmental externalities, and generating additional employment opportunities—objectives highly sought by numerous oil-producing developing nations. These circumstances warrant an exploration of case studies that hold the promise of furnishing insightful and intriguing insights into domestic socioeconomic indicators and the renewable energy sector. Notably, Azerbaijan emerges as one such case study, situated within the South Caucasus region and bordering the Caspian Sea.
The Azerbaijani economy is endowed with significant reserves of oil and natural gas, which are harnessed for both domestic energy generation and the attainment of substantial export revenues (Bayulgen, 2003). In broader terms, Azerbaijan is estimated to possess approximately seven billion barrels of oil, with a production rate of 1,034.63 thousand barrels per day in 2010, marking the highest recorded value since 19914. The mining sector, contributing 55.94% to value added in 2022, assumes a prominent role, and energy production constitutes the principal impetus propelling non-oil economic activities5. Mining and energy industries have conventionally been perceived as effective and pioneering avenues through which the Azerbaijani government engages in oil and gas extraction, yet certain non-oil manufacturing sectors and institutional advancements have been marginalized due to issues pertaining to transparency and rent-seeking6. Consequently, the rapid economic growth, developmental progress, poverty alleviation, and increased wealth witnessed in Azerbaijan are coupled with attendant occurrences such as Dutch disease and de-industrialization (Hasanov, 2013).
Azerbaijan’s dependence on oil, fossil fuelbased energy production, and limited opportunities for job creation make it necessary to address current mainstream issues such as the green economy in order to create social and economic prospects. While there is a growing body of literature investigating the green economy and renewable energy production in Azerbaijan, a comprehensive approach to modeling the essential economic, institutional, and policy factors influencing renewable energy production remains limited. Furthermore, there has been no comprehensive study on long-run dynamics over an extended time period (1990 to 2021) pertaining to renewable energy production. To address this research gap, our study endeavors to construct linear models of the Azerbaijani economy in relation to per capita renewable electricity production, a pivotal factor influencing overall economic growth and development (Humbatova, 2020). The research question guiding this study is as follows: How have economic, institutional, and policy factors influenced per capita renewable electricity generation in Azerbaijan from 1990 to 2021? To explore this question, we employ a quantitative research design, specifically the dynamic ordinary least squares (DOLS) methodology, which effectively mitigates endogeneity and serial correlation concerns (Saikkonen, 1991; Stock, Watson, 1993). This approach enables us to capture the robust and dynamic relationships among the variables of interest, addressing common endogeneity issues prevalent in economic datasets (Isiaka, 2020). We thus follow the suggestions of Ahmet (Ahmet, 2021), who argues that DOLS allows us to obtain unbiased coefficients for small samples that correspond to our situation, regardless of their degree of integration. The distinctive contribution of this research lies in its comprehensive examination of the determinants of per capita renewable electricity in Azerbaijan, a small oil-rich nation where international oil prices significantly shape economic prosperity. This study draws upon a theoretical framework derived from the literature review, particularly that which pertains to the Azerbaijani economy. The main scientific hypotheses of the current paper are given below:
Ha1: Economic determinants (e.g., GDP per capita, trade openness) played a statistically significant role in per capita renewable electricity generation in Azerbaijan between 1990 and 2021;
Ha2: Institutional determinants (e.g., government effectiveness, regulatory quality) played a statistically significant role in per capita renewable electricity generation in Azerbaijan between 1996 and 2021;
Ha3: Policy determinants (e.g., research and development expenditures, joiining Kyoto Protocol) played a statistically significant role in per capita renewable electricity generation in Azerbaijan between 1996 and 2021.
Literature review and theoretical framework
Azerbaijan’s potential for transitioning an energy transition from its predominant fossil fuel-based paradigm to a more ecologically sustainable production model has garnered substantial consideration. This is predicated on the country’s endowed hydro, solar, and wind power capacities, positioning it favorably to enhance per capita renewable electricity output (Vidadili et al., 2017). A prevailing discourse posits that Azerbaijan’s latent potential remains incompletely tapped, offering future prospects of notably elevated green energy generation (Mustafayev et al., 2022). Nonetheless, there exists the plausible avenue to augment electricity production in Azerbaijan by an estimated 5–7%, alongside a 10% increase in heat energy, facilitated by the adoption of alternative energy resources (Azizov, Mammadova, 2022). In response to these considerations, the state has devoted attention to these matters, particularly within the last decade, as underscored by the “State program on the use of alternative and renewable energy sources in the Republic of Azerbaijan” (Hasanov, 2023). Despite these strides, substantial challenges persist, including the legal framework, seamless grid integration, storage capacity limitations, and the harmonization of supply and demand dynamics, necessitating concerted efforts to surmount them in the foreseeable trajectory.
The corpus of econometric and empirical inquiries into Azerbaijan’s renewable energy production is demonstrating an upward trajectory. Huseynli and Huseynli (Huseynli, Huseynli, 2022), for instance, have unveiled a causal nexus among variables encompassing renewable energy production, unemployment, and traditional energy output. Employing vector autoregression and correlation analyses, this study discerned a robust interrelationship among these variables. This signifies that overall energy generation and consumption exert an elevating influence on renewable energy production, thereby engendering fresh employment prospects. Parallelly, Mukhtarov (Mukhtarov, 2022) applied the Granger causality test to annual data spanning from 1992 to 2015, thereby substantiating a causal linkage between economic growth and renewable energy production in Azerbaijan. Additionally, Mukhtarov et al. (Mukhtarov et al., 2020) expounded that an increase of 0.16% and 0.60% in renewable energy consumption is concomitant with a 1% elevation in financial development, gauged through the metric of domestic credit relative to GDP between 1993 and 2015. This underlines the pivotal role of domestic financial development and economic growth in galvanizing renewable energy consumption in a statistically robust manner. Nevertheless, a subset of studies has proffered counterarguments, refuting the proposition of an enduring equilibrium between renewable energy production and pivotal economic variables within the Azerbaijani economy (Kalyoncu, 2013), whilst also casting doubt on their contribution to economic growth (Huseynli, 2022). Notwithstanding, the latest study by Hasanov et al. (Hasanov et al., 2023), employing machine learning algorithms, has demonstrated that both total factor productivity and renewable energy consumption engender a reduction in CO2 emissions.
Azerbaijan is faced with a compelling imperative to expeditiously enhance its energy transition endeavors. The conventional fossil-fuel based energy production practices, apart from their palpable inadequacy in aligning with the sustainability agenda advocated by the United Nations, bear adverse ecological ramifications (Abbasov, 2015). The issue of environmental degradation in Azerbaijan has attracted sustained attention over the course of several years. This is attributed to the country’s copious reserves of oil and gas, a situation that has been further exacerbated by the historic “Contract of the Century” signed in 1994. This also amplified concerns surrounding environmental preservation (Aliyev et al., 2006). Eminent scholars contend that state-initiated endeavors such as the “Clean City” and “White City” projects represent explicit responses to the persisting challenges associated with climate change and the alarming depletion of vital resources within Azerbaijan (Mehdialiyeva, Mazanova, 2013). The forays into Stand-Alone Photovoltaic (SAPV) technologies in the Karabakh region, notably in Zangilan city, serve as a vivid testament to policymakers’ systematic commitment toward facilitating the socio-economic well-being of nascent communities by means of sustainable energy production strategies. It is, however, imperative to recognize that the scope of such initiatives should not be limited solely to the energy sector; rather, the agriculture and transportation domains should also be imbued with a vision to leverage the potential dividends of a sustainable green energy landscape (Mehdialiyeva, Mazanova, 2013).
Within the burgeoning discourse encompassing green energy production in Azerbaijan, a resonating perspective calls for collaborative engagement with foreign nations to harness their accrued expertise, technological innovations, and policy formulation acumen. Notably, Hajiyeva and Musayeva-Gurbanova underscore the prospects of fostering cooperation between Azerbaijan and select
European counterparts, notably Switzerland and Sweden, renowned for their well-entrenched economic paradigms and policies germane to green energy integration (Musayeva-Gurbanova, Hajiyeva, 2022). This impetus is underscored by Azerbaijan’s pivotal role in bolstering the energy security of European Union nations, thereby bestowing strategic significance upon the South Caucasus and the Caspian Sea region (Galandarova, 2023). Galandarova (Galandarova, 2023) further advances the notion that the ongoing collaborative endeavors between Azerbaijan and European Union member states are instrumental in laying a firm domestic legal and regulatory groundwork conducive to advancing the agenda of renewable energy production (Galandarova, 2023).
In essence, the prospective trajectories of renewable energy production in Azerbaijan are underpinned by both optimistic and cautious outlooks. Each stance is buttressed by distinct rationales grounded in prevailing political, socio-economic, and institutional contours. For instance, Azerbaijan has diligently formulated an array of legislative statutes, legal edicts, and state-driven initiatives consonant with European norms, indicative of the nation’s commitment to orchestrating an energy transition that addresses environmental imperatives and resource conservation (Ahmadov, Khalilov, 2019). While Ibadoghlu (Ibadoghlu, 2022) presents a more nuanced assessment of renewable energy production, Hajizada (Hajizada, 2021) postulates that robust inter-ministerial synergy coupled with a resolute disposition within the Azerbaijani administration augments the feasibility of realizing stipulated objectives within the realm of green energy. Comparative analyses conducted by Cholewa et al. (Cholewa et al., 2022) and Guliyev (Guliyev, 2023) underscore Azerbaijan’s aspiration to curtail greenhouse emissions by 30% via the renewable energy sector. Nevertheless, this ambition contends with challenges such as limited collaboration with neighboring nations and the pronounced monopolistic dominion of “Azerenergy OJSC”, thereby impinging upon the efficacy of regulatory frameworks and normative mandates (Hamidova et al., 2022).
Nevertheless, an array of studies has directed conspicuous attention towards the spectrum of malpractices and formidable impediments impeding the progress of green energy development within the Azerbaijani context. Consequently, Azerbaijan finds itself confronted with the imperative to recalibrate its pricing and investment enticement stratagems in the realm of electricity generation. It emerges that, given the prevailing milieu, the pursuit of requisite investment thresholds necessary for the amplification of renewable energy production capacity stands insurmountably challenging (Gulaliyev et al., 2020). The existing technological and economic efficiencies attendant to renewable energy production manifest as conspicuously suboptimal, coupled with a dearth of incentives capable of fomenting the requisite impetus among prospective domestic stakeholders (Gulaliyev et al., 2020). Investigative endeavors of Nuriyev et al. (Nuriyev et al., 2021) further corroborate the veracity of these concerns, spotlighting energy policy contours, financial risk dimensions, and the exigency of grid access as veritable crucibles encompassing the landscape of renewable energy development. A distinct facet within this discourse is articulated by Bayramov (Bayramov, 2021), who accentuates the promulgation of state-led measures designed to incentivize and fortify fossil-fuel based energy production through the aegis of subsidies, while concurrently casting a seemingly inattentive gaze towards the stimulation of renewable energy endeavors. The hardships introduced by the global COVID-19 pandemic have also resonated within Azerbaijan’s renewable energy terrain. As global demand and oil prices experienced a downward trajectory, Azerbaijan’s fiscal leeway contracted, thereby constraining its capacitation to both invest in and augment the ongoing arc of renewable energy production (Bayramov, 2021).
Access to capital for renewable energy projects remains difficult due to low liquidity in the local banking system and high interest rates (Bayramov, 2021). Guliyev (Guliyev, 2023) argues that Azerbaijan’s renewable energy sector depends on foreign direct investment from Gulf countries. Customer preference for renewable energy sources is also low and the Azerbaijani public remains poorly informed about the potential of moving away from fossil fuels (Bayramov, 2021). More public awareness is needed to expand the use of renewable energy (Bayramov, 2021).
We have formulated the theoretical framework that underpins the present study, delineated in Figure 1, drawing from seminal contributions by (Ahmad et al., 2022; Bourcet, 2020; Omri, Nguyen, 2014; Przychodzen, Przychodzen, 2020). Figure 1 , in essence, elucidates our methodological approach regarding variable selection in the context of this study. To elaborate, we have classified variables into three distinct categories: economic, institutional, and policy determinants, which collectively constitute the principal conduits through which impacts on renewable energy production are channeled. This classification holds true not only within the Azerbaijani context but extends to a broader international framework. Within the realm of economic determinants, variables such as GDP per capita, energy demand, and trade openness have been regarded as pivotal influencers of renewable energy production. Similarly, the institutional determinants encompass regulatory quality, government effectiveness, and an aggregated measure of institutional quality, drawing from a composite of pertinent World Bank Governance indicators such as rule of law, voice and accountability, control of corruption, and political stability. Lastly, the investigation into policy dimensions of renewable energy production has been grounded in the comprehensive analysis
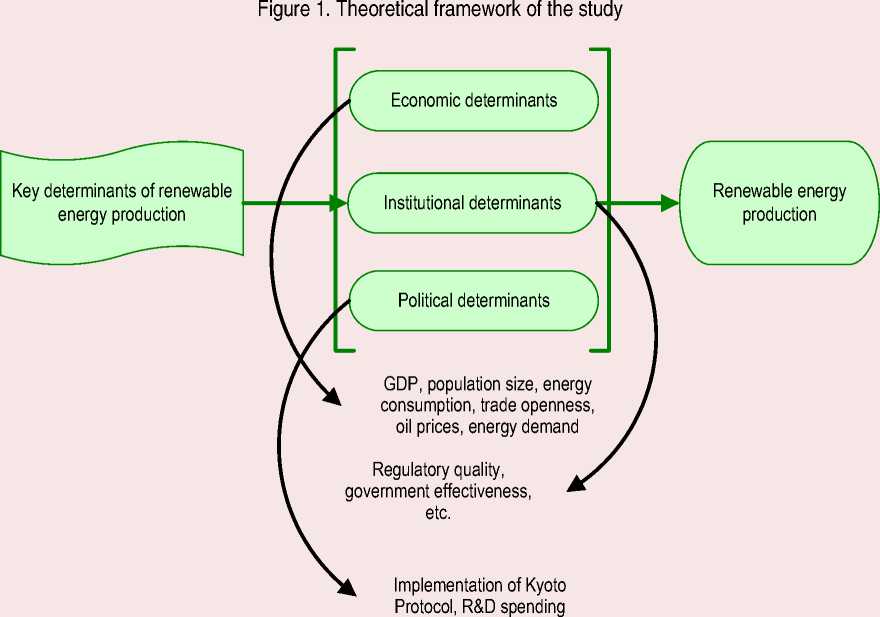
Source: own elaboration based on the literature.
of the Kyoto Protocol’s implementation and the allocation of resources to research and development expenditures.
Data and methodology
In this study, the DOLS methodology is employed, a preferred approach over the conventional OLS method. This choice is predicated upon its efficacy in mitigating challenges arising from serial correlation and endogeneity, as expounded earlier within this paper. The overarching functional representation of the empirical models is provided herewith:
Yt = F(Et, It , Pt ), (1)
In the context of this analysis, Yt symbolizes the per capita renewable electricity generation at time t; Et encompasses conceivable economic determinants at the same juncture (e.g., GDP per capita, oil prices, energy consumption); It pertains to institutional determinants encompassing aspects like regulatory quality, government effectiveness, and an average institutional quality involving additional components (e.g., control of corruption, rule of law, etc.); Pt represents policy variables which encapsulate factors like research and development expenditures, the application of the Kyoto Protocol, etc. This functional interrelation is estimated through diverse variables judiciously selected in alignment with the theoretical framework of the current investigation. Subsequently, DOLS models were estimated, adhering to the approach delineated by Stock and Watson (Stock, Watson, 1993). Thus, our DOLS specification is described below:
RenElect = Co + P i X i, t + X r=-k $ i ^^ i,t+r + £ i,t , (2)
where RenElec is the per capita renewable electricity generation at time t ; C 0 signifies the vector of intercept coefficients; Xi,t is the vector of integrated regressors in their level form succeeded by their differenced, lagged, and lead forms of ∆ Xi,t+r ; ∆ denotes the difference operator pertaining to the vector of explanatory variables comprised within X ; k represents the number of lags and leads; Ф conveys the vector of coefficients derived from lagged and lead explanatory variables; ft i denotes the vector of long-run coefficients; £ t is the random error terms at time t . The decision to set k at “1” is driven by the limitations imposed by the constrained sample size, which is founded on annual data.
We have closely examined the works (Murshed, Saadat, 2008; Loganathan, Subramaniam, 2010; Mahadea, Kaseeram, 2018; Ahmet, 2021), which have utilized DOLS models for the estimation of time series data. These investigations aimed to ascertain the judicious selection of variables within a singular model, given the constraints imposed by the sample size. Our scrutiny revealed a consistent trend, where typically two to three, and at most four explanatory variables, inclusive of the intercept parameter, have been deemed appropriate for the estimation of a DOLS model. In light of this observation, our endeavor focused on employing two to three explanatory variables in our estimations, thereby facilitating the acquisition of substantive and unbiased long-run coefficients.
For OLS estimations, the adjustment of degrees of freedom and the rescaling of OLS error terms are standard procedures in the econometrics software EViews. However, in the context of DOLS estimations, a reevaluation of this default approach becomes imperative due to the intricate nature of the model incorporating lags and leads of differenced explanatory variables, coupled with their corresponding level forms. As a corrective measure, we have engaged the DOLS method within the EViews econometrics software. It’s noteworthy that the coefficient covariance matrix is predicated on the HAV technique, and the degrees of freedom adjustment option remains unchecked, as befits the DOLS framework. To enhance the robustness of our analysis, each model has undergone diagnostic tests, including the Jarque – Bera normality test of the residuals and the Wald test. Additionally, the R-squared values, in conjunction with the reported standard error of regression, serve to provide insights into the caliber of the linear estimations.
Table 1 provides a comprehensive overview of the variables under consideration, encompassing their abbreviations, conceptual definitions, and sources. Notably, the temporal coverage of the variables within the dataset exhibited divergence. For instance, indicators such as the proportion of primary energy stemming from renewable sources, prevailing oil prices, the pace of population growth, per capita CO2 emissions, and per capita primary energy consumption were tracked from the year 1990 through 2021. On the other hand, metrics encompassing per capita electricity generation via renewable sources, GDP per capita, and the extent of trade openness were examined within the timeframe spanning 1990 to 2021. Meanwhile, Research and Development (R&D) expenditure and institutional variables (e.g., regulatory quality, government effectiveness) unfolded within the scope of 1996 to 2021.
Three variables exhibited outlier values. Specifically, for the variable RegQ, the outlier value was confined to the year 2004, whereas for the variables TrOpp and PrEnCon, outlying values extended across multiple years (Tab. 2) . To address this, a strategy involving value constraints was implemented, whereby the outlier values of RegQ and TrOpp were substituted with the maximum or minimum values extracted from the respective time series untainted by outlier values. In contrast, the variable PrEnCon remained unaltered in terms of its outlier values, primarily due to the complexities entailing potential data loss. Preceding the DOLS estimations, all variables underwent standardization
Table 1. Details about the variables of interest used in dynamic ordinary least squares modeling
Following research endeavors of (Azizi et al., 2022; Nordin et al., 2014; Sharif et al., 2017), our study employs fundamental statistical procedures to ascertain the compatibility of our dataset with DOLS framework. To this end, we execute both the Augmented Dickey – Fuller (ADF) test for assessing unit root and the Johansen – Juselius co-integration analyses for investigating co-integration patterns. The existence of a co-integration relationship among the variables of interest is imperative for the subsequent application of DOLS. This foundational understanding of stationarity and co-integration substantiates the robustness of our subsequent linear modeling, aligning with established practices within the realm of economics, as evidenced by the seminal works (Lim et al., 2003; Zhong, Lei, 2008; Herve, Shen, 2011).
According to the ADF test (Tab. 3) , all variables are stationary at their first difference form based on Akaike Information Criterion. When variables are stationary on their first difference, it is often easier to estimate relationships between them using econometric techniques like regression or cointegration. Stationarity simplifies the modeling process and enhances the reliability of the results.
Table 2. Descriptive statistics of the variables of interest
|
Variable |
Min. |
Max. |
Average |
St. dev. |
Outliers |
Correlation |
|
RenElec |
118.62 |
369.16 |
222.42 |
62.50 |
–— |
–— |
|
CO2Emm |
3.32 |
7.61 |
4.53 |
1.50 |
–— |
0.26* |
|
PrEnCon |
14,165.33 |
36,072.15 |
20,617.52 |
7,234.66 |
1991 |
0.04 |
|
OilP |
14.42 |
99.67 |
44.31 |
27.83 |
–0.06 |
|
|
TrOpp |
55.35 |
115.84 |
86.41 |
15.31 |
1992–93, 2004 |
0.54** |
|
GDPPerCap |
60.24 |
7,890.84 |
3,007.71 |
2,650.32 |
–— |
–0.22 |
|
R&DExp |
0.17 |
0.42 |
0.25 |
0.07 |
–— |
0.06 |
|
GovEff |
-0.71 |
0.81 |
0.07 |
0.53 |
–— |
–0.43* |
|
RegQ |
–0.88 |
–0.48 |
–0.67 |
0.10 |
2004 |
0.27 |
|
InsQ |
–1.06 |
0.42 |
–0.19 |
0.52 |
–— |
–0.43* |
|
PopGr |
0.44 |
2.12 |
1.18 |
0.36 |
–— |
0.31* |
Notes: Descriptive statistics was based on the dataset that did not contain any outliers.
* Correlation is significant at the 0.01 level (2-tailed);
** Correlation is significant at the 0.05 level (2-tailed).
Source: own calculations based on the collected dataset.
Table 3. Augmented Dickey – Fuller unit root test of the variables of interest
|
RenElec |
CO2Emm |
PrEnCon |
OilP |
TrOpp |
PopGR |
|
|
At level |
–2.38 |
–1.52 |
–0.70 |
–2.37 |
-2.91 |
–1.98 |
|
1st diff. |
–5.19*** |
–3.41* |
–4.19** |
–6.29*** |
–6.23*** |
–5.66*** |
|
GDPPerCap |
R&DExp |
GovEff |
RegQ |
InsQ |
||
|
At level |
–2.28 |
–2.75 |
–2.30 |
–2.26 |
–0.93 |
|
|
1st diff. |
–3.44* |
–5.04*** |
–5.55*** |
–3.65** |
–4.42*** |
|
|
The numbers were rounded to the second decimal place for concision. The symbols *, **, and *** indicate statistical significance at the 10%, 5%, and 1% levels, respectively. “diff” denotes difference. Source: own calculations based on the collected dataset. |
||||||
Given the divergent nature of our sample sizes with respect to observation counts, and the relatively concise temporal span under scrutiny, our analytical strategy encompassed the implementation of three distinct Johansen – Juselius co-integration analyses. These investigations were underpinned by the amalgamation of varying subsets of variables of interest, with an absolute incorporation of the dependent variable, denominated as renewable electricity production (RenElec). The findings of these analyses are comprehensively presented in Table 4. Notably, the outcomes derived from all three analytical iterations consistently underscore the existence of at least one co-integration equation among the assessed variables. Such findings effectively substantiate the premise that the variables in question exhibit co-integration, thereby implying the presence of a sustained longterm equilibrium among them. In essence, this connotes the operation of a unifying mechanism that harmonizes the trajectories of the variables of interest. Consequently, these findings augur well for the pursuit of theoretically significant outcomes that bear substantial empirical pertinence.
Results
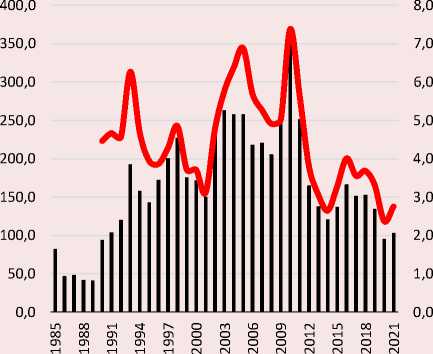
To begin our analysis, the trajectory of Azerbaijan’s renewable energy production, expressed as a proportion of total energy output, exhibited an upward trajectory commencing from 1985, culminating via 7.4% in 2010 (see Fig. 2, panel a). However, a shift in trend has been evident since 2010, characterized by marginal upticks in 2016 and 2022. This departure in trend becomes pronounced when considering the percentages of 1.9% in 2020 and 2.1% in 2021, which fall short of harnessing the true potential and capacity inherent in the Azerbaijani economy for generating renewable energy. Similarly, when analyzing per capita renewable electricity production, a notable and positive correlation with renewable energy production is discerned. This correlation reached its zenith in 2010 at 369.2 kilowatt-hours, subsequently
Table 4. Unrestricted cointegration rank test (trace)
|
Hypothesized No. of CE(s) |
Eigenvalue |
Trace statistic |
0.05 Critical value |
Prob.** |
|
None* |
0.836459 |
103.3124 |
69.81889 |
0.0000 |
|
At most 1* |
0.696716 |
59.85577 |
47.85613 |
0.0025 |
|
At most 2* |
0.568655 |
31.22172 |
29.79707 |
0.0341 |
|
At most 3 |
0.289956 |
11.04140 |
15.49471 |
0.2090 |
|
At most 4 |
0.110975 |
2.823131 |
3.841466 |
0.0929 |
|
Included variables: RenElec, InsQ, PrEnCon, TrOpp, PopGR |
||||
|
None* |
0.813482 |
89.72712 |
69.81889 |
0.0006 |
|
At most 1* |
0.676744 |
49.42562 |
47.85613 |
0.0353 |
|
At most 2 |
0.440283 |
22.32214 |
29.79707 |
0.2809 |
|
At most 3 |
0.201426 |
8.394374 |
15.49471 |
0.4242 |
|
At most 4 |
0.117360 |
2.996116 |
3.841466 |
0.0835 |
|
Included variables: RenElec, OilP,GovEff, RegQ, GDPPerCap |
||||
|
None* |
0.722904 |
77.72665 |
69.81889 |
0.0102 |
|
At most 1 |
0.559890 |
46.92528 |
47.85613 |
0.0610 |
|
At most 2 |
0.472954 |
27.22774 |
29.79707 |
0.0962 |
|
At most 3 |
0.347316 |
11.85654 |
15.49471 |
0.1639 |
|
At most 4 |
0.065142 |
1.616664 |
3.841466 |
0.2036 |
Notes: Included observations: 24 after adjustments; Lags interval (in first differences): 1 to 1; Trend assumption: Linear deterministic trend; Trace test indicates 3 cointegrating eqn(s) at the 0.05 level; * denotes rejection of the hypothesis at the 0.05 level; ** MacKinnon – Haug – Michelis (1999) p-values.
Source: own calculations based on the collected dataset.
Figure 2. Renewable energy sector and selected key variables in the Azerbaijani economy, 1985–2021
Renewable energy
Renewable electricity
40 000,0
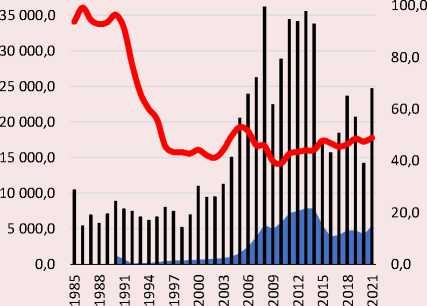
^н GDP per capita
^н Oil prices
«шввPrimary energy consumption
-
a. Percentage share of renewable energy in total energy production (right axis) and per capita renewable electricity production (in kilowatt-hours)
-
b. GDP per capita (in current USD), oil prices (in USD per barrel, right axis) and per person primary energy consumption (in kilowatt-hours) of the Azerbaijani economy
Sources: Our World in Data; World Bank.
demonstrating a downward trajectory until 2021. Remarkably, only the years 2016 and 2021 emerge as salient points within the recent temporal domain concerning per capita renewable electricity production.
Figure 2, panel b also depicts pivotal economic indicators related to the Azerbaijani economy. Notably, this panel elucidates the dynamics of GDP per capita, oil prices, and per capita primary energy consumption. The trajectory of oil prices has played a crucial role in influencing Azerbaijan’s GDP and GDP per capita, particularly between the late 2000s and the years 2014 and 2015, a period marked by the collapse of oil prices within the international commodity markets. The advent of the commodity supercycle circa 2004 was characterized by its peak in 2015. This temporal span witnessed an average annual oil price of 78 USD between 2004 and 2015, which precipitously descended to 48 USD in 2015, thereby plunging into volatility and fluctuations. This erratic oscillation hindered the swift recuperation of Azerbaijan’s GDP, thereby exerting a diminishing impact on GDP per capita. The ramifications of this volatility led to a dip in GDP per capita to 3,880.7 USD in 2016, aligning with levels reminiscent of 2007. Concurrently, the trajectory of per capita primary energy consumption within Azerbaijan underwent a decline from 34,094.6 in 1985 kilowatt-hours to 14,981.9 kilowatt-hours in the year 2022. While there emerged a rising trajectory in per person primary energy consumption since 2010, it remained subjugated below the benchmarks of the late 1980s and 1990s.
Table 5. Dynamic ordinary least squares results
|
Equation name: |
M1 |
M2 |
M3 |
M4 |
M5 |
M6 |
M7 |
M8 |
|
Time period: |
1990–2021 |
1996–2021 |
1996–2021 |
1996–2021 |
1990–2021 |
1990–2021 |
1996–2021 |
1990–2021 |
|
Constant |
–0.46*** |
0.00 |
–0.53*** |
–0.44 |
0.40 |
–0.27 |
–0.02 |
–0.26 |
|
(0.14) |
(0.17) |
(0.16) |
(0.26) |
(0.27) |
(0.28) |
(0.12) |
(0.18) |
|
|
[–3.28] |
[0.02] |
[–3.39] |
[–1.71] |
[1.45] |
[–0.97] |
[–0.18] |
[–1.46] |
|
|
OilP |
3.40*** |
0.45 |
||||||
|
(0.65) |
(0.43) |
|||||||
|
[5.24] |
[1.03] |
|||||||
|
PopGr |
0.34** |
|||||||
|
(0.15) |
||||||||
|
[2.30] |
||||||||
|
GDPpercap |
–3.38*** |
0.89** |
–0.28 |
–0.24 |
–0.23 |
|||
|
(0.60) |
(0.37) |
(0.27) |
(0.24) |
(0.14) |
||||
|
[–5.64] |
[2.44] |
[–1.04] |
[–1.00] |
[–1.60] |
||||
|
TrOpp |
1.11*** |
|||||||
|
(0.19) |
||||||||
|
[5.78] |
||||||||
|
R&DExp |
–0.05 |
|||||||
|
(0.22) |
||||||||
|
[–0.23] |
||||||||
|
InsQ |
–0.51* |
|||||||
|
(0.27) |
||||||||
|
[–1.88] |
||||||||
|
GovEff |
–1.15*** |
|||||||
|
(0.31) |
||||||||
|
[–3.72] |
||||||||
|
CO2Emm |
4.76*** |
0.68** |
||||||
|
(1.47) |
(0.32) |
|||||||
|
[3.25] |
[2.16] |
|||||||
|
PrEnCon |
–4.24*** |
|||||||
|
(1.41) |
||||||||
|
[–2.99] |
||||||||
|
Kyoto |
0.74* |
|||||||
|
(0.41) |
||||||||
|
[1.82] |
||||||||
|
RegQ |
0.16 |
|||||||
|
(0.24) |
||||||||
|
[0.69] |
||||||||
|
Crises |
0.65* |
|||||||
|
(0.36) |
||||||||
|
[1.82] |
||||||||
|
Observations |
29 |
23 |
23 |
23 |
31 |
29 |
23 |
29 |
|
R-squared |
0.71 |
0.62 |
0.61 |
0.58 |
0.30 |
0.42 |
0.53 |
0.39 |
|
Adjusted R-squared |
0.50 |
0.41 |
0.38 |
0.34 |
0.04 |
0.14 |
0.25 |
0.26 |
|
Standard error of regression |
0.72 |
0.84 |
0.87 |
0.89 |
0.96 |
0.94 |
0.95 |
0.87 |
|
Jarque – Bera value: |
1.06 |
2.23 |
1.03 |
1.53 |
1.17 |
0.01 |
1.22 |
0.12 |
|
Jarque – Bera probability: |
0.59 |
0.33 |
0.60 |
0.46 |
0.57 |
0.99 |
0.54 |
0.93 |
|
Wald test1 |
12.59*** |
15.62*** |
16.88*** |
6.71*** |
4.07** |
2.59* |
0.39 |
12.08*** |
|
Wald test2 |
50.35*** |
46.87*** |
50.63*** |
20.14*** |
12.21*** |
10.38** |
1.17 |
36.25*** |
|
Notes: “M” denotes model; Standard errors are given in the parentheses; T-statistics are given in square brackets; The symbols *, **, and *** indicate statistical significance at 10%, 5%, and 1% levels, respectively; All numbers were rounded to the second decimal point for compactness; “Wald test1” reports the F-statistic-based results of the Wald test, while “Wald test2” is Chi-square value. Source: own calculations based on the collected dataset. |
||||||||
Table 5 presents the outcomes of DOLS analyses, focusing on the dependent variable RenElec. Among the eight models assessed, namely M1 through M8, two models, specifically M1 and M3, yielded statistically significant coefficients, both of which are negative. These models also sought to investigate the potential predictive capacity of OilP concerning RenElec. Remarkably, only in the context of M1 did oil prices demonstrate a positively significant association with RenElec. Further exploration revealed that PopGr and TrOpp exhibited positive and statistically significant relationships with RenElec, as evidenced in M1 and M2, albeit with varied statistical significance. On the other hand, GDPpercap predominantly displayed a negative correlation with RenElec. This negative correlation manifested as statistically significant within M1 but appeared statistically insignificant in M6, M7, and M8. Moreover, carbon emissions surfaced as positively and statistically significantly linked to RenElec in models M5 and M6. Conversely, PrEnCon exhibited a noteworthy negative and statistically significant relationship with RenElec. This comprehensive analysis concludes the examination of the economic determinants impacting RenElec within the Azerbaijani economic landscape during the period spanning 1990 to 2021.
In terms of determinants of institutional quality, RegQ is found to have no statistically significant relationship with RenElec, having a positive coefficient. In contrast, the GovEff and InsQ variables had a discernible negative and statistically significant impact on the RenElec variable.
In an effort to evaluate the robustness of the estimated DOLS models, we have incorporated diverse quality assessment metrics including R-squared, the standard error of regression, the Jarque – Bera test for the normality of residuals, and the Wald test. Notably, the lowest R-squared and adjusted R-squared values were observed in Model M5 (0.30 and 0.04, respectively), with the converse witnessed in Model M1 (0.71 and 0.50, respectively). While R-squared values offer insights into the fit quality, the standard error of regression facilitates comprehension of the model’s excellence by quantifying the average discrepancy between the observed values and the regression line. Generally, the standard error of regression varies across models, ranging from 0.71 in Model M1 (the lowest) to 0.96 in Model 5 (the highest). This indicates minimal deviations from the mean standard error of regression, approximately 0.88. Importantly, the Jarque – Bera test of normality of residuals showed no indications of heteroscedasticity across all models. Notably, Model M7 was the only instance where the Wald test did not meet the criteria. In summation, the outcomes of Models M5 and M7 should be interpreted cautiously, whereas the remaining models offer more reliable and consistent coefficient estimates.
Discussion
The objective of this study was to identify the main economic, institutional, and policy variables that typically influence renewable electricity generation in a given country. To this end, the following research question was developed to guide the study and quantitative data: How have economic, institutional, and policy factors influenced per capita renewable electricity generation in Azerbaijan from 1990 to 2021? Our empirical findings shed light on the long-run impact of economic, institutional, and policy factors in Azerbaijan that have not been analyzed in depth before. We had three hypotheses, and we accept all alternative hypotheses based on the statistically significant results, that there is at least one economic indicator that plays a role among the three main channels of influence (i.e., economic, institutional, policy) on renewable electricity generation in Azerbaijan.
The results obtained through the DOLS estimation for Azerbaijan reveal several significant associations between key economic variables and per capita renewable electricity generation. Firstly, oil prices, population growth rates, and trade openness show positive and statistically significant relationships with per capita renewable electricity generation. This suggests that as oil prices rise, the population grows, and trade openness increases, there is a concurrent increase in the production of renewable electricity on a per capita basis in Azerbaijan. There could be several reasons why this empirical result is consistent with Azerbaijan’s economic and policy preferences.
Undoubtedly, a comprehensive assessment of the economic realities intrinsic to the Azerbaijani context, characterized by its predominant role as an oil-producing and exporting nation, coupled with its status as a small, open economy, reveals a discernible linkage between escalating oil prices and amplified national prosperity. This augmented wealth then serves as the impetus to channel resources into advancing renewable electric technologies, often facilitated through avenues such as governmental subsidies or the transfer of technological expertise. Notably, a corollary inference could suggest that a decline in oil prices might be indicative of reduced per capita renewable electricity generation within Azerbaijan. However, it is crucial to exercise caution in this analysis. Upon a closer examination, it becomes evident that the influential variable of economic crises underscores that such a correlation might not be as pronounced. It is noteworthy, though, that the encompassing variable of economic crisis periods takes into account events like the recession in the early 1990s and the global financial crisis, which were motivated by factors beyond the dynamics of commodity markets.
Understanding primary energy consumption patterns is crucial for assessing the transition to renewable electricity. It reflects energy source dependency, informs policy alignment, and guides infrastructure investments. Changes in consumption patterns indicate shifts towards cleaner sources, impacting energy sustainability, environmental goals, and economic considerations. However, the relationship with primary energy consumption is negative and statistically significant in the example of Azerbaijan obtained via our study. This implies that as primary energy consumption increases, the per capita renewable electricity generation tends to decrease relative to consumption. This could indicate that higher energy consumption from non-renewable sources may have a dampening effect on the development of renewable energy sources in Azerbaijan.
One of the interesting and surprising findings was the negative and, in some cases, statistically significant relationship between GDP per capita of Azerbaijan and renewable electricity generation. Since GDP per capita is one of the most important economic variables that can tell a lot about the prosperity of a nation, it deserves special attention to interpret it in terms of some possible causes. For instance, with a higher GDP per capita, there might be an increased demand for energy, which could lead to a greater reliance on traditional, non-renewable energy sources that are often more readily available and established. Similarly, as the economy grows, there might be a focus on building up infrastructure quickly to support industrialization and urbanization. This could lead to the use of conventional energy sources that can provide a more immediate energy supply. However, a recent study by Mukhtarov and Mikayilov (Mukhtarov, Mikayilov, 2023) showed that economic growth favors renewable energy sector and helps reduce energy poverty if financing is secured. Moreover, economic growth can sometimes lead to policy decisions that prioritize economic development over environmental concerns. In fact, Azerbaijan is a country rich in oil and natural gas, where energy production from fossil fuels has always been cheaper than renewable green energy production. This might result in reduced incentives for investing in renewable energy because rapid economic growth might result in quicker adoption of conventional energy technologies due to familiarity and established supply chains.
We also found that CO2 emissions are negatively associated with renewable electricity production which might mean that overall energy production and also renewable energy production degrade environment. This finding is somehow is similar to Achuo and Ojon’s finding for low and lower middleincome countries where the authors argue that renewable energy consumption increased pollution (Achuo, Ojon, 2023). Furthermore, since one of our findings indicated the statistically significant and negative association between renewable electricity generation and primary energy consumption might indicate that even though country increased its energy production and consumption, it did not lead to more renewable electricity generation. According to (Fang et al., 2022), urbanization levels, human capital and globalization should be considered in this regard.
Another surprising result that contradicted our expectations was the negative relationship between institutional quality and per capita renewable electricity generation. It was a much discussed topic in both academia and the media that green energy generation and consumption in Azerbaijan were not well regulated and promoted until 2022 and 2023, when the government invested significantly in sustainable energy sources. Our scientific findings coincide to some extent with certain concerns in society regarding the development of green energy in Azerbaijan.
The lack of a statistically significant relationship between regulatory quality and renewable electricity generation suggests that the specific aspects related to the formulation and implementation of regulations may not have a substantial impact on the level of renewable electricity production. Other factors, such as technological advancements, resource availability, and economic incentives, might have a more dominant influence on renewable energy adoption. In a similar manner, the negative relationship between government effectiveness and renewable electricity generation could indicate that with higher levels of government effectiveness, the government might have policies or regulations that unintentionally hinder the growth of renewable energy. It is important to investigate the reasons behind this negative relationship, such as potential bureaucratic hurdles, inconsistent policy implementation, or regulatory barriers that may discourage investments in renewable energy projects. Furthermore, the negative and statistically significant relationship between the more aggregated institutional quality variable in our study (including control of corruption, rule of law, etc.) and renewable electricity generation raises concerns about the overall business environment and investment climate in the context of renewable energy. This suggests weaker overall institutional quality also hinder the development and adoption of renewable energy technologies.
Despite numerous contributions, our study also has some important limitations that should be kept in mind before drawing any conclusions from the empirical estimates. First, our modeling is limited only to per capita renewable electricity generation. Total renewable electricity could have different patterns and dynamics than renewable electricity. Second, modeling DOLS based on annual data is another limitation. DOLS requires careful consideration of data characteristics and appropriate model specifications, and results may be affected by the choice of endogenous and exogenous variables. In addition, sensitivity to the length of the lag may play a crucial role. Third, the variables on technological change and institutional quality should be more nuanced and fine-tuned. We aimed for a more compact yet holistic analysis, but such important things as rent-seeking behavior in the Azerbaijani energy sector also need to be accounted for in linear models. Finally, other quantitative methods such as fully modified ordinary least squares, canonical cointegration, or autoregressive distributed lag could provide productive empirical checks on our results.
Conclusion
Numerous studies show that Azerbaijan has environmentally friendly energy sources such as hydropower, wind power, and geothermal energy, which makes the country an ideal location for renewable energy production (Rzayeva et al., 2021). However, challenges to renewable energy development include fossil fuel subsidies, institutions, and governance issues. As a result, there are a growing number of reports in the English-language literature on energy transition in Azerbaijan, but more comprehensive reports are still sparse. Our objective was to provide a long-term empirical estimate of the key economic, institutional, and policy determinants of per capita renewable electricity generation between 1990 and 2021 using the DOLS approach.
Overall, our results suggest that Azerbaijan’s per capita renewable electricity generation is positively influenced by factors like favorable oil prices, population growth, and increased trade openness. However, efforts might be needed to address the negative association with primary energy consumption to further enhance the growth of renewable energy sources in the country. The lack of adverse effects during economic crises periods is a positive sign for the stability and potential growth of the renewable energy sector in Azerbaijan but the study also indicates that certain institutional quality variables, such as government effectiveness and the aggregated institutional quality, are negatively related to renewable electricity generation.
Drawing upon our research findings, we suggest the following brief policy recommendations: 1) strategic emphasis should be placed on the alignment of national economic dynamics with a swift transition from conventional fuel-based energy generation to a sustainable paradigm of green energy production; this transformation, reflective in broader economic indicators such as GDP and GDP per capita, underscores the imperative for cohesive policy frameworks; 2) with the continual expansion of the populace, heightened energy consumption looms, necessitating robust support mechanisms for technology transfer and domestic research and development initiatives; national policies centered on research and technological advancement should permeate not only the renewable energy sector but also the broader economic spectrum, thereby fostering the domestic production of renewable energy equipment and alleviating the fiscal burden posed by imports; 3) international accords and cooperative ventures merit vigorous endorsement, given our substantiated determination of their favorable and moderate influence on per capita renewable electricity generation; 4) the creation of a comprehensive institutional framework and tailored regulations for the renewable energy sector remains a necessity. In the absence of a sound legal foundation, judicious conceptualization, and enduring strategies, the advancement of renewable energy production within Azerbaijan’s small and resource-rich context is imperiled; 5) an opportune juncture presents itself to harmonize environmental preservation policies and the pursuit of renewable energy production. Notably, the synergy between CO2 emissions reduction strategies and the augmentation of the renewable energy sector warrants focused exploration to engender a dynamic and interconnected perspective on these vital themes.
References Modeling renewable electricity production in Azerbaijan
- Abbasov E. (2015). Sustainable solution for increasing the share of solar photovoltaic usages on residential houses in Azerbaijan. Environmental Research, Engineering and Management, 71(4), 11–18. DOI: 10.5755/j01.erem.71.4.12070
- Achuo E.D., Ojon N. (2023). Energy transition and pollution emissions in developing countries: Are renewable energies guilty? International Journal of Development Issues. DOI: 10.1108/IJDI-05-2023-0114
- Ahmad U.S., Usman M., Hussain S., Jahanger A., Abrar M. (2022). Determinants of renewable energy sources in Pakistan: An overview. Environmental Science and Pollution Research, 29(19), 29183–29201. DOI: 10.1007/s11356-022-18502-w
- Ahmadov E., Khalilov T. (2019). Azerbaijan from inclusive and innovative governance to green economy. In: 37th International Scientific Conference on Economic and Social Development – “Socio Economic Problems of Sustainable Development”. Baku, Azerbaijan, February 14–15.
- Ahmet U. (2021). Is fueling the economy with too much finance good? Anadolu İktisat ve İşletme Dergisi, 5(1), 1–13.
- Aliyev F.G., Khalilova H.K., Aliyev F.F. (2006). The use of alternative energy sources – the best approach to improving environmental situation in Azerbaijan. In: 16th World Hydrogen Energy Conference 2006, WHEC 2006. Lyon, France, June 13–16, 2006.
- Azizi J., Zarei N., Ali S. (2022). The short-and long-term impacts of climate change on the irrigated barley yield in Iran: An application of dynamic ordinary least squares approach. Environmental Science and Pollution Research, 29(26), 40169–40177. DOI: 10.1007/s11356-022-19046-9
- Azizov S.G., Mammadova G.S. (2022). The importance of using alternative energy sources in the protection of the atmosphere in Azerbaijan. Науковий вісник Херсонського державного університету. Серія: Географічні науки, 17, 50–54.
- Bayramov A. (2021). Azerbaijan’s Renewable energy policy: Opportunities, drivers and challenges. Caucasus Analytical Digest, 120, 2–7.
- Bayulgen O. (2003). Facing the dilemma of global capitalism: The case of Azerbaijan. Central Asian Survey, 22(2–3), 209–220. DOI: 10.1080/0263493032000157735
- Bourcet C. (2020). Empirical determinants of renewable energy deployment: A systematic literature review. Energy Economics, 85, 104563. DOI: 10.1016/j.eneco.2019.104563
- Cholewa M, Mammadov F., Nowaczek A. (2022). The obstacles and challenges of transition towards a renewable and sustainable energy system in Azerbaijan and Poland. Mineral Economics, 35(1), 155–169. DOI: 10.1007/s13563-021-00288-x
- Fang J., Gozgor G., Mahalik M.K., Mallick H., Padhan H. (2022). Does urbanisation induce renewable energy consumption in emerging economies? The role of education in energy switching policies. Energy Economics, 111, 106081. DOI: 10.1016/j.eneco.2022.106081
- Galandarova U. (2023). The place and role of Europe’s energy security in Azerbaijan’s economic interests. Наукові перспективи (Naukovì perspektivi), 1(31). DOI: 10.52058/2708-7530-2023-1(31)-229-241
- Gulaliyev M., Mustafayev E., Mehdiyeva G. (2020). Assessment of solar energy potential and its ecological-economic efficiency: Azerbaijan case. Sustainability, 12(3), 1116. DOI: 10.3390/su12031116
- Guliyev F. (2023). Renewable energy targets and policies in traditional oil-producing countries: A comparison of Azerbaijan and Kazakhstan. Journal of Eurasian Studies, 18793665231177720. DOI: 10.1177/18793665231177720
- Hajizada O. (2021). Issues of integration into the green economy in the republic of Azerbaijan. Piretc, 17(7), 16–22.
- Hamidova L., Huseynov A., Samedova E. (2022). Challenges in Implementing renewable energy sources in Azerbaijan. International Journal of Energy Economics and Policy, 12(6), 441–446. DOI: 10.32479/ijeep.13636
- Hasanov F. (2013). Dutch disease and the Azerbaijan economy. Communist and Post-Communist Studies, 46(4), 463–480. DOI: 10.1016/j.postcomstud.2013.09.001
- Hasanov F.J., Mukhtarov S., Suleymanov E. (2023). The role of renewable energy and total factor productivity in reducing CO2 emissions in Azerbaijan. Fresh insights from a new theoretical framework coupled with Autometrics. Energy Strategy Reviews, 47, 101079. DOI: 10.1016/j.esr.2023.101079
- Hasanov R. (2023). Promoting sustainability in Azerbaijan’s energy sector: A green policy evaluation and future outlook. Green Economics, 1(1), 62–69.
- Herve D.B.G., Shen Y. (2011). The demand for money in cote D’ivoire: Evidence from the cointegration test. International Journal of Economics and Finance, 3(1), 188.
- Humbatova S.I. (2020). The relationship between electricity consumption and economic growth: Evidence from Azerbaijan. International Journal of Energy Economics and Policy, 10(1), 436–455. DOI: 10.32479/ijeep.8642
- Huseynli B., Huseynli N. (2022). Econometric analysis of the relationship between renewable energy production, traditional energy production and unemployment: The case of Azerbaijan. International Journal of Energy Economics and Policy, 12(4), 379–384. DOI: 10.32479/ijeep.13233
- Huseynli N. (2022). Effect of renewable energy and traditional energy production on economic growth: The case of Turkey and Azerbaijan. International Journal of Energy Economics and Policy, 12(3), 257–261. DOI: 10.32479/ijeep.12943
- Ibadoghlu G. (2022). Problems and prospects of transition to alternative energy in Azerbaijan. SSRN Electronic Journal. DOI: 10.2139/ssrn.4249068
- Isiaka A. (2020). Inequality within the EU-15 countries: Have social benefits been pro-poor, pro-middle class or pro-rich? International Journal of Social Science Research, 8(2), 169–199. DOI: 10.5296/ijssr.v8i2.16571
- Kalyoncu H., Gürsoy F., Göcen H. (2013). Causality relationship between GDP and energy consumption in Georgia, Azerbaijan and Armenia. International Journal of Energy Economics and Policy, 3(1), 111–117.
- Lim K., Lee H., Liew K. (2003). International Diversification Benefits in ASEAN Stock Markets: A Revisit. Labuan School of International Business and Finance, University Malaysia, University Putra Malaysia.
- Loganathan N., Subramaniam T. (2010). Dynamic cointegration link between energy consumption and economic performance: Empirical evidence from Malaysia. International Journal of Trade, Economics and Finance, 1(3), 261–267.
- Mahadea D., Kaseeram I. (2018). Impact of unemployment and income on entrepreneurship in post-apartheid South Africa: 1994–2015. The Southern African Journal of Entrepreneurship and Small Business Management, 10(1), 1–9. DOI: 10.4102/sajesbm.v10i1.115
- Mehdialiyev A., Mazanova O. (2013). On some problems of the creation and development of green technologies in Azerbaijan. In: 7th International Conference on Application of Information and Communication Technologies, IEEE, October 23–25, 2013, Baku, Azerbaijan. DOI: 10.1109/ICAICT.2013.6722804
- Moriarty P., Honnery D. (2016). Can renewable energy power the future? Energy Policy, 93, 3–7. DOI: 10.1016/j.enpol.2016.02.051
- Mukhtarov S. (2022). The relationship between renewable energy consumption and economic growth in Azerbaijan. International Journal of Energy Economics and Policy, 12(1), 416. DOI: 10.32479/ijeep.11948
- Mukhtarov S., Humbatova S., Hajiyev N.G.O., Aliyev S. (2020). The financial development-renewable energy consumption nexus in the case of Azerbaijan. Energies, 13(23), 6265. DOI: 10.3390/en13236265
- Mukhtarov S., Mikayilov J.I. (2023). Could financial development eliminate energy poverty through renewable energy in Poland? Energy Policy, 182, 113747. DOI: 10.1016/j.enpol.2023.113747
- Murshed M., Saadat S.Y. (2008). The impacts of corruption on the efficacy of public expenditure on health: Evidence from Bangladesh. In: Proceedings of the 2nd International Conference on Sustainable Development, February17–18, 2018, Dhaka, Bangladesh.
- Musayeva-Gurbanova A., Hajiyeva N. (2022). The Application of “Green Economy” Policy of Switzerland and Sweden to the Karabakh Region of Azerbaijan: Review and Appraisal. The University of St. Gallen.
- Mustafayev F., Kulawczuk P., Orobello C. (2022). Renewable energy status in Azerbaijan: Solar and wind potentials for future development. Energies, 15(2), 401. DOI: 10.3390/en15020401
- Nordin N., Nordin N., Zainudin N. (2014). Role of economic freedom in the R&D-TFP growth nexus: Panel dynamic ordinary least square (OLS) evidence. In: Proceedings of the 1st International Conference on Management and Muamalah, November13–14, 2014, Kajang, Malaysia.
- Nuriyev M.N., Mammadov J., Mammadov J. (2021). Renewable energy sources development risk analysis and evaluation: The case of Azerbaijan. European Journal of Economics and Business Studies, 5(3), 11–20. DOI: 10.26417/ejes.v5i3.p11-20
- Omri A., Nguyen D.K. (2014). On the determinants of renewable energy consumption: International evidence. Energy, 72, 554–560. DOI: 10.1016/j.energy.2014.05.081
- Østergaard P.A., Duic N., Noorollahi Y., Kalogirou S.A. (2021). Recent advances in renewable energy technology for the energy transition. Renewable Energy, 179, 877–884. DOI: 10.1016/j.renene.2021.07.111
- Przychodzen W., Przychodzen, J. (2020). Determinants of renewable energy production in transition economies: A panel data approach. Energy, 191, 116583. DOI: 10.1016/j.energy.2019.116583
- Rzayeva Z., Guliyeva A., Miriyeva A. (2021). Natural and economic effects of renewable energy sources in the developing countries: A case of Azerbaijan. E3S Web of Conferences, 250, EDP Sciences. DOI: 10.1051/e3sconf/202125003007
- Saikkonen P. (1991). Estimation and testing of cointegrated systems by an autoregressive approximation. Econometric Theory, 8, 1–27. DOI: 10.1017/S0266466600010720
- Sharif A., Afshan S., Nisha N. (2017). Impact of tourism on CO2 emission: Evidence from Pakistan. Asia Pacific Journal of Tourism Research, 22(4), 408–421.
- Singh A., Syal M., Grady S.C., Korkmaz S. (2010). Effects of green buildings on employee health and productivity. American Journal of Public Health, 100(9), 1665–1668. DOI: 10.2105/AJPH.2009.180687
- Stock J.H., Watson M.W. (1993). A Simple estimator of cointegrating vectors in higher order integrated systems. Econometrica, 61(4), 783–820. DOI: 10.2307/2951763
- Vidadili N., Suleymanov E., Bulut C., Mahmudlu C. (2017). Transition to renewable energy and sustainable energy development in Azerbaijan. Renewable and Sustainable Energy Reviews, 80, 1153–1161. DOI: 10.1016/j.rser.2017.05.168
- Wolch J.R., Byrne J., Newell J.P. (2014). Urban green space, public health, and environmental justice: The challenge of making cities ‘just green enough’. Landscape and Urban Planning, 125, 234–244. DOI: 10.1016/j.landurbplan.2014.01.017
- Zhong Z.W., Lei Q.L. (2008). Some notes on Johansen and Juselius cointegration test. Statistics& Information Forum, 23, 80–85.
