Modeling socio-demographic asymmetry of territorial development

Author: Makarova Mariya N.
Journal: Economic and Social Changes: Facts, Trends, Forecast @volnc-esc-en
Section: Theoretical and methodological issues
Article in issue: 2 т.14, 2021.
Free access
The article explores the issues of modeling socio-demographic asymmetry using spatial econometrics. Its relevance is associated with the growing disproportions of demographic dynamics in the regional space that undoubtedly requires scientific understanding and development of appropriate management decisions. The purpose of this study is to substantiate the methodological provisions for modeling the socio-demographic asymmetry of territorial development using a case-study of a specific region. Based on an analysis of domestic and foreign publications on the study of the territorial development asymmetry, including socio-demographic one, the author proposes a typology of methodological approaches and methods of its modeling and evaluation and substantiates the need to use spatial econometrics methods, the advantage of which is not only an opportunity to assess the presence of the asymmetry phenomenon, but also to determine the links between studied territorial entities and evaluate their mutual influence in the conditions of uneven development of regional space. The calculation of Moran’s global and local indices using a case study of the Sverdlovsk Oblast’s settlement system allowed us to obtain the following results: (1) the presence of socio-demographic asymmetry in the form of spatial autocorrelation of the population indicators of the region’s municipalities was confirmed; (2)a typology of municipalities is proposed according to their contribution to the formation of socio-demographic asymmetry, which allowed us to determine the points of agglomeration attraction, as well as to show the presence of direct and inverse spatial relationships between the region’s key territories; (3) the author substantiates the trend of increasing socio-demographic asymmetry in the region as a result of the increasing role of the Yekaterinburg agglomeration and the decline in the value of other two attraction points in the settlement system. The results obtained can be used by interested specialists to justify measures to regulate the socio-demographic and spatial development of the region by using positive and leveling negative effects of the socio-demographic asymmetry.
Socio-demographic asymmetry, population, spatial modeling, settlement system, region, territorial development
Short address: https://sciup.org/147234737
IDR: 147234737 | UDC: 332.1 | DOI: 10.15838/esc.2021.2.74.2
Text of the scientific article Modeling socio-demographic asymmetry of territorial development
The uneven distribution of natural resources and productive forces that tend to them, which have historical, national and socio-cultural characteristics of development, provides significant differences in the levels of territories’ socioeconomic development not only within the country’s borders as a whole, but also often within a single region. To describe this phenomenon in the regional economy, we use various terms: disproportions, differentiation, inequality, etc., reflecting structural, hierarchical, qualitative and other aspects of unevenness. Asymmetry is a complex category that takes into account different aspects of unevenness. It is understood as stable deviations in time and space in the conditions and results of the territories’ development reduction of which ensures equalization of living standards and in the long term contributes to sustainable socioeconomic development in general.
At the regional level, the disparities in demographic dynamics are especially pronounced: some territories show a steady growth in population, an increase in quality of human capital and labor resources which stimulates economic growth, while others experience population outflow, a decrease in quality of human capital and slowdown in socioeconomic development in general. This allows speaking about socio-demographic asymmetry of territorial development and transformation of the regional space. However, despite the fact that the phenomenon of socio-demographic asymmetry of territorial development is observable and obvious, in our opinion, it is not sufficiently understood in science. In this regard, the purpose of our research is to substantiate methodological provisions for modeling socio-demographic asymmetry of territorial development in the case of a specific region.
A review of theoretical approaches to understanding space and asymmetry as its inherent property in previous publications allowed defining socio-demographic asymmetry as follows [1]:
– as a process of asymmetric reproduction of human capital in different territories of the region, provided by uneven dynamics of demographic processes (birth rate, mortality, migration) and appropriate infrastructure development (health, education, culture, etc.);
– as a result of population placement in the region’s space in the form of a heterogeneous settlement system which is transformed under the influence of a complex of factors of different nature (natural and climatic, scientific and technological, socio-economic, political, institutional, etc.).
Such a comprehensive understanding of it allowed attracting a wide range of studies to substantiate the typology of methodological approaches and methodological tools for assessing socio-demographic asymmetry of territorial development. Systematization of methodological approaches is based on the criteria of similarity of the research objects, similarity of methodological apparatus, proximity of the goals and objectives of the study, specific characteristics and features. The resulting typology of methodological approaches and evaluation methods presents in Figure 1 .
Figure 1. Typology of methodological approaches to the assessment of socio-demographic asymmetry of territorial development
Methodological approach
normative
comparative
зт
indicative
Methodical approach
variational analysis
multidimentional analysis
index analysis
econometric analysis
Methods
-
- indicators of variation
-
- clustering
-
- classification
-
- scaling
-
- ranking
-
- integral index
-
- special asymmetry indices
-
- correlation and regression analysis
-
- spatial
econometrics
socio-demographic indicators of territorial development
At the level of the methodology for assessing socio-demographic asymmetry, we can distinguish normative, indicative and comparative approaches. Regulatory approaches involve comparing the achieved level of the region’s development with individual standards defined by legislative acts at the federal, regional or municipal level. In this sense, development uniformity and sustainability is ensured by implementation of the relevant standards. Indicative approaches are based on the assessment of targets set by various development programs and projects the achievement of which in all territories ensures balanced (symmetrical) development. The most commonly used method is to evaluate effectiveness and efficiency of program implementation.
Comparative approaches are mainly aimed at a comparative analysis of the current situation in different territories which allows using a wide variety of assessment methods. The advantage of the comparative approach is greater freedom in the choice of indicators and evaluation methods, depending on the purposes of the study, and the presence of a significant number of publicly available statistics increases the confidence level in the estimates and allows verifying the results.
Depending on the purposes of the analysis, different methodological approaches to the assessment of socio-demographic asymmetry can be chosen. The first group includes methods of variational analysis of indicators of sociodemographic development; its main advantage is the ability to assess the heterogeneity degree of the analyzed indicator values. In addition, calculation of variation indicators is possible for both absolute and relative indicators [2]. To assess territorial development asymmetry, calculation of variation range (amplitude of fluctuations) is used [3; 4; 5], mean quadratic deviation [6], variation coefficient [7; 8], or the analysis of several variation indicators in the complex [9; 10; 11]. The use of variation indicators allows comparing territorial development asymmetry in different sections, as well as in dynamics.
The second group of methodological approaches to assessing socio-demographic development asymmetry consists of multidimensional analysis methods. Their main goal is implementation of the typologization of territorial entities in accordance with manifestation intensity of spatial differences (development asymmetry). Depending on the research objectives and availability of mathematical tools, scientists use ranking and clustering [12], multiparametric structural diagnostics [13], graph theory [14], and others. Among their key advantages, we should note the possibility of identifying subtle, hidden factorial influences, admissibility of comparisons of territorial systems in the complex of studied parameters, possibility of developing strategic and tactical decisions related to the management of territorial systems at different levels, and their segmentation for developing management measures and new decision-making algorithms.
The third group of methodological approaches to assessment of socio-demographic asymmetry includes methods based on the calculation of integral indices and assessment of their hetero-geneity which are a procedure for selecting the most significant indicators used in the future to compare territorial systems, factor assessment of the state of the territorial system, intraregional differences in individual indicators, as well as formation of integral indicators for subsequent typologization of territories [15]. The advantage of this approach is that it makes it possible to obtain a generalized indicator for each of the studied areas (spheres), representing a certain methodological unity of particular indicators; it allows comparing and distributing territorial formations both in one of the studied areas of asymmetry, and in several [16]. However, the presence of a significant number of indicators leads to an increase in the volume and complexity of calculations, makes it difficult to assess the impact of each factor on the change in the resulting indicator, and also reduces the ability to compare the results of various studies with each other.
The fourth group of approaches consists of methods based on the complex application of statistical methods for the analysis of territorial differences using various methods of mathematical modeling. First, researchers use the definition of “average standards”, calculate the deviations of the current values of indicators from the standards, and evaluate contribution of each indicator to the formation of the unevenness level [17]. This allows identifying the magnitude of inter-territorial differences, establishing unevenness stage, which corresponds to the detected differences, highlighting territories with a higher level of development and lagging territories, as well as the main factors that stimulate or hinder the territories’ development.
Secondly, the article uses various modifications of the methods of correlation and regression analysis (construction of regressions on panel data, for example, Zipf’s distributions [18; 19; 20], analysis of convergence/divergence processes of territorial development [21]), and spatial econometrics (for example, construction of Moran’s spatial autocorrelation model [22; 23; 24]). They are popular abroad and only recently have begun penetrating into domestic practice of spatial research [25]. At the same time, they allow not only assessing the presence and degree of disproportions of territorial development, but also determining the links between the studied territorial entities and considering their mutual influence. In this regard, it is the methods of spatial econometrics that we have chosen as the methodological tools of the study.
Data
An objective indicator of the assessment of socio-demographic asymmetry as a result of settlement processes is the population size. This is one of the few indicators for which it is possible to form a fairly long retrospective series at the municipal level which allows searching for patterns in the spatial distribution of population and its dynamics using mathematical methods. As the settlement system is quite inert, and its transformation requires a significant period of time, we have chosen the largest available period of thirty years, starting from the earliest statistical data (census of 1989) and ending with the most recent data on the municipalities’ population at the beginning of 20191 on the basis of which Moran’s local and global indices are calculated. The weight matrix is formed taking into account the distances between the central localities of municipalities, calculated by roads according to the information of specialized sites2. The choice of a standardized matrix is associated, first, with the established practice of similar studies when it is the distances on roads that are recognized as equivalent for estimating the distance of points in socio-economic space; second, it is with data availability and a relatively simple calculation algorithm compared, for example, with the isochron estimation.
Methods
The socio-demographic asymmetry reflects the heterogeneity of the region’s settlement system which makes it possible to use spatial econometrics methods [26] to visualize the uneven spatial development and groups’ formation of similar and different territories. One of them is the method of modeling Moran’s spatial autocorrelation [27; 28] which includes calculation of Moran’s global and local indices.
Moran’s global index allows assessing the presence or absence of spatial autocorrelation between the values of indicators of neighboring territories and is calculated using the formula (1) [29]:
The presence of spatial autocorrelation and its nature (positive or negative) are determined by testing the hypothesis of the significance of Moran’s global index using z-statistics according to the formula (2):
1G — E1 Z =-----
О
and estimates of the null hypothesis about the theoretically random structural regularity of the spatial model.
The qualitative characteristics of spatial autocorrelation are analyzed by comparing IG with the threshold value EI, calculated as (3):
El =
n —
1,
2№-x)(xy-x) = N
= 2(% i -x)2 = Hw iy , (1)
where N – number of territories; wij – an element of the matrix of spatial weights for territories i and j; xi,j – an indicator’s value for a specific territory; х — an indicator’s average value.
where n – number of objects in the selection.
If IG > EI , then there is a positive spatial autocorrelation (i.e., the values in neighboring territories are similar), if IG < EI , then negative autocorrelation (i.e., the values in neighboring territories are different), if IG = EI , then there is no autocorrelation (the values are randomly arranged) [29].
In the presence of spatial autocorrelation, Moran’s scattering diagram is constructed where z -standardized values of the indicators are plotted along the horizontal axis, and the values of the spatial WZ vector are plotted along the vertical axis. Thus, the territories are clustered in four quadrates characterized by different qualitative parameters (Tab. 1) .
Moran’s local indices (LISA) are calculated for each territory separately and allow assessing the presence or absence of spatial autocorrelation of a particular territory with neighboring ones. The calculation formula is as follows (4) [29]:
1 (accessed: May 26, 2020).
2 ; https://www.avtodispetcher. ru/distance/
LISAt
= N •
(X j -x) •Zwij(xj-x) Kxi - X)2
Table 1. Qualitative characteristics of quadrates of Moran’s scattering diagram
|
Quadrate LH (low-high) |
Quadrate HH (high-high) |
|
The territories have relatively low eigenvalues of the analyzed indicator, are surrounded by territories with relatively high values of the analyzed indicator; autocorrelation is negative |
The territories have relatively high eigenvalues of the analyzed indicator, are surrounded by territories with relatively high values of the analyzed indicator; autocorrelation is positive |
|
Quadrate LL (low-low) |
Quadrate HL (high-low) |
|
The territories have relatively low eigenvalues of the analyzed indicator, are surrounded by territories with relatively low values of the analyzed indicator; autocorrelation is positive |
The territories have relatively high eigenvalues of the analyzed indicator, are surrounded by territories with relatively low values of the analyzed indicator (growth poles); autocorrelation is negative |
It is also worth noting that the sum of Moran’s local LISAi indices for all territories is nothing more than Moran’s global IG index.
During the period 1989–2019, the settlement system of the Sverdlovsk Oblast underwent a number of changes (Tab. 2). For instance, region’s population increased from 3785.0 to 4169.9 thousand people which was 110.2%. During the same time, as a result of the local government reform, the number of municipalities in the region increased from 61 to 69 units. At the same time, the average population of the municipality decreased from 62.0 to 60.4 thousand people, or by 2.5%. The coefficient of population variation in municipalities also decreased from 34.3% to 32.8% which may indicate some convergence of the region’s territories in this indicator.
Based on the data on population in the Sverdlovsk Oblast municipalities in 1989 and 2019, we calculated Moran’s global index using a standardized distance matrix (Tab. 3) .
The analysis of z -statistics values allowed concluding that the spatial distribution of population values in the region’s municipalities is not random. And IG comparison with the threshold EI value shows the presence of negative spatial autocorrelation. This indicates
Table 2. Dynamics of the settlement system indicators of the Sverdlovsk Oblast in 1989–2019
Indicator 1989 2019 Population, thou. people 3785.0 4169.9 Number of municipalities, units 61 69 Average number of municipalities, thou. people. 62.0 60.4 Average quadratic deviation of population of municipalities 180.6 184.3 Coefficient of variation in population of municipalities, % 34.3 32.8 Urban population concentration index 0.521 0.563 According to: Population of cities and towns. Available at: (accessed: May 26, 2020).
Table 3. Moran’s global population index for the Sverdlovsk Oblast municipalities based on the standardized distance matrix
Year IG EI* z-statistics Spatial autocorrelation 1989 -0.0321 -0.0167 -7.18** negative 2010 -0.0245 -0.0147 -5.02** negative 2019 -0.0248 -0.0147 -3.44** negative * EI value changes over time due to changes in the number of municipalities in the region, their type and borders as a result of the local government reform in 2003–2009. ** If α = 0.05, it allows rejecting the null hypothesis that the observed spatial model reflects a theoretical random structural pattern. According to: Population of cities and towns. Available at: (accessed: May 26, 2020). that there are statistically significant differences in the values of population index of neighboring territories. Thus, we can talk about the presence of socio-demographic asymmetry in the region.
Based on Moran’s scattering diagram according to standardized population data for 1989 and 2019, the Sverdlovsk Oblast municipalities are divided by types LH, LL, HH, HL ( Fig. 2 ), where Z parameter (Moran’s local index) is plotted along the abscissa axis, and WZ parameter (standardized distances) is along the ordinate axis.
We should note several characteristics of the obtained scattering diagrams. First, over time, there is an increase in the variation of Z and WZ indicators. If in 1989 variation range of the corresponding indicators was 7,998 and 0.0176, then in 2019 it increased to 8,207 and 0.0177, respectively, and due to the growth of the maximum values. This confirms the thesis about the strengthening of socio-demographic asymmetry and increasing weight of individual municipalities in the settlement system.
Secondly, about three-quarters of municipalities are characterized by fairly close values of Z and WZ and are located around the point (0; 0). For the study of socio-demographic asymmetry, the remaining quarter of municipalities, which are outliers and have significantly different Z and WZ parameters, are of interest. These 17 municipalities form three types depending on the quadrate of the scattering matrix they fall into ( Tab. 4 ).
The first type is the territories that are included in the HL cluster according to Moran’s scattering diagram, the so-called growth poles, i.e. territories that have relatively high eigenvalues of population and are surrounded by territories with relatively low population values. In the case of the settlement system of the Sverdlovsk Oblast, this type includes three municipalities (Yekaterinburg, N. Tagil and Serov) which are the cores of agglomeration formations and population attraction points from the surrounding territories. These municipalities retain the function of the core of the first order throughout the observed period, but the weight of
Figure 2. Moran’s scattering diagram for the standardized population of the Sverdlovsk Oblast municipalities
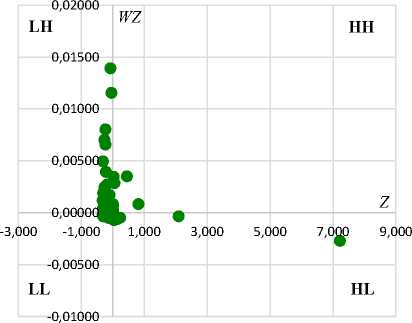
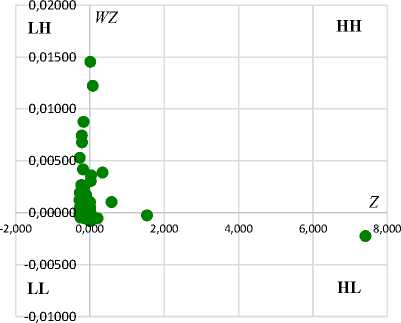
а) 1989 b) 2019
According to: Population of cities and towns. Available at: (accessed: May 26, 2020).
Table 4. Types of municipalities in the settlement system of the Sverdlovsk Oblast according to Moran’s scattering diagram
|
Type of municipality |
1989 |
2019 |
||
|
Municipality |
Share among all municipalities, % |
Municipality |
Share among all municipalities, % |
|
|
HL (first-order cores) |
Yekaterinburg Municipality N. Tagil UD Serovsky UD |
5 |
Yekaterinburg Municipality N. Tagil UD Serovsky UD |
4 |
|
HH (second-order cores of Yekaterinburg agglomeration) |
K.-Uralsky UD Pervouralsky UD Revda UD Polevskoy UD |
7 |
Berezovsky UD V. Pushma UD K.-Uralsky UD Pervouralsky UD Revda UD Polevskoy UD |
9 |
|
LH (Yekaterinburg satellite towns) |
Aramilsky UD Beloyarsky UD Berezovsky UD V. Dubrovo UD Verh-Neyvinsk UD V. Pushma UD Degtyarsk UD Zarechny UD Sredneuralsk UD Sysertsky UD |
16 |
Aramilsky UD Beloyarsky UD V. Dubrovo UD Degtyarsk UD Zarechny UD Sredneuralsk UD Sysertsky UD |
10 |
|
Total* |
17 |
28 |
17 |
23 |
* In 1989, the settlement system included 61 municipalities, in 2019 it was 70.
According to: Population of cities and towns. Available at: (accessed: May 26, 2020).
Figure 3. Dynamics of Moran’s local indices for first-order nuclei of agglomeration formations in the Sverdlovsk Oblast
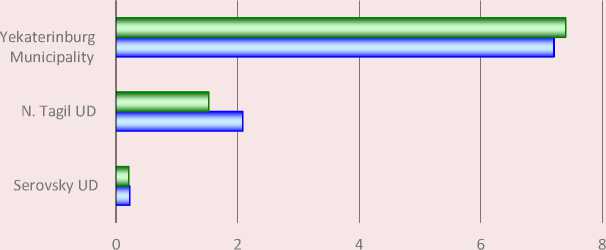
□ 2019 □ 1989
According to: Population of cities and towns. Available at: (accessed: May 26, 2020).
the first in the regional settlement system increases, and the other two lose weight in favor of the regional center (Fig. 3) .
Despite the fact that N. Tagil UD and Serovsky UD, being extremes for the surrounding space, have agglomeration potential, its implementation in the form of the formation of full-fledged urban agglomerations in the near future is not possible, as their weight is decreasing in the settlement system and both municipalities are characterized by a tendency to reduce the population and economic potential. In addition, they do not have second-order nuclei and/or satellite towns in their influence zone like the Yekaterinburg Agglomeration.
The second type includes territories of the cluster HH according to Moran’ s scattering diagram, i.e. those that have relatively high eigenvalues of the analyzed indicator and are surrounded by territories with relatively high values of the analyzed indicator. These are the second-order cores of the Yekaterinburg agglomeration: K-Uralsky UD, Pervouralsk UD, Revda UD, Polevskoy UD, as well as Berezovsky UD, V. Pyshma UD which became a part of the cluster by the end of the period. In addition, all these municipalities have positive spatial correlations with the core of the agglomeration – Yekaterinburg, i.e., in the regional settlement system, the weight of the first-order core increases with the weight of the second-order cores.
Territories of the second type are characterized by an increase in population if they are geographically adjacent to Yekaterinburg (Berezovsky UD, V. Pyshma UD), or a slight decrease in population if they are located at a distance of 50 km or more from Yekaterinburg (K.-Uralsky UD, Pervouralsk UD, Revda UD, Polevskoy UD). All of these municipalities maintain a fairly stable socioeconomic situation, create jobs, and develop social and transport infrastructure. The relatively high standard of living makes it possible to keep population in place.
In our opinion, in the near future, these territories will retain their function in the settlement system of the Sverdlovsk Oblast and will act as population attraction points, although less significant than the regional center.
The third type of municipalities consists of the territories of LH cluster according to Moran’s scattering diagram, i.e., having relatively low eigenvalues of population and surrounded by territories with relatively high values of the analyzed indicator. These include the municipalities that form the satellites of the agglomeration core (Aramilsky UD, Beloyarsky UD, V. Dubrovo UD, Degtyarsk UD, Zarechny UD, Sredneuralsk UD, Sysertsky UD). In addition, all these territories have significant negative connections with the agglomeration core and, thus, are the sources of human capital for the regional center.
These municipalities are characterized by an increase in population in 2019 by an average of 105% compared to the level of 1989. Due to cheaper housing and relatively lower prices, these territories are attractive for residents who make daily trips to work in the region’s capital. At the same time, their problem is the weak development of social infrastructure with a high load on it which is due to the peculiarities of paying personal income tax at the work place, and not at home, and it is this tax that forms a large part of the municipal budget. In the future, municipalities of this type will retain their function as “sleeping areas” of the agglomeration and continue increasing population which actualizes the need to solve the accumulated infrastructure problems.
Figure 4 shows the Sverdlovsk Oblast map which presents the types of municipalities according to the typology described above, and visually reflects the structure of the Yekaterinburg agglomeration consisting of a first-order core and its satellites, several second-order cores, as well as the core of potential agglomerations moving northward in the region.
Figure 4. Types of municipalities in the settlement system of the Sverdlovsk Oblast in 2019 and relations between them
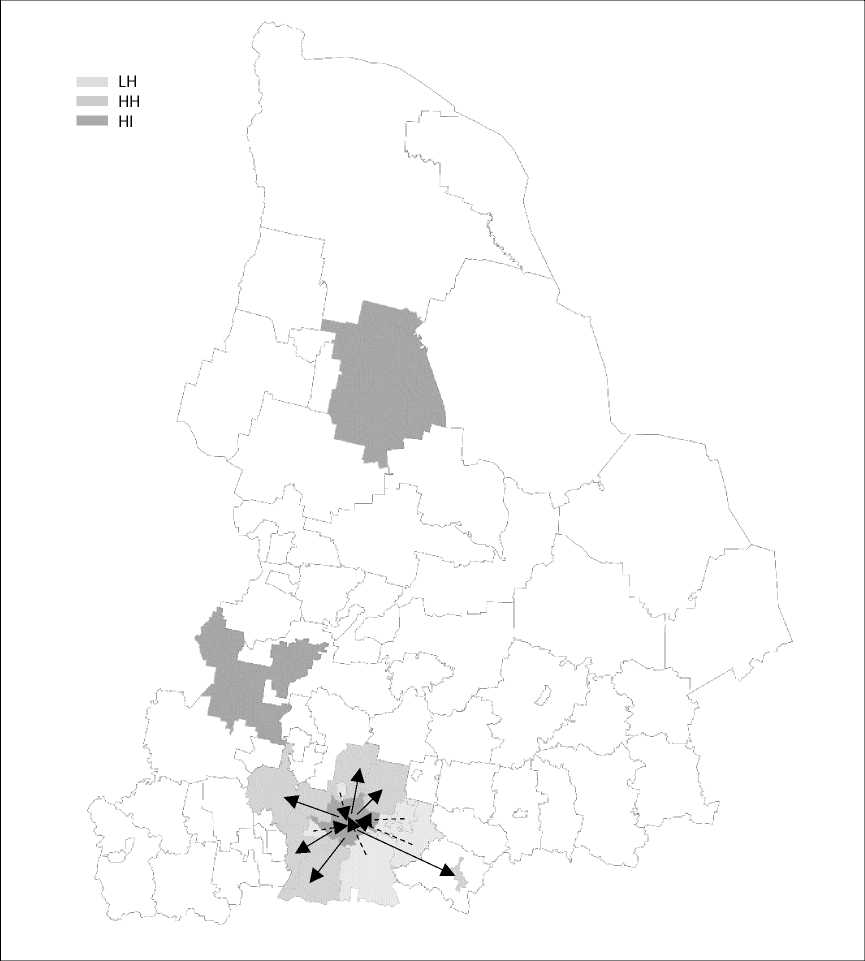
LH ^™ HH ^е HI
The arrows (—►) indicate the direct agglomeration links, the dotted arrows ( ►) – indicate the reverse ones.
According to: Population of cities and towns. Available at: (accessed: May 26, 2020).
The resulting picture reflects, in general, the historically developed specifics of the regional settlement system – the so-called cluster settlement where population is concentrated in large cities, and there are dips between the concentration points3. In such a way, for a long time, three agglomeration formations with centers in Yekaterinburg, N. Tagil and Serov have been preserved in the region. However, their role and prospects in the regional space of the Sverdlovsk Oblast differ. If the Yekaterinburg agglomeration is economic growth point and population attraction center in the region, then N. Tagil and Serov, although still dominating at the local level, not only did not show the agglomeration potential, but also lose their importance as growth points for the settlement system as a whole. Moreover, transformation of the regional space is moving toward the formation of a single Yekaterinburg-Nizhny Tagil agglomeration with the gradual loss of the value of N. Tagil to the level of the second-order core (during the period, the value of the local index for these two territories decreased from 0.0044 to 0.0032). The mutual influence of Yekaterinburg and Serov remains at the same level, the LISA for these territories during the entire period under review is 0.0002 which is more likely due to the significant distance of the Serovsky UD (more than 350 km) than to its significance in the formation of the regional space.
At the same time, development of these agglomeration formations is fixed in the corresponding section of Socio-Economic Development Strategy of the Sverdlovsk Oblast through to 2030 where the idea of balanced development of the region’s territories is spelled out4. However, such a task, in our opinion, contradicts the objective socio-demographic processes taking place in the Sverdlovsk Oblast. In addition, if various tools for Yekaterinburg agglomeration development are actively discussed at the regional and municipal level and appropriate regulatory acts5 are being developed, then for the territories around the city. The task of agglomeration construction remains declarative, as the real processes of tightening the economic space to these points do not occur, the executive authorities do not offer effective measures to retain and consolidate population in these territories, and inter-municipal cooperation is developed rather poorly due to the current system of regulatory environment [30].
Thus, as a result of using spatial econometrics methods for the analysis of the settlement system of the Sverdlovsk Oblast, the authors have confirmed the presence of socio-demographic asymmetry in the form of spatial autocorrelation of population indicators of municipalities. In addition, the analysis of Moran’s global and local indices in dynamics shows a tendency to increase disparity of demographic dynamics in the region.
Based on the results of the structure analysis of Moran’s scattering diagram, we propose a typology of the Sverdlovsk Oblast municipalities depending on the significance of Moran’s local indices and function that the territories perform in the regional space.
The paper has determined the points of agglomeration attraction (3 municipalities), has shown the presence of direct and inverse spatial relationships between the key region’s territories, and has considered the dynamics of their significance in the regional space structure. Thus, two potential points of agglomeration attraction (N. Tagil and Serov) lose their significance in the settlement system in favor of the regional center (Yekaterinburg) for a fairly long period. Around the regional capital, a full-fledged agglomeration association was formed with the presence of a first-order core with satellite territories and the presence of the second-order cores. Close socio-economic ties between these municipalities actualize the issue of managing agglomeration processes, primarily at the inter-municipal level of interaction which is quite problematic in the current legislation and established practice of inter-municipal cooperation.
The scientific novelty of the work is methodology development for studying socio-demographic asymmetry of regional development based on the use of spatial econometrics methods that allow identifying spatial patterns of demographic region’s development. The practical significance of the study is possibility to use the results to justify the strategic directions of the region’s socio-economic development taking into account the identified patterns and trends of the settlement system transformation to level the negative effects of sociodemographic asymmetry and solve the problem of improving the quality of life, regardless of the place of residence.
References Modeling socio-demographic asymmetry of territorial development
- Makarova M.N., Trushkova E.A. Review of theoretical approaches to the study of socio-demographic asymmetry of territorial development. Zhurnal fundamental’nykh issledovanii=Fundamental Research, 2020, no. 9, pp. 67–72. DOI: 10.17513/fr.42846 (in Russian).
- Akperov I.G., Bryukhanova N.V. Managing the region sustainable development in terms of socio-economic processes local asymmetry. Uchenye zapiski Instituta upravleniya, biznesa i prava. Seriya: Ekonomika=Scholarly Notes of the Institute of Management, Business and Law. Series: Economics, 2014, no. 4, pp. 8–17 (in Russian).
- Misakov V., Misakov A., Tsurova L., Eskiyev M., Ilayeva Z. Some asymmetry problems of the socio-economic and political relations of territorial subjects of the Russian Federation. Journal of History Culture and Art Research, 2017, vol. 6 (5), pp. 247–255. DOI: http://dx.doi.org/10.7596/taksad.v6i5.128
- Kuznetsova I.I. The problem of territorial differentiation in the regional economy and the possibility of its study at the city level. Trudy Instituta sistemnogo analiza RAN=Proceeding of the Institute for Systems Analysis of the Russian Academy of Science, 2006, vol. 22, pp. 261–268 (in Russian).
- Lavrovskii B.L. Measuring regional asymmetry on the example of Russia. Voprosy statistiki=Voprosy Statistiki, 1999, no. 3, pp. 45–52 (in Russian).
- Turgel’ I.D. Local asymmetry of regional development: Content, assessment, socio-economic consequences. In: Problemy, uspekhi i trudnosti perekhodnoi ekonomiki (Opyt Rossii i Belarusi) [Problems, successes and difficulties of the economy in transition (experience of Russia and Belarus)]. Ed. by M.A. Portnoi. Moscow: Mosk. obshchestv. nauch. fond, 2000. Pp. 233–243 (in Russian).
- Mysakov V.S., Mysakov A.V. Problems of leveling of the territorial asymmetry of depressed republics of the North Caucasus. Mezhdunarodnyi nauchno-issledovatel’skii zhurnal=International Research Journal, 2017, no. 9 (63), part 1, pp. 19–26 (in Russian).
- Shil’tsin E.A. Regional asymmetry assessment issues. In: Aktual’nye problemy sotsial’no-ekonomicheskogo razvitiya: vzglyad molodykh uchenykh: sb. nauch. tr. [Urgent problems of socio-economic development: The view of young scientists: Collection of research papers]. Ed. by V.E. Seliverstov, V.M. Markova, E.S. Gvozdeva. Novosibirsk: IEOPP SO RAN, 2005. Pp. 143–158 (in Russian).
- Kondusova V.B., Bakhina V.A. Variation analysis of the labor market in administrative-territorial formations of the Orenburg region. Intellekt. Innovatsii. Investitsii=Intellect. Innovation. Investments, 2019, no. 3, pp. 27–35 (in Russian).
- Anikina V.I., Kuz’mich R.I. The smoothing of social-economical differentiation in development of municipal formations in urban agglomeration. Vestnik SibGAU=Siberian Journal of Science and Technology, 2010, no. 2, pp. 183–188 (in Russian).
- Turgel’ I.D., Pobedin A.A. Territorial differentiation of socio-economic development of municipalities in the constituent entity of the Russian Federation: the experience of variational analysis (on the example of the Sverdlovsk region). Regional’naya ekonomika: teoriya i praktika=Regional Economics: Theory and Practice, 2007, no. 12, pp. 12–23 (in Russian).
- Proekt SIRENA: metody izmereniya i otsenki regional’noi asimmetrii [SIRENA Project: Methods for Measuring and Assessing Regional Asymmetry]. Novosibirsk: IEOPP SO RAN, 2002. 248 p.
- Roy O.M., Yudina M.A. Heuristic possibilities of the multi-parametric model of structural diagnostics of the development of the regional systems. Izvestiya Ural’skogo gosudarstvennogo ekonomicheskogo universiteta=Journal of New Economy, 2014, no. 2 (52), pp. 62–68 (in Russian).
- Evchenko A.V. Application of economic and mathematical methods for the analysis of territorial socio-economic asymmetry and the choice of targets for the development of districts. Vestnik Samarskogo gosudarstvennogo universiteta. Seriya «Ekonomika i upravlenie»=Vestnik of Samara University. Economics and Мanagement, 2005, no. 2, pp. 191–197 (in Russian).
- Trotskovskii A.Ya., Mishchenko I.V. Spatial transformations research in the regional economic system. Izvestiya Altaiskogo gosudarstvennogo universiteta=Izvestiya of Altai State University, 2015, no. 2 (86), vol. 1, pp. 181–187 (in Russian).
- Taran O.L. Indikativnaya otsenka sotsial’no-ekonomicheskogo sostoyaniya i razvitiya regional’noi ekonomiki: monografiya [Indicative Assessment of the Socio-Economic State and Development of the Regional Economy: Monograph]. Kislovodsk: T’yutor, 2007. 332 p.
- Gubanova K.S., Klesh V.S. Methods to evaluate uneven socio-economic development of a region. Problemy razvitiya territorii=Problems of Territory’s Development, 2018, no. 6 (98), pp. 30–41. DOI: 10.15838/ptd.2018.6.98.2 (in Russian).
- Benguigui L., Blumenfeld-Lieberthal E. A dynamic model for city size distribution beyond Zipfs law. Physica A: Statistical Mechanics and Its Applications, 2007, vol. 384 (2), pр. 613–627. DOI: 10.1016/j.physa.2007.05.059
- Wu Y., Jiang M., Chang Zh. et al. Does China’s urban development satisfy Zipf’s law? A multiscale perspective from the NPP-VIIRS nighttime light data. International Journal of Environmental Research and Public Health, 2020, vol. 17 (1), no. 1460. DOI: 10.3390/ijerph17041460
- Manaeva I.V. Distribution of cities in federal Districts of Russia: Testing of the Zipf law. Economy of Region, 2019, vol. 15 (1), pp. 84–98. DOI: 10.17059/2019-1-7
- Lanzieri G. Is fertility converging across the member states of the European Union? In: Work Session on Demographic Projections. Lisbon, 28-30 April 2010. Luxembourg: Publications office of the European Union, 2010. Pp. 137–154.
- Spijker J., Recano J., Martinez S. et al. Mortality by cause of death in Colombia: A local analysis using spatial econometrics. Journal of Geographical Systems, 2020 August. DOI: 10.1007/s10109-020-00335-1
- Manesh S.N., Choi, J.O., Shrestha B.K. et al. Spatial analysis of the gender wage gap in architecture, civil engineering, and construction occupations in the United States. Journal of Management in Engineering, 2020, vol. 4, no. 04020023. DOI: 10.1061/(ASCE)ME.1943-5479.0000780
- Mansour Sh., Saleh E., Al-Awadhi T. The effects of sociodemographic characteristics on divorce rates in Oman: Spatial modeling of marital separations. Professional Geographer, vol. 72 (3), pp. 332–347. DOI: 10.1080/00330124.2020.1730196
- Lavrikova Ju.G., Suvorova A.V. Spatial aspects of regional infrastructure distribution (the case of Sverdlovsk region). R-Economy, 2019, vol. 5 (4), pp. 155–167.
- Anselin L. Spatial Econometrics: Methods and Models. Dordrecht: Kluwer Academic Publishers, 1988. 304 p.
- Introduction to Spatial Analysis. Invited Lecture. Population Science and GIS Workshop. UC Santa. 2006. 207 p.
- Moran P. The interpretation of statistical maps. Journal of the Royal Statistical Society, 1948, vol. 10, pp. 243–251.
- Pavlov Yu.V., Koroleva E.N. Spatial interactions: Evaluation with the help of global and local Moran’s index.
- Prostranstvennaya ekonomika=Spatial Economics, 2014, no. 3, pp. 95–110. DOI: 10.14530/se.2014.3.95-110 (in
- Russian).
- Kozlova O.A., Makarova M.N. Inter-municipal cooperation as an institution of strategic development of
- territories. Ekonomicheskie i sotsial’nye peremeny: fakty, tendentsii, prognoz=Economic and Social Changes:
- Facts, Trends, Forecast, 2018, vol. 11, no. 3, pp. 132–144. DOI: 10.15838/esc.2018.3.57.9 (in Russian).
