Models and forecasts of the export potential of the regional economic system

Author: Gerasimov Aleksey N., Gromov Evgeny I., Skripnichenko Yury S., Grigoryeva Oksana P., Skripnichenko Victoria Yu.
Journal: Регионология @regionsar
Section: Экономика и управление народным хозяйством
Article in issue: 4 (121) т.30, 2022.
Free access
Introduction. The export potential of the regional agricultural market causes great interest from both the scientific community and government agencies. Many scientific studies are devoted to the search for methods to increase the export potential in order to ensure the sustainable development of regional economic systems. The article proposes and tests the original author’s algorithm for creating a dynamic econometric model for forecasting the volumes of production, sales and exports of the main types of livestock products at the regional level. The purpose of the article is to assess the export potential of the main products of the regional agricultural market based on the built dynamic econometric models. Materials and Methods. The research is based on a set of empirical data of result and input variables characterizing the production, sales and export of the main livestock products in the region for the period 2010-2020. Research methods include dynamic analysis, econometric modeling and forecasting. The dynamic analysis carried out made it possible to assess the change in the production, sale and export of the main agricultural products in the region, to assess the current trends. Based on the constructed econometric models, the most significant factors influencing the resulting variables were identified, the specifications and verification of the models were carried out. The method of extrapolation of the identified trends made it possible to evaluate the predicted values of the resulting variables for the medium term. Results. Based on the selected input variables, models of production, sale and export of milk, wool and eggs by agricultural producers in the region were built. From a variety of alternative models, models with the best statistical quality characteristics were selected. The high level of quality of the obtained models made it possible to use them for predictive calculations of the levels of resulting variables for the period 2021-2026. Comparison of the results of the forecasts made it possible to identify the types of livestock products that already have a high level of exportability. In addition, types of products with a low level of exportability were identified, which have a high potential for increase. Discussion and Conclusion. As a result of using econometric modeling methods, dynamic models were obtained that made it possible to obtain a forecast for the development of livestock in a region with a high export potential in the near future. The practical significance of this article lies in the possibility of influencing the production, sale and export of livestock products in the region through a change in the corresponding set of factor variables of the models. Thus, the resulting dynamic models can be used both by agricultural producers for planning economic activities, and by regional authorities when drawing up regional development programs.
Dynamic econometric models, forecasting, regional livestock market, export potential of the region
Short address: https://sciup.org/147238978
IDR: 147238978 | UDC: 332.122 | DOI: 10.15507/2413-1407.121.030.202204.762-782
Модели и прогнозы экспортного потенциала региональной экономической системы
Введение. Экспортный потенциал регионального рынка агропродукции вызывает огромный интерес со стороны как научного сообщества, так и государственных структур. Многие научные исследования посвящены вопросам поиска методов увеличения экспортного потенциала в целях обеспечения устойчивого развития региональных экономических систем. Цель статьи - на основе построенных динамических эконометрических моделей оценить экспортный потенциал основных продуктов рынка агропродукции региона. Материалы и методы. В основе исследования лежит набор эмпирических данных целевых и входящих переменных, характеризующих производство, реализацию и экспорт основных видов продукции животноводства региона за период 2010-2020 гг. Проведенный динамический анализ позволил оценить изменение производства, реализации и экспорта основных продуктов сельскохозяйственного производства в регионе, выявить сложившиеся тенденции. На основании построенных эконометрических моделей были определены наиболее существенные факторы, оказывающие воздействие на результативные переменные, проведены спецификация и верификация моделей. Метод экстраполяции выявленных тенденций помог определить прогнозные значения результативных переменных на среднесрочный период. Результаты исследования. На основе отобранных входящих переменных были построены модели производства, реализации и экспорта молока, шерсти и яиц сельскохозяйственными товаропроизводителями региона. Из множества альтернативных вариантов были отобраны модели, обладающие наилучшими статистическими характеристиками качества. Высокий уровень качества полученных моделей позволил использовать их для прогнозных расчетов уровней результативных переменных на период 2021-2026 гг. Сопоставление полученных результатов прогнозов позволило выделить виды продукции животноводства, которые уже обладают высоким уровнем экспортируемости. Кроме того, были определены виды продукции, обладающие низким уровнем экспортируемости, который имеет высокий потенциал для увеличения. Обсуждение и заключение. В результате использования методов эконометрического моделирования получены динамические модели, позволившие спрогнозировать развитие животноводства в регионе, имеющем высокий экспортный потенциал на ближайшую перспективу. Практическая значимость исследования заключается в возможности воздействия на производство, реализацию и экспорт продукции животноводства региона через изменение соответствующего набора факторных переменных моделей. Таким образом, полученные динамические модели могут быть использованы как сельскохозяйственными товаропроизводителями для планирования хозяйственной деятельности, так и органами региональной власти при составлении региональных программ развития.
Text of the scientific article Models and forecasts of the export potential of the regional economic system
Научная статья
Модели и прогнозы экспортного потенциала региональной экономической системы
А. Н. Герасимов, Е. И. Громов, Ю. С. Скрипниченко н ,
О. П. Григорьева, В. Ю. Скрипниченко
Введение. Экспортный потенциал регионального рынка агропродукции вызывает огромный интерес со стороны как научного сообщества, так и государственных структур. Многие научные исследования посвящены вопросам поиска методов увеличения
- экспортного потенциала в целях обеспечения устойчивого развития региональных экономических систем. Цель статьи – на основе построенных динамических эконометрических моделей оценить экспортный потенциал основных продуктов рынка агропродукции региона.
Материалы и методы. В основе исследования лежит набор эмпирических данных целевых и входящих переменных, характеризующих производство, реализацию и экспорт основных видов продукции животноводства региона за период 2010–2020 гг. Проведенный динамический анализ позволил оценить изменение производства, реализации и экспорта основных продуктов сельскохозяйственного производства в регионе, выявить сложившиеся тенденции. На основании построенных эконометрических моделей были определены наиболее существенные факторы, оказывающие воздействие на результативные переменные, проведены спецификация и верификация моделей. Метод экстраполяции выявленных тенденций помог определить прогнозные значения результативных переменных на среднесрочный период.
Результаты исследования. На основе отобранных входящих переменных были построены модели производства, реализации и экспорта молока, шерсти и яиц сельскохозяйственными товаропроизводителями региона. Из множества альтернативных вариантов были отобраны модели, обладающие наилучшими статистическими характеристиками качества. Высокий уровень качества полученных моделей позволил использовать их для прогнозных расчетов уровней результативных переменных на период 2021–2026 гг. Сопоставление полученных результатов прогнозов позволило выделить виды продукции животноводства, которые уже обладают высоким уровнем экспортируемости. Кроме того, были определены виды продукции, обладающие низким уровнем экспортируемости, который имеет высокий потенциал для увеличения.
Обсуждение и заключение. В результате использования методов эконометрического моделирования получены динамические модели, позволившие спрогнозировать развитие животноводства в регионе, имеющем высокий экспортный потенциал на ближайшую перспективу. Практическая значимость исследования заключается в возможности воздействия на производство, реализацию и экспорт продукции животноводства региона через изменение соответствующего набора факторных переменных моделей. Таким образом, полученные динамические модели могут быть использованы как сельскохозяйственными товаропроизводителями для планирования хозяйственной деятельности, так и органами региональной власти при составлении региональных программ развития.
Introduction. The study of the level of export potential of the regional market of agricultural products is of particular relevance against the backdrop of the need to ensure food security both at the regional and federal levels. The purpose of the study is to assess the existing exportability potential of the agro-product regional market, economic and mathematical modeling of existing trends in its development, as well as forecasting the prospective exportability potential of agricultural products.
In this research, the authors tried to consider the potential for export-oriented livestock production in the region. The types of these products include those that already have a fairly high level of exportability (for example, milk). In addition, we consider it necessary to include in the consideration also the production of such types of products that currently have a rather low level of exportability, but at the same time have a high potential for increasing the exportability of products in the future (for example, the production of wool and eggs).
Literature review. Some researchers note that achieving sustainable development goals, increasing competitiveness and gaining access to foreign markets is a difficult task, but this is a prerequisite for exporting products to foreign markets [1].
Many publications are devoted to the issues of the impact of the COVID-19 outbreak on the disruption of agricultural supply chains. So, the scientists found that although the average export of agricultural enterprises decreased, the export of some agricultural products remained strong and even increased. This fact indicates a significant demand for basic foodstuffs during the pandemic [2]. N. Mtimet, F. Wanyoike, K. M. Rich, I. Baltenweck emphasize the multifaceted and often overlooked socio-economic and socio-cultural impacts faced by the livestock sector and the wider economy as a result of public health restrictions [3]. C. Béné, D. Bakker, M. J. Chavarro, B. Even, J. Melo, A. Sonneveld present global assessments of the impact of COVID-19 on food systems and their actors, focusing on the food security and nutritional status of those affected in low- and middle-income countries [4].
Domestic authors note that an important component of the development of the regional economic system is the provision of import substitution and the establishment of food security [5]. The researchers identify six enlarged groups of food products, for which there is a possibility of exporting food to other regions of Russia [6]. These groups of goods also include milk and dairy products, meat and meat products, eggs [7].
K. R. Chegini, M. R. Pakravan-Charvadeh, M. Rahimian, S. Gholamrezaie assessed the relationship of household livelihoods and income inequality with the sustainability of regional economic systems in rural areas [8].
J. Clapp, W. G. Moseley, B. Burlingame, P. Termine believe that the definition of food security needs to be updated. Thus, the authors propose to understand food security as based on six key pillars: availability, access, use, stability, activity and sustainability [9].
S. J. Smyth, S. R. Webb, P. W. B. Phillips believe that public-private partnerships allow the use of market mechanisms to improve agri-food systems, thereby reducing food insecurity and promoting rural development [10].
The issues of the development of the Russian agro-industrial complex in the context of economic sanctions are discussed in the works of R. M. Nureev, E. G. Busygin, A. V. Gorbatov, O. A. Kryoshina, O. G. Chaplygina. The authors specifically note that the livestock industry is in a difficult position. At the same time, the high agricultural potential of Russia is noted [11–13].
-
Methodical issues of assessing the state and development of the potential of regional livestock breeding are considered in the works of S. G. Chernova, O. P. Zaitseva, O. A. Kozlova, L. Reuter, N. Eremeeva, I. Vedenkina, A. Akopyan [14–16].
The formation of the cost of certain types of livestock products was dealt with by L. M. Chekmareva and E. I. Enina. The authors note that the cost of livestock products is formed under the influence of many technical and technological, external and internal, main and secondary factors. The most important of these factors, the authors consider the productivity of farm animals and the cost of their maintenance [17].
V. Rohr, J. Blakley, P. Loring contains the study of the criteria and approaches to assessing the prospects for the development of regional economic systems. They should be aligned with established principles and procedures for regional strategic environmental assessment (RSEA) to inform the development of a conceptual framework to guide food security assessment in RSEA initiatives [18].
H. Deléglise, R. Interdonato, A. Bégué, E. Maître d’Hôtel, M. Teisseire, M. Roche built a food security forecast based on heterogeneous data based on state-of-the-art machine learning and deep learning models. The authors believe that modern data processing methods make it possible to obtain the most reliable forecasts [19].
Thus, modeling the agricultural products market and using the models obtained will allow not only to state the existing high level of export-oriented agricultural products in the region, but also to reveal the export potential of types of products that have a low level of exportability and a high potential for its increase in the future.
Materials and Methods. To assess the level of potential exportability of the main types of livestock products in the region, it is advisable to use dynamic econometric models. Such models make it possible to identify current trends in the production, sale and export of livestock products. In addition, the practical application of dynamic models makes it possible to predict the behavior of the studied indicators in the future with a certain degree of accuracy. Statistical quality characteristics obtained as a result of constructing econometric models make it possible to evaluate the quality of the models obtained and the forecasts made.
Figure 1 shows the algorithm for constructing interrelated dynamic econometric models that was used in this research.
To perform the first stage of the modelling algorithm, the following result variables were selected:
-
- milk production, thousand tons;
-
- milk sales, thousand tons;
-
- milk export, thousand tons,
-
- wool production, thousand tons,
-
- wool sales, thousand tons,
-
- wool export, thousand tons,
-
- egg production, million,
-
- egg sales, million;
-
- egg export, millions.

Milk production model

Milk sales model
Milk export model
Wool production model
Wool sales model
Wool export model
Egg production model
Egg sales model
Egg export model

F i g. 1. Algorithm for constructing dynamic econometric model
To implement the second stage of the model building algorithm, official publications of the Federal State Statistics Service were used. Data were collected for 2010–2020.
The following are the results of the third stage of the model building algorithm.
Milk production model:
MP = a + b • X1 + c • X2 + d • X3 + e • MS,
where M P – result variable ‘Milk production’ (thousand tons); X 1 – input variable ‘Profitability of milk production’ (%); X 2 – input variable ‘Direct labor input for milk production’ (thousand man-hour); X 3 – input variable ‘Number of cows in agricultural enterprises’ (thousand heads); M S – input variable ‘Milk Sales’ (thousand
У^У - tons); a – constant; b – regression coefficient that determines the change in milk production under the influence of changes in the profitability of milk production; c – regression coefficient that determines the change in milk production under the influence of changes in the Direct labor costs for milk production; d – regression coefficient that determines the change in milk production under the influence of changes in the number of cows in agricultural enterprises; e – regression coefficient that determines the change in milk production under the influence of changes in the milk sales.
Milk sales model:
M S = a + b • X 1 + c • X 2 + d • X 3 + e • X 4 + f • X 5 + g • M P , (2)
where M S – result variable ‘Milk sales’ (thousand tons); X 1 – input variable ‘Profitability of milk production’ (%); X 2 – input variable ‘Direct labor costs for milk production’ (thousand man-hour); X 3 – input variable ‘Number of cows in agricultural enterprises’ (thousand heads); X 4 – input variable ‘Average monthly accrued wages of employees’ (rubles); X 5 – input variable ‘Average per capita metary income of the population per month’ (rubles); M P – input variable ‘Milk production’ (thousand tons); a – constant; b – regression coefficient that determines the change in milk sales under the influence of changes in the profitability of milk production; c – regression coefficient that determines the change in milk sales under the influence of changes in the direct labor costs for milk production; d – regression coefficient that determines the change in milk sales under the influence of changes in the number of cows in agricultural enterprises; e – regression coefficient that determines the change in milk sales under the influence of changes in the average monthly accrued wages of employees; f – regression coefficient that determines the change in milk sales under the influence of changes in the average per capita monetary income of the population per month; g – regression coefficient that determines the change in milk sales under the influence of changes in the milk production.
Milk export model:
Mp — a + b • Xx + c • X^ + d * Mpi (3)
E12 P where ME – result variable ‘Milk export’ (thousand tons); X1 – input variable ‘Profitability of milk production’ (%); X2 – input variable ‘Direct labor costs for milk production’ (thousand man-hour); MP – input variable ‘Milk production’ (thousand tons); a – constant; b – regression coefficient that determines the change in milk export under the influence of changes in the profitability of milk production; c – regression coefficient that determines the change in milk export under the influence of changes in the direct labor costs for milk production; d – regression coefficient that determines the change in milk export under the influence of changes in the milk production.
Wool production model:
W P = a + b • X 1 + c • X 2 + d • W S , (4)
where W P – result variable ‘Wool production’ (thousand tons); X 1 – input variable ‘Profitability of wool production’ (%); X 2 – input variable ‘Direct labor input for wool production’ (thousand man-hour); W S – input variable ‘Wool sales’ (thousand tons); a – constant; b – regression coefficient that determines the change in wool production under the influence of changes in the profitability of wool production; c – regression coefficient that determines the change in wool production under the influence of changes in the direct labor input for wool production; d – regression coefficient that determines the change in wool production under the influence of changes in the wool sales.
Wool sales model:
W, = a + b • X. + c • X 7 + d • X , + e • Wp, (5)
S12 3 P, where WS – result variable ‘Wool sales’ (thousand tons); X1 – input variable ‘Profitability of wool production’ (%); X2 – input variable ‘Direct labor input for wool production’ (thousand man-hour); X3 – input variable ‘Livestock of sheep and goats in agricultural enterprises’ (thousand heads); WP – input variable ‘Wool production’ (thousand tons); a – constant; b – regression coefficient that determines the change in wool sales under the influence of changes in the profitability of wool production; c – regression coefficient that determines the change in wool sales under the influence of changes in the direct labor input for wool production; d – regression coefficient that determines the change in wool sales under the influence of changes in the livestock of sheep and goats in agricultural enterprises; e – regression coefficient that determines the change in wool sales under the influence of changes in the livestock of sheep and goats in wool production.
Wool export model:
WF = a + b • X. + c • X + d • Wp , (6)
E12P where WE – result variable ‘Wool export’ (thousand tons); X1 – input variable ‘Profitability of wool production’ (%); X2 – input variable ‘Livestock of sheep and goats in agricultural enterprises’ (thousand heads); WP – input variable ‘Wool production’ (thousand tons); a – constant; b – regression coefficient that determines the change in wool export under the influence of changes in the profitability of wool production; c – regression coefficient that determines the change in wool export under the influence of changes in the livestock of sheep and goats in agricultural enterprises; d – regression coefficient that determines the change in wool export under the influence of changes in the wool production.
У^У -
Egg production model:
E P = a + b • X 1 + c • X 2 + d • X 3 + e • E S , (7)
where E P – result variable ‘Egg production’ (millions); X 1 – input variable ‘Profitability of egg production’ (%); X 2 – input variable ‘Direct labor input for egg production’ (thousand man-hour); X 3 – input variable ‘Poultry stock in agricultural enterprises’ (thousand heads); E S – input variable ‘Egg sales’ (millions); a – constant; b – regression coefficient that determines the change in egg production under the influence of changes in the profitability of egg production; c – regression coefficient that determines the change in egg production under the influence of changes in the direct labor input for egg production; d – regression coefficient that determines the change in egg production under t influence of changes in the poultry stock in agricultural enterprises’; e – regression coefficient that determines the change in egg production under the influence of changes in the egg sales.
Egg sales model:
E s = a + b • X 1 + c • X 2 + d • X 3 + e • X 4 + fE p , (8)
where E S – result variable ‘Egg sales’ (millions); X 1 – input variable ‘Profitability of egg production’ (%); X 2 – input variable ‘Direct labor input for egg production’ (thousand man-hour); X 3 – input variable ‘Average monthly salary of employees’ (rubles); X 4 – input variable ‘Average per capita monetary income of the population per month’ (rubles); E P – input variable ‘Egg production’ (millions); a – constant; b – regression coefficient that determines the change in egg sales under the influence of changes in the profitability of egg production; c – regression coefficient that determines the change in egg sales under the influence of changes in the direct labor input for egg production; d – regression coefficient that determines the change in egg sales under the influence of changes in the average monthly salary of employees; e – regression coefficient that determines the change in egg sales under the influence of changes in the average per capita monetary income of the population per month.
Egg export model:
Ef = a + b • X, + c • X^ + d • E P, (9)
E12P where EE – result variable ‘Egg export’ (millions); X1 – input variable ‘Profitability of egg production’ (%); X2 – input variable ‘Direct labor input for egg production’ (thousand man-hour); EP – input variable ‘Egg production’ (millions); a – constant; b – regression coefficient that determines the change in egg export under the influence of changes in the profitability of egg production; c – regression coefficient that determines the change in egg export under the influence of changes in the
Direct labor input for egg production; d – regression coefficient that determines the change in egg export under the influence of changes in the egg production.
Results. After the implementation of the fourth stage, the following results were obtained. Table 1 shows the simulation results for the milk production model in the Stavropol Territory.
T a b l e 1. Milk production model
|
Regression coefficient |
Regression coefficient value |
R-Squared |
Standard Deviation |
F-Test |
p-Value |
|
a |
22.60 |
||||
|
b c |
˗0.20 0.87 |
0.973 |
1.9 |
40.8 |
0.021 |
|
d |
0.90 |
That model was fitted to a data set as the best model. Verification of the model indicates its practical applicability. Thus, the value of the F-test for milk production model indicates that the factorial variance exceeds the residual by 40.8 times. The p-value shows the probability of error at which it is permissible to reject the null hypothesis and accept the alternative. So, the probability of such an error is 2.1% for milk production model.
Therefore, we can conclude that the model is highly significant. The R-squared level estimates the degree of accuracy with which the resulting regression equation approximates the original data. In accordance with it, the volume of milk production by agricultural organizations of the Stavropol region was explained by 97.3% by the variation of the factors included in the model.
Table 2 shows the simulation results for the milk sales model in the Stavropol Territory.
T a b l e 2. Milk sales model
f 0.01
g 1.02
That model was fitted to a data set as the best model. Verification of the model indicates its high practical applicability. Thus, the value of the F-test for milk sales model indicates that the factorial variance exceeds the residual by 20.3 times. The
- p-value indicates that the probability of error for the milk sales model, at which it is permissible to reject the null hypothesis and accept the alternative, is 1.6%. Therefore, we can conclude that the model is highly significant. In accordance with the R-squared level, the volume of milk sales by agricultural organizations of the Stavropol Territory was explained by 98.1% by the variation of the factors included in the model.
Table 3 shows the simulation results for the milk export model in the Stavropol Territory.
T a b l e 3. Milk export model
|
Regression coefficient |
Regression coefficient value |
R-Squared |
Standard Deviation |
F-Test |
p-Value |
|
a |
13.10 |
||||
|
b |
0.30 |
0.902 |
24.3 |
40.2 |
0.032 |
|
c |
0.92 |
||||
|
d |
0.84 |
Verification of the model indicates its high practical applicability. The obtained values of the regression coefficients allow us to conclude that the profitability of milk production, direct labor costs for milk production and milk production has a significant effect on the volume of milk exports. Thus, an increase in the profitability of milk production by 1%, milk exports will increase by 0.3 thousand tons. At the same time, an increase in the direct labor costs for milk production by 1 thousand man-hour will affect the increase in export volume by 0.92 thousand tons. Milk export directly depend on the volume of its production: an increase in milk production by 1 thousand tons, export volume will increase by 0.84 thousand tons.
The high quality of the econometric models obtained allows them to be used to assess the forecast levels of production, sale and export of milk by agricultural organizations for the period 2021–2026.
Table 4 shows the simulation results for the wool production model in the Stavropol Territory.
T a b l e 4. Wool production model
|
Regression coefficient |
Regression coefficient value |
R-Squared |
Standard Deviation |
F-Test |
p-Value |
|
a |
7.70 |
||||
|
b |
0.06 |
0.867 |
0.2 |
6.4 |
0.042 |
|
c |
˗0.01 |
||||
|
d |
0.11 |
Verification of the model indicates its high practical applicability. Thus, the value of the F-test for wool production model indicates that the factorial variance exceeds the residual by 6.4 times. The p-value indicates that the probability of error for the wool production model, at which it is permissible to reject the null hypothesis and accept the alternative, is 4.2%. Therefore, we can conclude that the model is highly significant. In accordance with the R-squared level, the volume of wool production by agricultural organizations of the Stavropol Territory was explained by 86.7% by the variation of the factors included in the model.
Table 5 shows the simulation results for the wool sales model in the Stavropol Territory.
T a b l e 5. Wool sales model
e ˗0.350
Verification of the model indicates its high practical applicability. Thus, the value of the F-test for wool sales model indicates that the factorial variance exceeds the residual by 4.1 times. The p-value indicates that the probability of error for the wool sales model, at which it is permissible to reject the null hypothesis and accept the alternative, is 1.3%. Therefore, we can conclude that the model is highly significant. In accordance with the R-squared level, the volume of wool sales by agricultural organizations of the Stavropol Territory was explained by 91.6% by the variation of the factors included in the model.
Table 6 shows the simulation results for the wool export model in the Stavropol Territory.
T a b l e 6. Wool export model
|
Regression coefficient |
Regression coefficient value |
R-Squared |
Standard Deviation |
F-Test |
p-Value |
|
a |
0.64 |
||||
|
b |
0.04 |
0.914 |
0.4 |
24.8 |
0.014 |
|
c |
0.06 |
||||
|
d |
0.40 |
Verification of the model indicates its high practical applicability. The obtained values of the regression coefficients allow us to conclude that wool production has a significant effect on the volume of wool exports. Thus, an increase in the wool production by 1 thousand tons, wool exports will increase by 0.4 thousand tons. In addition, an increase in the Profitability of wool production by 1% affects the increase in wool export volume by 0.04 thousand tons.

Table 7 shows the simulation results for the egg production model in the Stavropol Territory.
T a b l e 7. Egg production model
e 0.46
Verification of the model indicates its high practical applicability. Thus, the value of the F-test for egg production model indicates that the factorial variance exceeds the residual by 47.5 times. The p-value indicates that the probability of error for the egg production model, at which it is permissible to reject the null hypothesis and accept the alternative, is 0.2%. Therefore, we can conclude that the model is highly significant. In accordance with the R-squared level, the volume of egg production by agricultural organizations of the Stavropol Territory was explained by 93.4% by the variation of the factors included in the model.
Table 8 shows the simulation results for the egg sales model in the Stavropol Territory.
T a b l e 8. Egg sales model
|
Regression coefficient |
Regression coefficient value |
R-Squared |
Standard Deviation |
F-Test |
p-Value |
|
a |
˗392.200 |
||||
|
b |
˗0.800 |
||||
|
c |
0.070 |
||||
|
0.927 |
4.6 |
45.3 |
0.001 |
||
|
d |
˗0.011 |
||||
|
e |
0.014 |
||||
|
f |
1.260 |
Verification of the model indicates its high practical applicability. Thus, the value of the F-test for egg sales model indicates that the factorial variance exceeds the residual by 45.3 times. The p-value indicates that the probability of error for the egg sales model, at which it is permissible to reject the null hypothesis and accept the alternative, is 0.1%. Therefore, we can conclude that the model is highly significant.
In accordance with the R-squared level, the volume of egg sales by agricultural organizations of the Stavropol Territory was explained by 92.7% by the variation of the factors included in the model.
Table 9 shows the simulation results for the egg export model in the Stavropol Territory.
T a b l e 9. Egg export model
|
Regression coefficient |
Regression coefficient value |
R-Squared |
Standard Deviation |
F-Test |
p-Value |
|
a |
31.40 |
||||
|
b |
0.06 |
0.967 |
6.4 |
33.2 |
0.003 |
|
c |
0.09 |
||||
|
d |
0.70 |
Verification of the model indicates its high practical applicability. The obtained values of the regression coefficients allow us to conclude that egg production has a significant effect on the volume of egg exports.
Thus, an increase in the egg production by 1 million, egg exports will increase by 0.7 million. In addition, an increase in the Profitability of egg production on 1% affects the increase in egg export volume by 0.06 million.
Discussion and Conclusion. Built on the basis of the proposed algorithm, dynamic econometric models of production, sale and export of the main types of livestock products in the Stavropol region are distinguished by a high level of statistical quality characteristics. This allows you to successfully use them to predict the presented indicators in the short term.
The forecasts of the result variables of the milk production, milk sales and milk export models are presented in Figure 2.
In accordance with the forecast results, milk production in the Stavropol Territory from 2021 to 2026 will increase from 139.8 to 143.5 thousand tons, that is, there will be an increase of 3.7 thousand tons, or 2.6%.
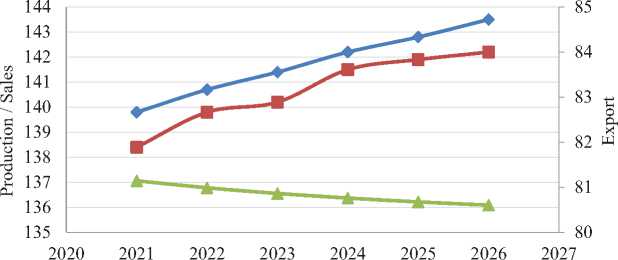
—♦—Milk Production —■-Milk Sales —*—Milk Export (alternate axis)
F i g. 2. Results of forecasting production, sales and export of milk, thousand tons
Milk sales in the Stavropol Territory from 2021 to 2026 will increase from 138.4 to 142.2 thousand tons, that is, there will be an increase of 3.8 thousand tons or 2.7%.
Despite the expected increase in milk production, its exports are expected to decline during 2021–2026 in accordance with the results of forecast calculations. Milk exports in the Stavropol Territory from 2021 to 2026 will decrease from 81,1 to 80.6 thousand tons, that is, there will be decrease of 0,5 thousand tons or 0.7%.
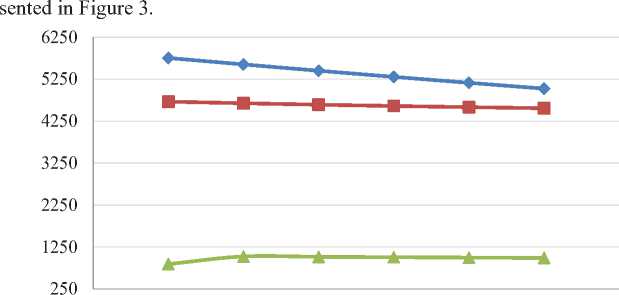
The forecasts of wool production, wool sales and wool export models are pre-
2020 2021 2022 2023 2024 2025 2026 2027
Wool Production —■-Wool Sales —*—Wool Export
F i g. 3. Results of forecasting production, sales and export of wool, tons
In accordance with the forecast results, wool production in the Stavropol Territory from 2021 to 2026 will decrease from 5,756.5 to 5,025.8 tons, that is, there will be decrease of 730.7 tons or 12.7%.
Wool sales in the Stavropol Territory from 2021 to 2026 will decrease from 4,715.1 to 4,557.9 tons, that is, there will be decrease of 157.1 tons or 3.3%.
Wool exports in the Stavropol Territory from 2021 to 2026 will increase from 843 to 988.5 tons, that is, there will be an increase of 145.5 tons or 17.3%.
Thus, the share of the exported volume of produced wool is insignificant. It does not exceed 20%.
The forecasts of the result variables of the egg production, egg sales and egg export models are presented in Figure 4.
In accordance with the forecast results, egg production in the Stavropol Territory from 2021 to 2026 will increase from 803.7 to 858.8 million, that is, there will be an increase of 55.1 million or 6.9%.
Egg sales in the Stavropol Territory from 2021 to 2026 will increase from 404.4 to 412.1 million, that is, there will be an increase of 7.7 million eggs or 1.9%.
Egg exports in the Stavropol Territory from 2021 to 2026 will decrease from 25.1 to 23.1 million, that is, there will be an decrease of 2.1 million or 8.2%.
со р о
s
2020 2021 2022 2023
2024 2025 2026 2027

о
—•—Egg Production —■-Egg Sales —*—Egg Export (alternate axis)
F i g. 4. Results of forecasting production, sales and export of egg, millions
The results of the forecast allow us to conclude that the export potential of milk production can be considered quite high. At the same time, the expected export volumes obtained on the basis of forecast calculations will decrease in the coming years.
The results obtained for the production, sale and export of eggs and wool in the Stavropol region show a significantly lower level of exportability of these types of products. In addition, export volumes will also decline until 2026. However, it should be noted that this may mean that these areas of livestock production have a high potential for increasing the volume of exports of agricultural products presented.
As a result of the study, it was found that the livestock sub-sector of agricultural production in the Stavropol Territory is characterized by an uneven export potential of certain types of products. The practical significance of the obtained models and predictive estimates lies in the possibility of making informed management decisions in the regionʼs agriculture, taking into account the expected decline in production and sales of certain types of products in order to influence the required level of exportability. At the same time, the results obtained for products with a high level of exportability allow increasing the potential for their use in the future.
References Models and forecasts of the export potential of the regional economic system
- Yadav D., Dutta G., Kumar S. Food Safety Standards Adoption and its Impact on Firms' Export Performance: A Systematic Literature Review. Journal of Cleaner Production. 2021;329. doi: https://doi.oig/10.1016/jjdepro.202U29708
- Lin B., Zhang Y.Y. Impact of the COVID-19 Pandemic on Agricultural Exports. Journal of Integrative Agriculture. 2020;19(12):2937-2945. doi: https://doi.org/10.1016/ S2095-3119(20)63430-X
- Mtimet N., Wanyoike F., Rich K.M., Baltenweck I. Zoonotic Diseases and the COVID-19 Pandemic: Economic Impacts on Somaliland's Livestock Exports to Saudi Arabia. Global Food Security. 2021;28. doi: https://doi.org/10.1016/). gfs.2021.100512
- Bene C., Bakker D., Chavarro M.J., Even B., Melo J., Sonneveld A. Global Assessment of the Impacts of COVID-19 on Food Security. Global Food Security. 2021;31. doi: https://doi.org/10.1016/j.gfs.2021.100575
- Merkulova E.Yu., Moskovtsev V.V. Food Security of the Region: The Analysis of Import Substitution in the Tambov Region. Social-Economic Phenomena and Processes. 2015;10(8):78-86. Available at: https://www.elibrary.ru/item.asp?id=24927507 (accessed 04.10.2022). (In Russ., abstract in Eng.)
- Kabanenko M.N., Ugrimova S.N. The Potential of Ensuring Food Security of Russia. Basic Research. 2019;(5):40-44. (In Russ., abstract in Eng.) doi: https://doi.org/10.17513/ fr.42458
- Dudin M.N., Omarova Z.K. Import Substitution in Agro-Industrial Complex as a Strategic the Direction of Ensuring the National Securities. CITISE. 2019;(2). Available at: https://ma123.ru/ru/2019/05/2-^№H/ (accessed 04.10.2022). (In Russ., abstract in Eng.)
- Chegini K.R., Pakravan-Charvadeh M.R., Rahimian M., Gholamrezaie S. Is there a Linkage between Household Welfare and Income Inequality, and Food Security to Achieve Sustainable Development Goals? Journal of Cleaner Production. 2021;326. doi: https://doi. org/10.1016/j.jclepro.2021.129390
- Clapp J., Moseley W.G., Burlingame B., Termine P. Viewpoint: The Case for a Six-Dimensional Food Security Framework. Food Policy. 2022;106. doi: https://doi. org/10.1016/j.foodpol.2021.102164
- Smyth S.J., Webb S.R., Phillips P.W.B. The Role of Public-Private Partnerships in Improving Global Food Security. Global Food Security. 2021;31. doi: https://doi. org/10.1016/j.gfs.2021.100588
- Chaplygina O.G. Export and Import of Russian Agricultural Products and Food: Current Trends of Development. Geopolitics and Ecogeodynamics of Regions. 2018;4(4):292-300. Available at: http://geopolitika.cfuv.ru/wp-content/ uploads/2018/10/029chaplygina.pdf (accessed 04.10.2022). (In Russ., abstract in Eng.)
- Gorbatov A.V., Krioshina O.A. Results and Prospects of Ensuring Stability of National Agrarian and Industrial Complex: Program and Target Approach. Economics: Yesterday, Today and Tomorrow. 2017;7(5В):291-307. Available at: http://publishing-vak.ru/ file/archive-economy-2017-5b/2-gorbatov-krioshina.pdf (accessed 04.10.2022). (In Russ., abstract in Eng.)
- Nureev R.M., Busygin E.G. The Russian Agro-Industrial Complex in the Conditions of Economic Sanctions: Problems of Improving the Effectiveness of the Import Substitution Policy. Russian Journal of Economic Theory. 2017;(4):8-25. Available at: https://jet-rassia.com/российский-агропромышленный-комплек/ (accessed 04.10.2022). (In Russ., abstract in Eng.)
- Chernova S.G. Current Situation and Calculation of Indicators of Dairycattle Breeding Development in the Region. Vestnik NGAU (Novosibirsk State Agrarian University). 2017;(4):201-207. Available at: https://vestngau.elpub.ru/jour/article/view/862 (accessed 04.10.2022). (In Russ., abstract in Eng.)
- Roiter L.M., Eremeeva N.A., Vedenkina I.V., Akopyan A.G. Calculation of the Market Potential of Eggs and their Products. Economics of Agriculture of Russia. 2021;(6):93-99. (In Russ., abstract in Eng.) doi: https://doi.org/10.32651/216-93
- Zaitseva O.P., Kozlova O.A. Evaluation of Exporter Potential of Dairy Products of Omsk Region. Vestnik Sibirskogo Instituta Biznesa i Informatsionnykh Tekhnologii. 2018;(2):22-27. Available at: https://www.elibrary.ru/item.asp?id=35112039 (accessed 04.10.2022). (In Russ., abstract in Eng.)
- Chekmareva L.M., Enina E.I. [The Dependence of Factors in the Formation of the Cost of the Main Types of Livestock Products]. Agro-Food Policy in Russia. 2015;(2):39-41. Available at: https://elibrary.ru/item.asp?id=23591636 (accessed 04.10.2022). (In Russ., abstract in Eng.)
- Rohr V., Blakley J., Loring P. A Framework to Assess Food Security in Regional Strategic Environmental Assessment. Environmental Impact Assessment Review. 2021;91. doi: https://doi.org/10.1016Zj.eiar.2021.106674
- Deléglise H., Interdonato R., Bégué A., Maître d'Hôtel E., Teisseire M., Roche M. Food Security Prediction from Heterogeneous Data Combining Machine and Deep Learning Methods. Expert Systems with Applications. 2022;190. doi: https://doi.org/10.1016/j. eswa.2021.116189
