Modern trends in the formation of human resources as a factor in sustainable development of China's economy

Author: Krasova Elena Viktorovna, Yang Xin Xiu
Journal: Economic and Social Changes: Facts, Trends, Forecast @volnc-esc-en
Section: Foreign experience
Article in issue: 3 (45) т.9, 2016.
Free access
The processes of human resources formation and development are among the topical areas of research on the growth of national economies. China, like other developing countries, is building an innovation economy, and considers its national human capital as a key factor in its further growth. China has the greatest amount of human resources among all countries of the world, which largely ensures its success in the global economy; however, birth control policy and other factors led to the emergence of several issues that may have a significant impact on the formation of human capital and further economic growth of the country. The purpose of the present study is to reveal modern trends in the formation of human resources of China by considering the demographic, urban and economic aspects. The paper defines the concept of national human resources, substantiates the urgency of a comprehensive research into the accumulation of human potential in a populous country such as China...
Human resources, human resources in china, human capital in china, economic development of china, demographic development of china, chinese urbanization, gdp of china, economy of china's provinces
Short address: https://sciup.org/147223837
IDR: 147223837 | UDC: 332.13 | DOI: 10.15838/esc.2016.3.45.12
Text of the scientific article Modern trends in the formation of human resources as a factor in sustainable development of China's economy
Human resources are nowadays in the focus of attention of the concepts of sustainable development – it is one of the most important modern economic categories combining various people’s peculiarities and qualities, determining their ability to produce goods and serving as a summarizing indicator of the role of the human factor in public production development [5, p. 16]. All countries in the process of building a post-industrial economy consider human resources and human capital accumulated on their basis as a key factor in development, the priority of which is explained by the transformation of national economies, their innovative tendency and an increased share of high technology products in world export over the past half of the century. All the facts mentioned above explain high demand for analyzing various aspects of human resources and evaluating long-term trends of their development on a nationwide scale.
Given the multi-aspect nature of the concept of “human resources”, the subject of the research should be specified. It is obvious that the research is referred to national human resources with macroeconomic specific nature. In a narrow sense, human resources of the country may be described as a set of quantitative and qualitative population characteristics, which determine the character and rate of national economy development. In a broad sense, they represent an intensive factor in socio-economic development of the country, a power source of the economic system or, in the context of human capital, a trigger for innovation waves [9].
The study of human resources as a national production factor stipulates the use of indicators that link the “human” component of the resource base of society to economic development of the country ( tab. 1 ). A system of such indicators is necessary for complex characteristics of human resources. It also serves as an estimation basis for accumulated human capital in further research.
A rapidly developing country such as China creates on a complex and systematic basis the conditions for innovative development wave that involve accumulating and increasing human capital quality. China started its reforms with a rather technocratic approach to the management of human resources, where numerous uneducated and powerless workforce submitted to the
Table 1. Indicators characterizing human recourse formation trends as a factor in economic development
The implementation of this concept, the restructuring of the spheres of education, health, information, etc. has forced China to create an innovative model of human resources management. As a result the “passive resource” of the Chinese economy has been regarded as an “active participant in the production process” and excessive and cheap workforce has become “a unique and unrivaled in the number and structure” of human capital [3, pp. 56-65]. Chinese scientists, following their Western counterparts, are currently considering the country’s national human capacity as one of the most important strategic resources, which determine total national power and form so-called “hard power” (material resources), which, together with “soft power” (culture and mentality), ensure China’s national competitiveness in the international economy [17].
However, many researchers recognize the dual and contradictory character of China’s current demographic situation and account it for the one child birth control policy implemented in 1979 [8; 10; 13; 19]. The main negative consequence of the policy is the reduction and aging of working population, which, according to some experts, results in a whole set of socioeconomic problems. “Low-paid Chinese labor, which has long been used throughout the world, may be exhausted in the next few years. Workforce reduction may significantly slow down China’s development” [19, pp. 86-87]. Widely discussed processes, derived from demographic problems, such as increasing social burden, falling domestic demand and investment and production opportunity loss “directly threaten the prosperous development of the Chinese economy” [10, p. 191]. The present study, developing a topical issue relevant to the whole world, sets as one of the objectives a number of China’s socio-economic parameters coming from demographic changes and possible effects of these changes in the short and long term.
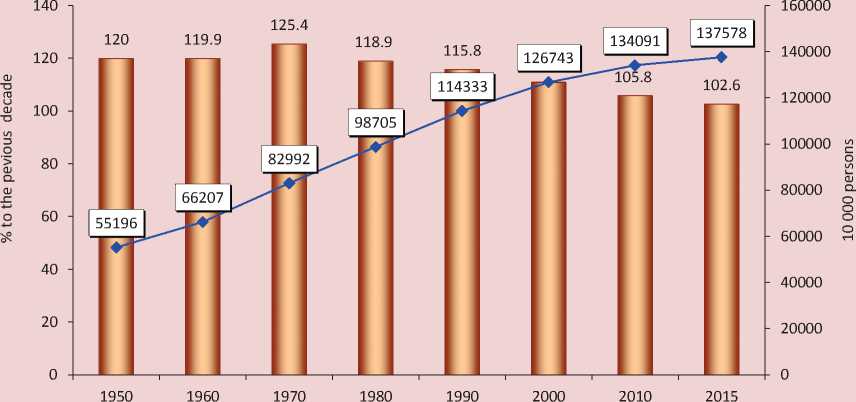
Nowadays China has one of the most dynamic economies in the world, displaying unrivalled high rate of national production growth. Taking up 16.6% of world’s GDP (world’s top in 2015), China comprises 18.6% of the world population [11], reflecting a unique situation of double leadership: none of the populous countries of the world has yet beaten China in terms of economic development and none of the developed nations can be compared with China in terms of demographic capacity. As of April 1, 2016 China’s population comprises 1 375 787 thousand people, the population growth over the past 50 years amounts to 715 million people (208%) and annual average population growth rates over the same period equal 3.8% (fig. 1).
Despite positive natural population growth, the one child policy has substantially reduced the annual growth rate: in 1970s it comprised 1.9%, in 1980s – 1.6%, in 1990s – 1.1%, in 2000s – 0.6%, and from 2010 to 2015 – 0.49% [11]. Accordingly, the role of China in global population growth has been changing ( tab. 2 ).
According to the UN forecasts, the population of China will peak at around 1,400 million people by 2030 and then will begin to decline [11]. Even despite the loosening of the demographic policy and the permission to have two children in the family, starting from 1st January 2016 [2], China may only succeed to return to a steady positive trend of population growth only after several decades. This may happen as a result of two main reasons: the consequences of artificial birth control in 1979–2015 and profound changes in the lifestyle and mindset of the Chinese people which occurred as a result of economic reforms.
Over the last 40 years tough but rather effective birth control measures have not only prevented 400 million births [2], but have also led to a significant deformation of population’s age composition. In 1982 the proportion of young people aged 0–14 comprised 33.6% of the total population, and the proportion of older persons aged
Figure 1. Population Dynamics of China from 1950 to 2015
-
■ 1 Population growth rate by decades — ♦ — Total population
Source: China Statistical Yearbook 2015 / an official website of National Bureau of Statistics of China. – Available at: http:// www.stats.gov.cn/tjsj/ndsj/2015/indexeh.htm .
Table 2. China’s position in global population growth in 2010–2015, million people
|
Year |
Natural growth |
Growth rate, % |
Natural growth |
Growth rate, % |
China’s share in global population growth, % |
|
China |
World |
||||
|
2010 |
7 162 |
0.48 |
79 516 |
1.17 |
9.0 |
|
2011 |
7 206 |
0.48 |
87 741 |
1.28 |
8.2 |
|
2012 |
7 212 |
0.49 |
77 049 |
1.11 |
9.4 |
|
2013 |
7 127 |
0.49 |
79 813 |
1.13 |
8.9 |
|
2014 |
6 921 |
0.52 |
81 091 |
1.14 |
8.5 |
|
2015 |
6 613 |
0.48 |
82 383 |
1.14 |
8.0 |
Source: Concise Report on the World Population Situation,2014: the UN Report. The UN Official Website. Available at: en/development/desa/population/publications/.pdf.
65 and over comprised 4.9%, by 2015, the figures comprised 16.5% and 10.1%, respectively. The proportion of workingage population has rapidly risen over the 1982 to 2015 period from 61.5% to 73.9%, reaching its historical peak in 2010 at the level of 74.5% [15] ( tab. 3 ).
Thus, besides poverty reduction and resources congestion, which was proclaimed as the main goal of the national population planning policy, the birth control policy has resulted in an influx into the economy of a large number of spare workforce, unoccupied with household or children. Nowadays China’s working-age population comprises 1 billion 4 million people, representing a physical inventory of labor resources. From 1980 to 2015 the proportion of working-age population has risen by 379 million people (i.e. by 61%) which significantly exceeded total growth rate during the same period – 35% [15]. It should be noted that in 1987 natural population growth in China reached its maximum point at the rate of 1.66%, and in 1992 natural growth rate returned to historical levels of 1978, the year before the activation of the one child policy.
The combination of high economic development rates and working-age population growth is a historic opportunity for China, which it has successfully used. The population of China has provided its economy with excessive labor resources and the decreasing social burden on the budget has promoted an increase in the amount of government investments. According to the remark of E. Andreev, by 1990 “China has had a unique situation where there already were plenty of children and few elderly people. The decrease in dependency ratio and the GDP growth went on almost simultaneously” [1]. The comparison of economic and demographic growth ratios are displayed in Table 4.
However, it should be born in mind that a significant increase of human capital during the reform implementation period was achieved by the population decline of future generations: according to the forecasts, by 2020 China will experience
Table 3. Age composition and demographic load on working-age population of China in 1982–2014
|
Year |
Population proportion |
Dependency ratio |
||||
|
aged 0–14 |
aged 15–64 |
aged 65 and over |
Child dependency level, % |
Old dependency ratio, % |
Gross dependency ratio, % |
|
|
1982 |
33.6 |
61.5 |
4.9 |
54.6 |
8.0 |
62.6 |
|
1990 |
27.7 |
66.7 |
5.6 |
41.5 |
8.3 |
49.8 |
|
2000 |
22.9 |
70.1 |
7.0 |
32.6 |
9.9 |
42.5 |
|
2005 |
20.3 |
72.0 |
7.7 |
28.1 |
10.7 |
38.8 |
|
2010 |
16.6 |
74.5 |
8.9 |
22.3 |
11.9 |
34.2 |
|
2014 |
16.5 |
73.9 |
10.1 |
22.5 |
13.7 |
36.2 |
Source: China Statistical Yearbook 2015. Official website of National Bureau of Statistics of China. Available at: ndsj/2015/
Table 4. Dynamics of some economic and demographic ratios of China by 5-year periods in 1991–2014
|
Period |
Annual average growth rates, % |
Dependency ratio, % |
||
|
GDP |
Working-age population size |
Government investments |
||
|
1991–1995 |
12.3 |
1.33 |
10.8 |
48.8 |
|
1996–2000 |
8.6 |
1.85 |
30.5 |
42.6 |
|
2001–2005 |
9.8 |
1.19 |
15.7 |
38.8 |
|
2006–2010 |
11.2 |
1.22 |
27.1 |
34.2 |
|
2011–2014 |
8.0 |
0.11 |
19.8 |
36.2 |
Source: China Statistical Yearbook 2015. Official website of National Bureau of Statistics of China. Available at: tjsj/ndsj/2015/
a lack of 31 million children aged 0–15, and by 2050, about 70 million children of the same age. The proportion of the population of young people in 2020 will only comprise 14%. The proportion of the elderly population, on the contrary, will increase and reach 20% in 2020, and by 2050 it will comprise 38% [2]. Thus the increase in the share of the working-age population will be replaced by its decline, and by 2050, according to authors’ estimations, it will comprise 50–55%, which is significantly less than before the implementation of the one child policy.
The shift in trends is obvious even today: since 2010 dependency ratio has been steadily rising, and since 2013 there has been a decrease in the absolute number of working-age population by 1130– 1500 thousand people (0.1%) per year. The highest percentage (9.1%) in the age distribution structure is occupied by the citizens aged 40–44, and the citizens aged 45–49 comprise 8.8% [15]. This means that in a 15–20 years’ time, when the representatives of this age cohort retire, the Chinese population will experience rapid ageing. By 2020 the working-age population could decline by 89 million people compared to 2014. Many elderly Chinese, being the only child in the family, will have to support themselves and their children but also their parents and grandparents. Against a backdrop of underdeveloped pension system, lack of life savings due to low earnings and low financial awareness a “happy”, and most importantly, secured old age for elderly Chinese people seems an unlikely outcome. It is still necessary for the country to build from scratch a powerful social security system for the growing number of ageing population.
In the long-term, working age depopulation will provide gradual depletion of growth drivers of human resources and formation of labor shortage that will inevitably lead to the increase of its cost. Economic reforms that have built China’s reputation as a “world factory” were based on the use of excessive and, for this reason, cheap and competitive workforce.
A resource that is being changed from abundant to scarce can not be cheap by default. Given the increasing quality of the workforce which implies the increase of expense on education and training, as well as the increase of the social burden which will require extra expense on elderly population support, it should be noted that Chinese workforce may become one of the most expensive in the world by the middle of the 21st century. According to the scientists, “demography is no longer a positive factor in China’s development” [8, p. 20].
Naturally, the increase of social burden, he depletion of workforce and the rise of its cost conflict with China’s economic interests and have already promoted the abolition of the one child policy in December 2015. Specialists tend to give a negative answer to the expected question whether or not this will result in a rapid births rise. The main reasons for this are the changing social attitudes of the Chinese society and the focus on self-actualization and the improvement of the quality of life. These factors have become as important in birth control as state family planning policy. The media give the results of the surveys of the Chinese population: “In 2014, less than 1 million married couples applied for having the second child, which is half less than that expected. Urban families still prefer to confine to upbringing of only one child for financial reasons. Only 60–65% would like to have the second child and in rural families this proportion comprises 90%” [2].
Another important indicator characterizing the tendencies of China’s human resources formation is the degree of urbanization. As a natural result of economic development and the optimization of the distribution of productive forces, urbanization largely determines the peculiarities of spatial distribution of labor resources. Urbanization is a process of concentrating the working-age population in the cities of industrial and cultural advance, resulting in the increase of population density, the intensification of socio-economic life and the rise of the capacity of human capital development.
The tendencies for urbanization and the expansion of cities in the context of human capacity development and for the improvement of the quality of life are fixed in many policy decisions and China’s party documents. In that way, within the context of the 16th National Congress of the Communist Party of China in 2002, Jiang Zemin, considering urbanization as an inevitable industrialization and modernization trend, stated as one of the objectives of building a moderately prosperous society the need for “a significant raise of the proportion of urban population and gradual elimination of the tendency for the increasing differences between industry and agriculture, between the city and the country” [4]. Xi Jinping, the actual China’s leader, directly marks the advancement of the urbanization process as the right way of modernizing companies and improving performance. At the same time he highlights the priority of the human factor, namely the guarantee of equal access to basic public services, to the most favorable living environment, as well as the increase of people’s content and happiness [14].
The process of urbanization in China which started in the 1950s was one of the most powerful in the world during the whole period of reforms, which intensified internal migration and stimulated the relocation of the rural population to the cities. In 1953 the number of urban population amounted to 77.3 million (13.2% of the total population) (which conforms to the level of underdeveloped African countries), nowadays 750 million people live in Chinese cities (54.8% of the total population) (the level of countries of Southeast Asia – the Philippines, Indonesia, etc.) [15]. By 2020, according to the plans of the Chinese leadership, the country should reach the level of moderately developed countries (60%), and by 2050 – the level of 70% [16, p. 166], which is comparable to the level of Russia’s urbanization.
The process of urbanization in China has been developing unevenly, influenced by the government’s political decisions. The most active implementation was practiced in the 1980s that coincided with the adoption of the one child policy. Over the last 35 years the urban population increased by 557.8 million, or in 3.9 times, and 48% of that increase falls on 1980–2000 and 52% – for 2001–2014. ( fig. 2 ).
Figure 2. Dynamics of China’s urban population in 1950–2014
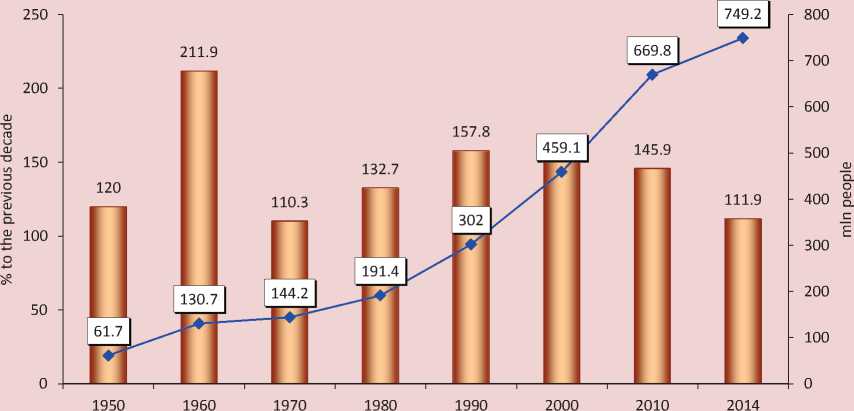
■ _ J Urban growth rate by decades — ♦ — Urban population
Compiled on the basis of the following source: China Statistical Yearbook 2015. Official website of National Bureau of Statistics of China. Available at:
Table 5. Contribution of the natural and migration growth to the growth of urban population of China in 1981–2014
|
Period |
Average annual urban population growth, mln people |
Average annual rates |
Share of internal migrations and administrative transformations in urban population growth,% |
Urbanization ratio, % |
||
|
of increment of total urban population,% |
including natural reproduction, % |
including internal migrations and administrative transformations, % |
||||
|
1981–1990 |
11 055 |
5.8 |
1.5 |
4.3 |
74.3 |
26.41 |
|
1991–2000 |
15 711 |
5.2 |
1.0 |
4.2 |
80.2 |
36.22 |
|
2001–2010 |
21 072 |
4.6 |
0.6 |
4.0 |
87.7 |
49.95 |
|
2011–2014 |
19 845 |
3.0 |
0.5 |
2.5 |
83.2 |
54.77 |
Calculated on the basis of the following source: China Statistical Yearbook 2015.Official website of National Bureau of Statistics of China.
Available at:
The period 1980–2000 was to a great extent characterized by the increase in the number of cities, and the period 2001–2015 – by urban sprawling and by active formation of agglomerations.
In order to judge the size of urbanization it is enough to imagine that for the past 40 years in China 1–2 cities like Moscow, or 3–4 cities such as present-day Saint Petersburg have been established. During just this period Chinese cities promoted rapid population growth, which was nearly four times bigger than the population of Russia.
The main sources of urbanization in China are the natural growth of the urban population, the internal migration from rural areas to cities, the emergence of new cities and the administrative expansion of urban areas, when in 1984 a city was considered as an economic center with a population of more than three thousand people (instead of 100 thousand) and with 85% of the residents off the agricultural employment. According to the calculations based on statistical data, during the period of intensive urbanization in 1980–2014 urban population growth was provided by at average 19% by natural growth and by 81% – by internal migration and administrative transformations (tab. 5).
According to the table, as natural growth capacity decreased, the transfer of excessive rural workforce to non-agricultural production sectors and cities was beginning to play a more and more important role in providing industrial centers with human resources. Thus the birth control policy has adjusted the age structure in favor of the working-age population and the urbanization has altered the spatial distribution of the labor army in favor of fast developing industries of the cities.
The main tendency of modern national migration is the shifting of workforce from labor-abundant to labor-scarce regions, i.e. from the inner (Western) to the coastal (Eastern) provinces. Eleven coastal
Table 6. Some socio-economic indicators of the biggest cities in China ranked by population size, 2014
The economic effect of the human capital shift within the context may be estimated means of statistical data: Table 6 displays some indicators which characterize the ultimate efficiency of workforce use and reflect the socio-economic capacity of China’s largest cities ranked by population size (only cities with the population of more than 10 mln people as well as three cities which are close to hitting this number were taken into calculations). As the table shows, nine of the largest metropolitan areas out of 292 cities in China compose 1/5 of the national production and 1/3 of the country’s export capacity. Among them are the above mentioned four major Eastern metropolitan areas such as Beijing, Tianjin, Shanghai and Guangzhou which, occupying 0.45% of the total area, and accommodating
3.4% of labor resources, produce 12.2% of the country’s GDP and form its foreign economic capacity, comprising 27.3% of the country’s total proportion. According to the Forbes list of “The World’s Biggest Public Companies” in 2011, twenty-six Chinese companies were included in the list of 500 largest companies in the world, and all of these companies were founded in these provinces [18, p. 18].
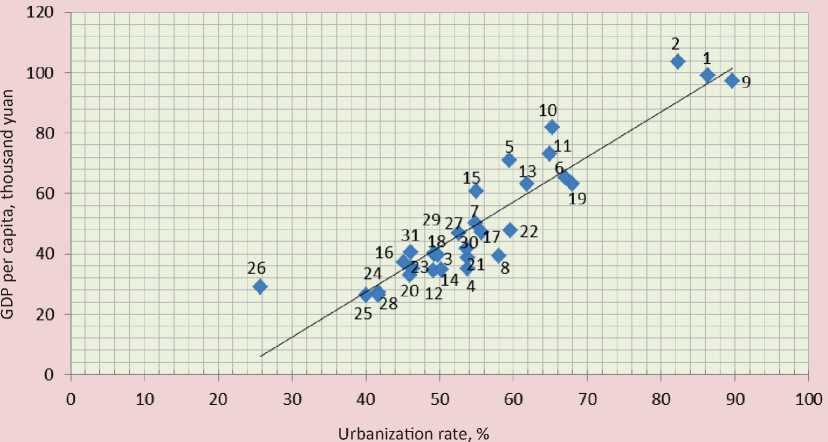
Figure 3 , compiled on the basis of the data from China’s provinces in 2014, shows a direct and close relation (with determination coefficient of 0.84) between the proportion of urban population and the GDP per capita: the higher the urbanization rate, the more efficiently the human capital is used in the territory. It is noteworthy that indicators in Western and Central provinces such as Tibet, Yunnan, Gansu, and Guizhou are concentrated in the lower left corner of the chart, which indicates relatively low capacity of human capital accumulation and a high probability of “workforce drain” and “brain drain” in favor of the provinces located above and/ or to the right in the chart.
Thus, urbanization as a process of concentration of human resources in the cities is an important factor in the increase of productivity and labor efficiency of the Chinese economy as a whole. Despite the active development of small and medium sized cities, human resources of China will still be unevenly distributed over its territory in the near future, graviating toward centers of export-led production in the Eastern
Figure 3. Correlation between the urbanization level and the level of GDP per capita in China, 2014
|
No. |
Provinces |
8 |
Heilongjiang |
16 |
Henan |
24 |
Guizhou |
|
1 |
Beijing |
9 |
Shanghai |
17 |
Hubei |
25 |
Yunnan |
|
2 |
Tianjin |
10 |
Jiangsu |
18 |
Hunan |
26 |
Tibet |
|
3 |
Hebei |
11 |
Zhejiang |
19 |
Guangdong |
27 |
Shaanxi |
|
4 |
Shanxi |
12 |
Anhui |
20 |
Guangxi |
28 |
Gansu |
|
5 |
Inner Mongolia |
13 |
Fujian |
21 |
Hainan |
29 |
Qinghai |
|
6 |
Liaoning |
14 |
Jiangxi |
22 |
Chongqing |
30 |
Ningxia |
|
7 |
Jilin |
15 |
Shandong |
23 |
Sichuan |
31 |
Xinjiang |
Compiled on the basis of the following source: China Statistical Yearbook 2015. Official website of National Bureau of Statistics of China. Available at:
regions. In the medium term, with the stabilization of the population size and the improvement of the quality of life, there is a likelihood of people’s relocation to the central regions and their concentration in the cities with a population moderate for China (1–8 million people).
The study showed that China’s current amount of human resources, formed in the past (1980–2015), is sufficient and their structure is rather favorable. However, current trends reflect the emergence and aggravation of problems that may have a negative impact on human capital formation and further economic development of China (tab. 7).
It should be noted that the trends of demographic and urban development of the end of the 20th century and the beginning of the 21st century were fully exploited by China in order to obtain impressive results in economic development. In the future, in
Table 7. Modern trends of human resources formation in China
|
Indicator |
Indicator value |
Current trends |
|
Population, million people |
1376 |
• Population growth up to 2030. |
|
Natural growth rate, % |
0.48 |
• Negative natural growth rates (since the 1970s) |
|
Working-age population, million people |
1004 |
|
|
Share of working-age population (2014), % |
73.9 |
• Declining share of working-age population in 2010 due to the growth of the share of elderly population |
|
Dependency rate (2014), % |
36.2 |
• Increase in dependency rate since 2010 due to an increasing rate of elderly dependency |
|
Urbanization rate (2014), % |
54.8 |
|
|
Economic and geographic structure of the working-age population |
42% of the population is concentrated in 11 coastal provinces; 9% of the population live in 9 biggest cities |
|
order to hold a leadership position in global economy and ensure further sustainable economic development, China will have to take some meaningful measures referred to the conservation and development of human capital, which will require fundamentally new approaches to human resource management.
References Modern trends in the formation of human resources as a factor in sustainable development of China's economy
- Andreev E. Udvoenie Kitaya: chem obernetsya otmena pravila “Odna sem'ya -odin rebenok” . Informatsionnyi portal RBK Rossii . Available at: http://www.rbc.ru/opinions/society/11/11/2015/. .
- Vlasti Kitaya otmenyayut politiku “Odna sem'ya -odin rebenok” . Ofitsial'nyi sait Informatsionnogo agentstva Rossii . Available at: http://tass.ru/mezhdunarodnaya-panorama/2388807. .
- Gao Feng. Sovershenstvovanie sistemy upravleniya chelovecheskimi resursami Kitaiskoi Narodnoi Respubliki kak faktora dostizheniya ustoichivogo razvitiya: dis… kand. ekon. nauk . Moscow: RUDN, 2016. .
- Doklad Tszyan Tszeminya na 16-m Vsekitaiskom s”ezde KPK (vtoraya chast') . Gazeta “Zhen'min' Zhibao” on-line na russkom yazyke . Available at: http://russian.people.com.cn//zhuanti/partycongress/bao2.html. .
- Egorshin A.P. Osnovy upravleniya personalom: uchebnoe posobie . 4th edition, revised and supplemented. Moscow: NITs INFRA-M, 2015. 352 p. .
- Din Ru Run, Kovalev M.M., Novik V.V. Fenomen ekonomicheskogo razvitiya Kitaya: nauchnoe izdanie . Minsk: Izdatel'skii tsentr BGU, 2008. 446 p. .
- Izotov D.A., Motrich E.L. Demograficheskie vyzovy dlya ekonomiki KNR . Rossiya i ATR , 2014, vol. 85, no. 3, pp. 61-83. .
- Kireev A.A. Demograficheskoe izmerenie kitaiskikh reform . Rossiya i Kitai: problemy strategicheskogo vzaimodeistviya: sbornik Vostochnogo tsentra , 2016, no. 17, pp. 18-21. .
- Korchagin Yu.A. Chelovecheskii kapital kak faktor razvitiya: doklad v VShE . Materialy nauchnogo seminara “Chelovecheskii kapital kak mezhdistsiplinarnaya oblast' issledovaniya” . Available at: http://www.lerc.ru/?part=articles&art=3&page=35. .
- Larionov A.V., Chirkova E.N., Larionov A.V. Demograficheskii vyzov sovremennomu razvitiyu Kitaya: problemy i perspektivy . Vestnik Instituta ekonomiki RAN , 2015, no. 5, pp. 182-196. .
- Mirovaya demograficheskaya situatsiya, 2014 god: Doklad OON . Ofitsial'nyi sait Organizatsii Ob”edinennykh Natsii . Available at: http://www.un.org/en/development/desa/population/publications/.pdf.
- Ofitsial'nyi sait Vsemirnogo banka . Available at: http://data.worldbank.org/country/china.
- Xin You. Problemy narodonaseleniya v Kitae: do i posle . Obzor tekushchikh sobytii , 2012, no. 5, pp. 53-54.
- Si Tszin'pin prizval sodeistvovat' protsessu urbanizatsii s kitaiskoi spetsifikoi . Internet-televidenie Kitaya (CNTV) . Available at: http://www.cntv.ru/2016/02/24/ARTI1IdNLajeR3YP4G5mLj81160224.shtml.
- Statisticheskii ezhegodnik Kitaya 2015 g. . Ofitsial'nyi sait Natsional'nogo statisticheskogo byuro Kitaya . Available at: http://www.stats.gov.cn/tjsj/ndsj/2015/indexeh.htm.
- Wu Fenggang. Issledovanie ustoichivogo razvitiya protsessa urbanizatsii v Kitae . Ekonomicheskie i sotsial'nye peremeny: fakty, tendentsii, prognoz , 2015, no. 4, pp. 165-170. .
- Hu Angang, Mien Huongua. Pod”em sovremennogo Kitaya. Vseob”emlyushchaya natsional'naya moshch' i velikaya strategiya . Al'manakh “Vostok” o situatsii v Rossii , 2007, vol. 43, no. 2, September. Available at: http://www.situation.ru/app/j_art_1195.htm. .
- Chi Xu, Zhilina L.N. Politika i strategii KNR v otnoshenii vyvoza kapitala . Territoriya novykh vozmozhnostei: vestnik Vladivostokskogo gosudarstvennogo universiteta ekonomiki i servisa , 2012, no. 1, pp. 14-21. .
- Zhuochao You. Demograficheskie faktory sotsial'no-ekonomicheskogo razvitiya Kitaya . Ekonomicheskaya teoriya , 2014, vol.11, no. 1, pp. 85-91. .
