Monitoring coastal dynamics using LANDSAT multi-temporal images

Author: Hung Trinh Le, Tuyen Vu Danh
Journal: Вестник аграрной науки @vestnikogau
Article in issue: 1 (46), 2014.
Free access
Coastal dynamic is one of the most urgent and complex problem in monitoring environmental resources. Traditional methods based on field surveys only solve the problem on a small scale. Some methods of determining coastal dynamic using band color composite have the advantage to perform. However, this technique also has the drawback that is time consuming and needs a lot of editing. In this article, we analyze an automated method of coastline change detection using LANDSAT multi-temporal images. The results which are obtained in this study can be used to create the coastal dynamic map.
Band ratio, coastal dynamic, classification, landsat, multi-temporal images
Short address: https://sciup.org/147124149
IDR: 147124149 | UDC: 528.854.2
Text of the scientific article Monitoring coastal dynamics using LANDSAT multi-temporal images
The understanding of coastal dynamics in the wet tropics has broad scientific interests as well as social and economic importance [3]. The coastal zone of Vietnam is 3260 km long, extending through the territories of 24 provinces and cities, which include 127 urban and rural districts, 21 towns and 6 cities [4]. Here occur a series of interactive processes between the land and the sea, between the dynamic forces of rivers and the sea, between the natural and human processes, etc. Along the cost of Vietnam in average in every 20 km there is a river mouth. The landforms of the coastal zone of Vietnam are multiform and diverse. In many areas the landforms are strongly dissected, giving the coast many beauty spots. The coastal zone of Vietnam also receives many natural calamities, causing multidirectional impacts on the nature and socio-economic conditions. In particular the coastal erosion is causing many difficulties for the life of the coastal population [4]. Since 1995, coastal erosion in the Southern plain has been occurring in a rather complicate manner, in many areas, causing serious consequences. The intensity and extent of the erosion occurring in each province are also different. Areas with strongest erosion are Can Gio of Ho Chi Minh city, Dong Hai of Tra Vinh province; Ngoc Hien, Dam Doi and Tran Van Thoi of provinces Ca Mau province (table 1).
The use of LANDSAT satellite data with facility of spectral, synoptic and near real time data availability has helped in monitoring shoreline changes and monitoring coastal geomorphology (Addo et al., 2008). Coastline mapping is commonly achieved through the application of different techniques and remote sensing data varies from fine to moderate spatial resolution. Mc-Feeters (1996) used a Normalized Difference Water Index (NDWI) for detection of water bodies. Coastline can also be mapped through image classification including density slice analysis (Ryan et al., 1991; Gorman et al., 1998; Braud and Feng, 1998; Moore, 2000). Multi-temporal remotely sensed images with a medium spatial resolution are ideal data sources for mapping coastal land uses and monitoring their changes for a wide area (Shi et al., 2001). Bosworth et al. (2003) used a segmentation technique for multispectral LANDSAT TM imagery achieved using multi-resolution combined with watershed pyramids with region growing approach [2].
Table 1 - Records of coastal and river mouth erosion of Southern provinces [5]
|
No. |
Communes |
Districts |
Provinces |
Width (m) |
Area (m2) |
|
1 |
Long Hoa |
Can Gio |
Ho Chi Minh city |
400 |
748000 |
|
2 |
Ly Nhon |
Can Gio |
Ho Chi Minh city |
400 |
1072000 |
|
3 |
Ly Nhon |
Can Gio |
Ho Chi Minh city |
400 |
1151000 |
|
4 |
Thach An |
Can Gio |
Ho Chi Minh city |
1000 |
6786000 |
|
5 |
Tan Thanh |
Go Cong Dong |
Tien Giang |
750 |
750000 |
|
6 |
Tan Dien |
Go Cong Dong |
Tien Giang |
1700 |
3400000 |
|
7 |
Vom Lang |
Go Cong Dong |
Ben Tre |
175 |
175000 |
|
8 |
Thanh Phuoc |
Binh Dai |
Ben Tre |
200 |
743000 |
|
9 |
Thanh Phuoc |
Binh Dai |
Ben Tre |
200 |
363000 |
|
10 |
Thua Duc |
Binh Dai |
Ben Tre |
800 |
3865000 |
|
11 |
Bao Thach |
Ba Tri |
Ben Tre |
500 |
1718000 |
|
12 |
Thanh Hai |
Thanh Phu |
Ben Tre |
1000 |
11780000 |
|
13 |
Dai An |
Tra Cu |
Tra Vinh |
180 |
551900 |
|
14 |
My Long |
Cau Ngang |
Tra Vinh |
200 |
614800 |
|
15 |
My Long |
Cau Ngang |
Tra Vinh |
300 |
495100 |
|
16 |
Long Hoa |
Duyen Hai |
Tra Vinh |
600 |
4230000 |
|
17 |
Long Vinh |
Duyen Hai |
Tra Vinh |
400 |
2436500 |
|
18 |
Dong Hai |
Duyen Hai |
Tra Vinh |
500 |
1665000 |
|
10 |
Hiep Thanh |
Duyen Hai |
Tra Vinh |
400 |
1357000 |
|
20 |
Trung Binh |
Long Phu |
Soc Trang |
400 |
2263000 |
|
21 |
Trung Binh |
Long Phu |
Soc Trang |
500 |
2026000 |
|
22 |
Vinh Hai |
Vinh Chau |
Soc Trang |
400 |
3173000 |
|
23 |
Ganh Hao |
Gia Rai |
Bac Lieu |
300 |
1844000 |
|
24 |
Tan Thuan |
Dam Doi |
Ca Mau |
1100 |
540000 |
|
25 |
Tan Tien |
Dam Doi |
Ca Mau |
700 |
612000 |
|
26 |
Nguyen Huan |
Dam Doi |
Ca Mau |
900 |
865000 |
|
27 |
Tam Giang |
Ngoc Hien |
Ca Mau |
1400 |
14980000 |
|
28 |
Tam Giang |
Ngoc Hien |
Ca Mau |
1000 |
16610000 |
|
29 |
Tan An |
Ngoc Hien |
Ca Mau |
1100 |
15930000 |
|
30 |
Thuan An |
Ha Tien |
Kien Giang |
200 |
400000 |
|
31 |
Binh An |
Ha Tien |
Kien Giang |
30 |
60000 |
|
Total |
124105700 |
||||
This article presents some methods based on the remote sensing data to detect coastline change using LANDSAT multispectral image: color composite, band ratio and study of application and development of Alesheikh A. technique.
MATERIAL AND METHODS
Materials. To study coastline change we used LANDSAT ETM+ multi-temporal images on 16 January 2001 and 14 January 2009 (fig. 4). The Enhanced Thematic Mapper (ETM+ ) on board LANDSAT-7 is a multi-spectral radiometric sensor that records eight bands of data with varying spectral and spatial resolutions (30m spatial resolution for red, green, blue, near infrared, and two bands of medium infrared; 60m for thermal infrared; and a 15m panchromatic band). With average spatial resolution, thermal infrared image LANDSAT ETM+ performance applications in the region study (table 2).
Table 2 - Characteristic of LANDSAT ETM+ multispectral image
|
No. |
Bands |
Wavelength (µm) |
Spatial resolution (m) |
|
1 |
Blue |
0.459 – 0.515 |
30 |
|
2 |
Green |
0.525 – 0.605 |
30 |
|
3 |
Red |
0.630 – 0.690 |
30 |
|
4 |
Near infrared (NIR) |
0.775 – 0.900 |
30 |
|
5 |
Mid-infrared (MIR) |
1.550 – 1.750 |
30 |
|
6 |
Thermal infrared (TIR) |
10.40 – 12.50 |
60 |
|
7 |
Mid-infrared (MIR) |
2.090 – 2.350 |
30 |
|
8 |
Panchromatic |
0.520 – 0.900 |
15 |
Color composite technique. Color composite is very early method for extracting coastline from LANDSAT multispectral image. The best color composite for this technique is RGB 543. This color composite nicely depicts water – land interface (fig. 2). Furthermore, it is very similar to the true color composite of earth’s surface. Moreover, it includes the bands that have low correlation coefficient and therefore, it contains higher information in comparison to other color composite [1]. However, color composite technique has the drawback that is time consuming and needs a lot of editing.
Automated technique for extracting coastline change. Coastline can be extracted from a single band of LANDSAT multispectral image, since the reflectance of water is nearly equal to zero in reflective infrared bands, and reflectance of land cover is greater than water. This can be achieved by histogram thresholding on one of the infrared bands of LANDSAT EMT+ imagery (band 4, 5 and 7). Experience has shown that of the seven reflective ETM+ bands, mid-infrared band 5 is the best for extracting the water – land interface [1].
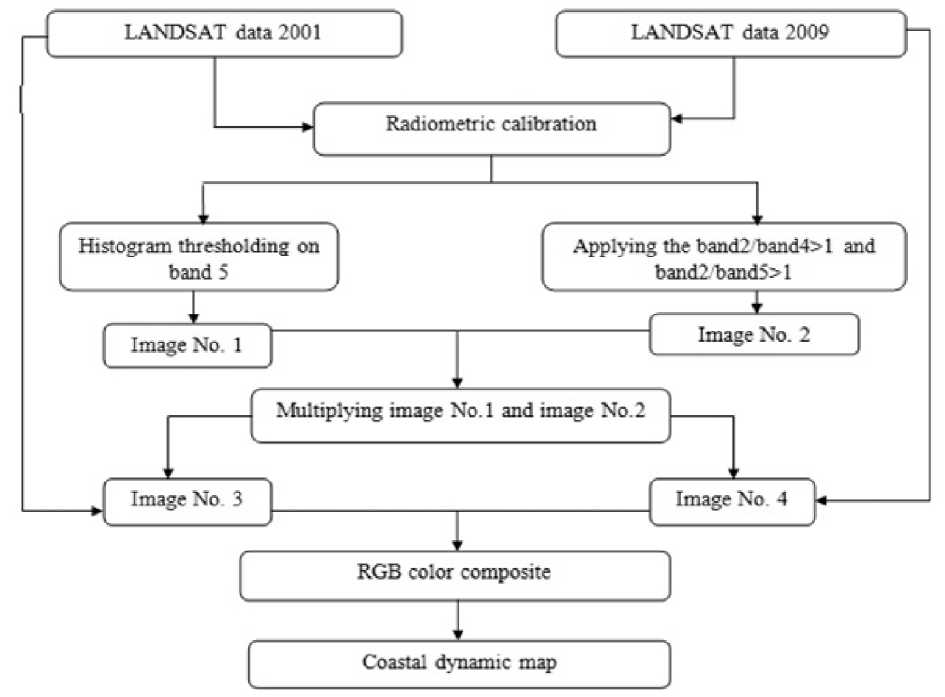
Figure 1 - Alesheikh’s technique of extracting coastlines from LANDSAT multi-temporal images
Mid-infrared band exhibits a strong contrast between land and water features due to the high degree of absorption of mid-infrared energy by water (even turbid water) and strong reflectance of mid-infrared by vegetation and natural features in this range. Of the three ETM+ infrared bands, band 5 consistently comprises the best spectral balance of land to water. The dynamic and complex land-water interaction in coastal Ca Mau province makes the discrimination of land-water features less certain, especially in marsh environments. The histogram of ETM+ mid-infrared band ordinarily displays a sharp double peaked curve, due to tiny reflectance of water and high reflectance of vegetation [1]. The transition zone between land and water resides between the peaks. The transition zone is the effect of mixed pixels and moisture regimes between land and water. If the reflectance values are sliced to two discrete zones, they can be depicted water (low values) and land (higher values) [1].
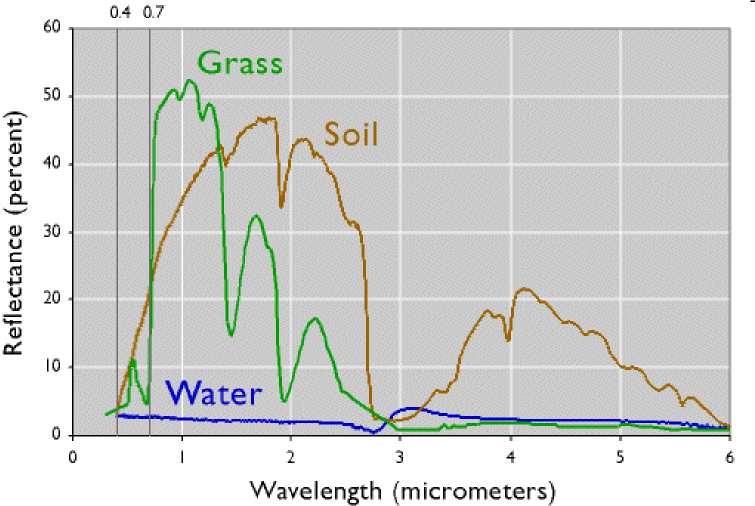
Figure 2 - Spectral characteristic of water, grass and soil
Another technique for extracting land – water interface using band ratio based spectral characteristic of water and land cover (fig. 2). We used band ratio between band 4 and band 2, also band 5 and band 2 of LANDSAT ETM+ image (fig. 1). The ratio band2/band5 is greater than 1 for water and less than 1 for land in large areas of coastal zone. This law is exact in coastal zones covered by soil, but not in land with vegetation cover. Actually, this law mistakenly assigned some of the vegetative lands to water. To solve this problem, the two band ratios (band2/band4 and band2/band5) are combined in this investigation. Applying this method, the coastline can be extracted with higher accuracy.
RESULTS AND DISCUSSIONS
Study area. Ca Mau is province of Vietnam. It is located in the Mekong delta of Southern Vietnam and is the southernmost of Vietnam 64 provinces. It is bordered on the north by the Kien Giang and Bac Lieu provinces, on the west by the Gulf of Thailand, and on the south and east by the East sea (fig. 3).
The changing of shoreline is very complex in this area and the shoreline was tended toward erosion more than accretion in this area in general. In period 1995 to 2010, erosion process occurred highest in Tan Thuan, Tan Tien ward, Dam Doi district while accretion process occurred highest from Cai Huong canal, Ngoc Hien district to Bay Hap estuary, Nam Can district. In the Western of Ca Mau, accretion process is over predominated while erosion is over predominated in the East sea of Ca Mau and Bac Lieu [9].
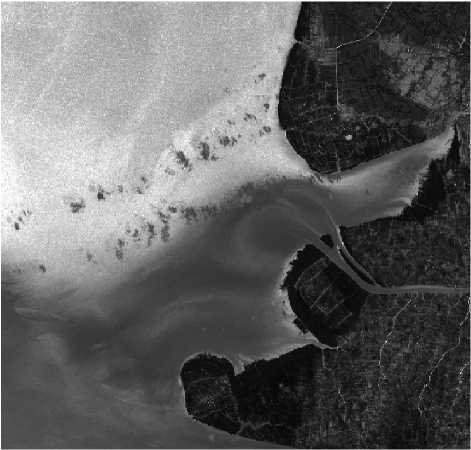
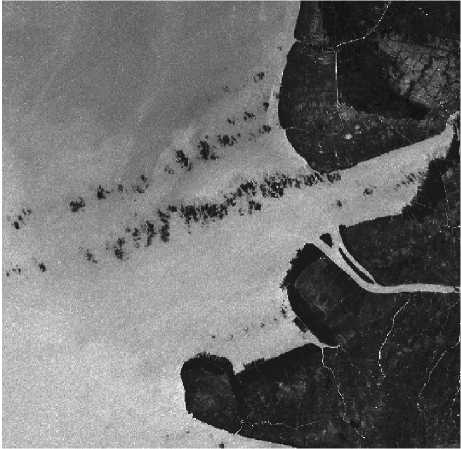
Coastline change detection. The results of ratios band2/band4, band2/band5 and applying the binary images band2/band4>1 and band2/band5>1 for image 16 – 01 - 2001 and 14 – 01 – 2009 was showed in figures 5 – 6. This image is named «Image No.2».
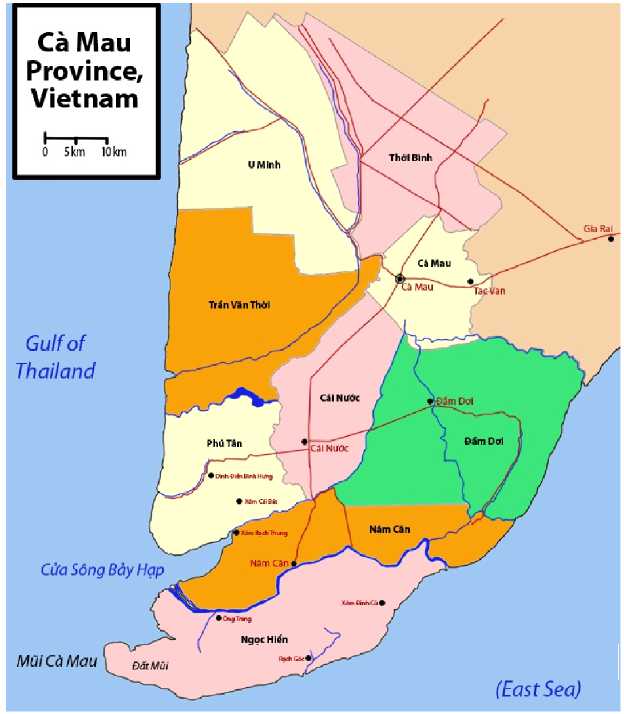
Figure 3 - Location of Ca Mau province
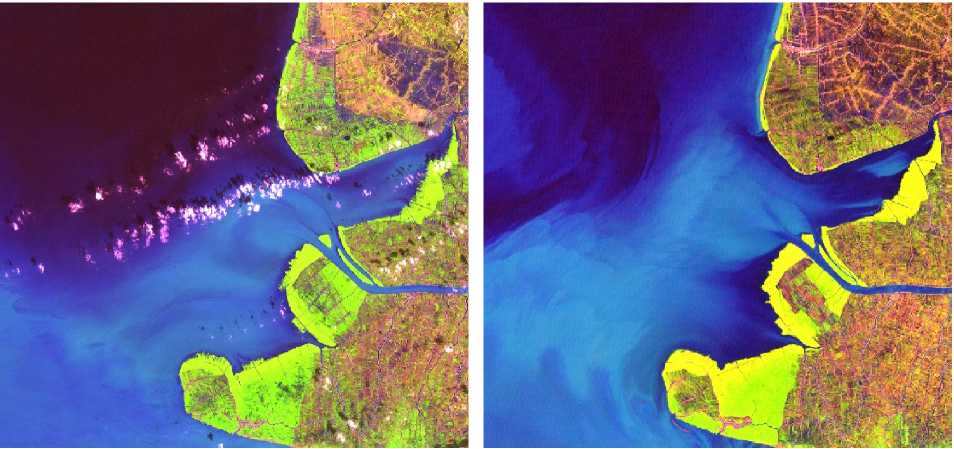
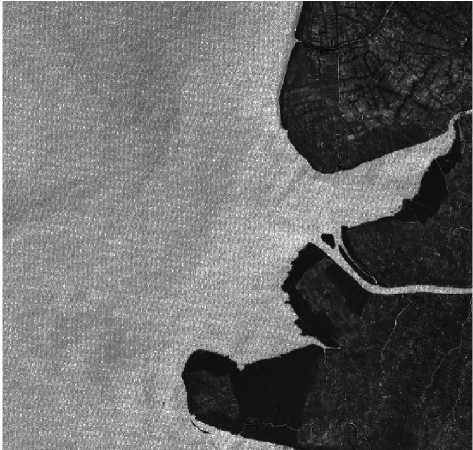
16 – 01 – 2001 14 – 01 – 2009
Figure 4 - The LANDSAT multispectral images with color composite RGB=543
band2/band4
band2/band5
Applying the band2/band4 >1 and band2/band5 > 1
Figure 5 - The ratio images: band2/band4, band2/band5 and applying the band2/band4>1 and band2/band5>1
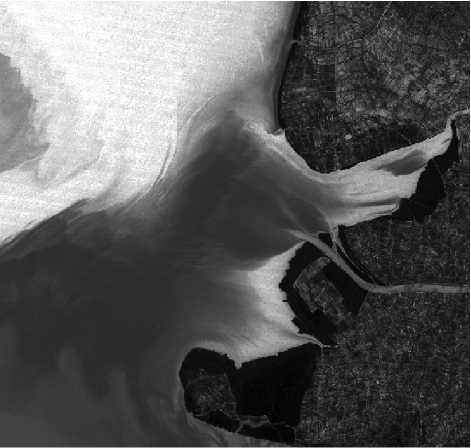
band2/band4
band2/band5
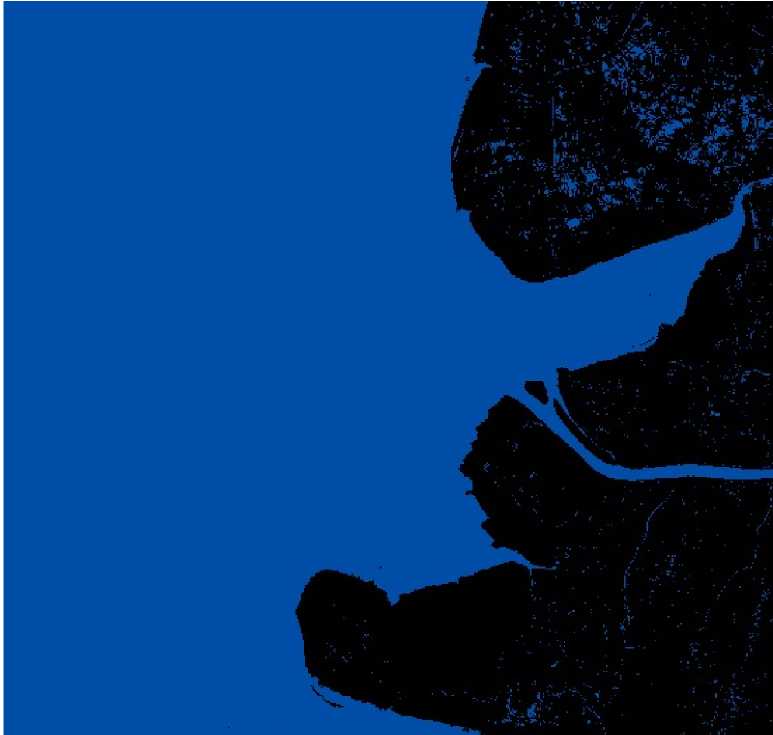
Applying the band2/band4 >1 and band2/band5 > 1
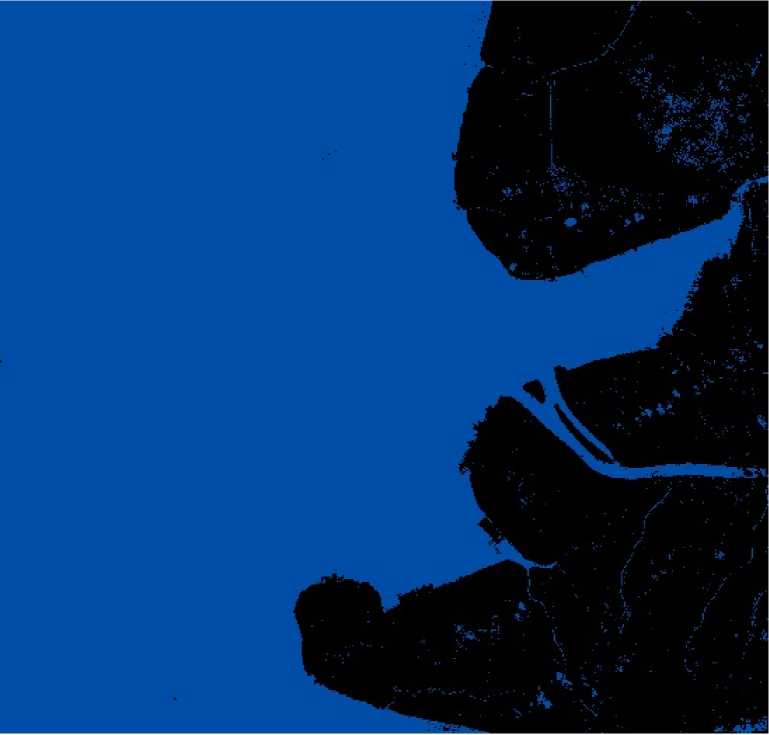
Figure 6 - The ratio images: band2/band4, band2/band5 and result of applying the band2/band4>1 and band2/band5>1
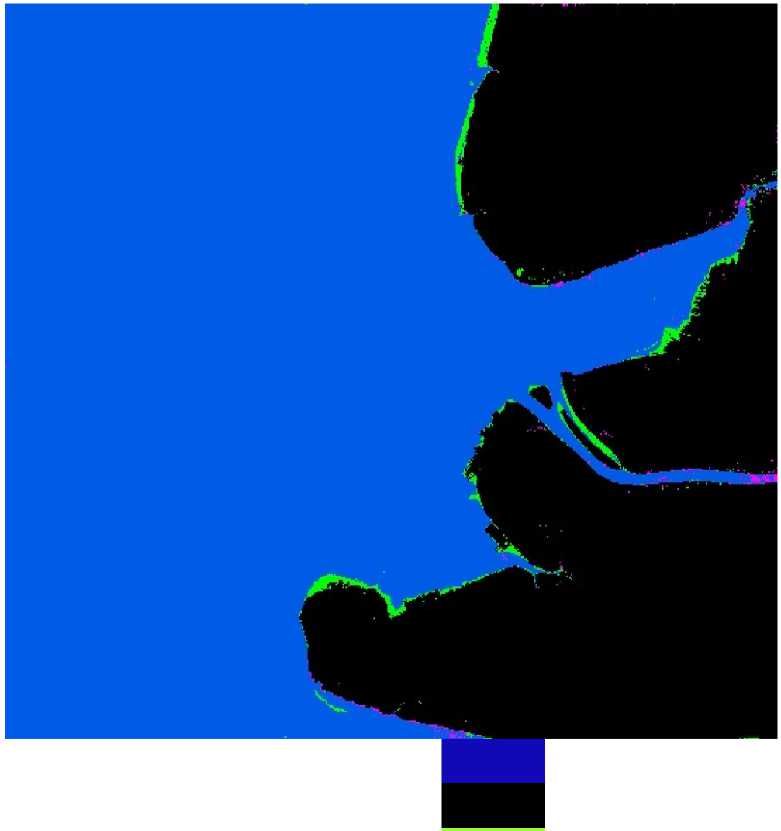
Water
Land cover
Coastline 2009
Coastline 2001
Figure 7 - The result of coastal dynamic map in period 2001-2009
Histogram thresholding method in used on band 5 of LANDSAT ETM+ image for separating land from water. The threshold values have been chosen such that all water pixels are classified as water, and most of land pixels have been classified as land. This image is name «Image No.1». The two images area multiplied. The final obtained binary image represents the coastline accurately. The result of coastline change detection for Ca Mau province showed in figure 7.
Analyze the results of detection coastline change in Ca Mau province showed that in period 2001 – 2009, accretion process is over predominated. The most powerful accretion higher than 500m (mui Ca Mau). Other areas such as the Cai Moi, mui Ong Trang, accretion process also has strongly, averaging about 100 m in the period. Erosion is over predominated in the East sea of Ca Mau province (Day village, erosion area is about 400m). This information is to support the local government in assessing, monitoring and making plan for land use planning in this region.
CONCLUSIONS
Remote sensing techniques provide a useful tool and satellite data gives an objective view when they are applied at large scale. It allows a synoptic viewing to predict changes in large region.
LANDSAT ETM+ Multi-temporal images acquired from 16 – 01 – 2001 and 14 – 01 – 2 2009 have been used. As the results, erosion process occurred highest in the Western, and accretion process occurred highest in the East of Ca Mau. The results which are obtained in this study can be used to create the coastal dynamic map.
References Monitoring coastal dynamics using LANDSAT multi-temporal images
- Alesheikh A.A., Ghorbanali A., Nouri A. (2007), Coastline change detection using remote sensing, Int. J. Environ, Sci. Tech., trang 61-66
- Khalid M. Dewidar, Omran E. Frihy. Automated techniques for quantification of beach change rates using LANDSAT series along the North-eastern Nile delta, Egypt, JPurna; of Oceanography and Marine Science, Vol. 1(2), 2010, 028-039
- Nittrouer, C., Brunskill, G. J., Figueirado, A. G. (1995), Importance of tropical coastal environments, Geo-Marine Letters, 15: 121-126
- Ngo Ngoc Cat, Pham Huy Tien, Do Dinh Sam, Nguyen Ngoc Binh (2005), Status coastal erosion of Vietnam and proposed measures for protection, 22 pp
- Pham Huy Tien, Nguyen Van Cu, et al. (2005), Forecasting the erosion and sedimentation in the coastal and river mouth areas and preventive measures, State level research project, Hanoi, 497 pp
- Winasor G., Budhiman S. (2001), The potential application of remote sensing data for coastal study, Proc. 22nd, Asian Conference on Remote sensing, Singapore, 5 pp
- Marchukov V.S., Trinh Le Hung (2011), The methods of identification of the Vietnamese tropical vegetation dynamics using automated interpretation of the multispectral images, Issledovanie Zemli iz Kosmosa, Vol. 3, 75-85
- Vu Danh Tuyen, Trinh Le Hung (2011), Investigation on the effectiveness of space imagery classifying by building-up homogeneous regions for Vietnam land use maps updating, Izvestia Vuzov “Geodesy and Aerophotography”, Vol. 5, 42-46
- Phan Kieu Diem et al. (2013), Monitoring the shoreline change in coastal area of Ca Mau and Bac Lieu province from 1995 to 2010 by using remote sensing and GIS, Journal of Science, Can Tho University, Vol. 26, 35-43
