Monitoring of the region's social and cultural development as a component to enhance the effectiveness of social administration

Author: Lastochkina Mariya Aleksandrovna
Journal: Economic and Social Changes: Facts, Trends, Forecast @volnc-esc-en
Section: Sociology and social practice
Article in issue: 5 (35) т.7, 2014.
Free access
The article presents the results of the next phase of the study on the subject “Socio-cultural portrait of the region”. It gives the estimation of the demographic situation, standard of living and welfare of the Vologda Oblast residents. Besides, the article shows the people’s assessment of the performance of the authorities, social well-being and degree of safety, as well as their trust in the government. All these aspects are studied in their connection with social policy and social protection measures undertaken in the region. The study reveals that the society is disappointed in the actions of the authorities; it does not understand the true ultimate effect and the feasibility of ongoing regional social events. The greatest number of critical remarks addressed to local authorities comes from people with unstable position in life. Negative evaluations are also more likely expressed by the poorest population groups, by women, by the less educated, by village dwellers and urban-type settlements residents, as well as by individuals with a low level of education...
Social well-being, population, social protection, socio-cultural portrait, region, trust, power
Short address: https://sciup.org/147223661
IDR: 147223661 | UDC: 316.42 | DOI: 10.15838/esc/2014.5.35.7
Text of the scientific article Monitoring of the region's social and cultural development as a component to enhance the effectiveness of social administration
Socio-cultural processes in the Vologda Oblast have been studied since 2008 with the use of the methodology developed by the Center for the Study of Social and Cultural Change (CSSCC) of the Institute of Philosophy under the Russian Academy of Sciences [3]. In accordance with the research program, the problem-analytical and institutionally-oriented approaches are used in the study of the regions that act as socio-territorial communities. The sociocultural portrait of the region compiled by the CSSCC methodology and reflecting the socio-economic benefits, challenges, and development trends represents a concentrated sociological characteristic of the territory. Sociological studies provide an opportunity to create a social biography of the region, which will be useful in the work of managers, politicians, scientists, teachers, students and others who are interested in social development.
The first step in the preparation of the socio-cultural portrait of the region consists in the analysis of its main characteristics (characteristics of the population, socioeconomic resources of the territory, etc.). Depopulation is the main demographic problem in the oblast. The population was about 1194.8 thousand people in 2013, which is 7% less than in 2000, and 12% less than in 1990. At that, the most rapid population decline was observed in rural areas due to mortality and migration. The proportion of the rural population in the Vologda Oblast over the last 23 years has decreased from 34.1 to 28.6%. There is an ongoing process of consolidation of cities, accompanied by their spatial extension, dispersal of production and population at the close surrounding areas. Large cities such as Vologda and Cherepovets, become economic, social and cultural centers. In addition to quite a few positive aspects of urbanization, there are also negative processes associated with the deterioration of sanitary-hygienic living conditions, health deterioration, straining of public transport, increasing time of intracity travel. The reduction in the rural population leads to the decline in economic development and technical equipment of the village, and decrease in production capacities; it becomes more difficult for the people to find a job, infrastructure housing and social services are deteriorating.
That is, the gap in the standard of living between rural and urban population is increasing; as a result, the village can fail to perform all of its functions: industrial, demographic and socio-cultural.
Since 2005 the total dependency ratio in the Vologda Oblast per 1000 working-age people has been showing a steady growing trend due to the increasing proportion of people whose age exceeds the working age. For instance, if in 1990 the structure of the incapacitated was as follows: 54% – people under the working age and 46% – over the working age; then, 10 years later, the trend has changed to the opposite – 47.4 and 52.6%, respectively; and after another 11 years it has become 41.8 and 58.2%. In connection with population ageing there is a higher risk of increasing dependency on the working population, pensions-related problems aggravate, the burden on the health system and social protection increases. The reduction in the number of children and young people in the future will lead to growing disparities in the formation of human resources that are able to recreate the region’s material potential, economic and sociocultural well-being, and to reduction in the number of qualified personnel.
One of indicators of the level of life is the subsistence level (SL), which determines the level of consumption of goods and services minimally required for human life. The value of SL in the Vologda Oblast in all sociodemographic groups is growing annually (tab. 1) . The ratio of SL to per capita money income and accrued wages was able to reach the pre-crisis level only 4 years later, in 2012. Annual indexing of pensions also gave a positive result, and in 2010 they exceeded pensioners’ SL by more than 1.5 times. And in 2009 for the first time in more than a decade pensions exceeded the general SL set out for the Vologda Oblast population. The number of people with incomes below the subsistence level is higher in the region than nationwide (fig. 1) , although before 2008 the positive declining trend in this category could be observed. In the crisis period the proportion of the poor population increased again, falling only in 2012 [8].
Let us consider the share of expenditures on food as a criterion of families’ welfare: the lower this share, the higher the level of welfare. The research findings show that welfare in the Vologda Oblast households in 1995–2008 had a positive trend. In 2000–2009 there was an increase in the share of expenditures on the purchase of non-food goods and services in the structure of consumer expenditures of households. In 2009, due to the global financial crisis, the oblast residents considerably reduced their expenditures on the purchase of nonfood products, increasing the expenditures on food. The observed trend of increased expenditures on services was accompanied by the increase in the share of expenditures on housing and communal services: from 5% in 1997 to 10.1% in 2005 and to 13.2% in 2012 (in the EU in 2005 these costs were as follows: 4.2% in Finland, 6.1% in the UK, 7.1% in Belgium, 10.5% in Lithuania, 12.8% in Estonia) [9]. Moreover, we note that the reason for the increase in the share of these costs was a significant increase in prices for housing, which is associated with corresponding improvement in the quality of the services themselves only to a small degree.
Table 1. Structure of consumer expenditures of households in the Vologda Oblast (according to the sample survey of household budgets, in %)
|
Types of consumer expenditures in households |
Year |
||||||||
|
1995 |
2000 |
2005 |
2006 |
2008 |
2009 |
2010 |
2011 |
2012 |
|
|
Purchase of foodstuffs |
51.7 |
49.1 |
40.3 |
38.5 |
37.2 |
41.3 |
38.0 |
35.7 |
37.1 |
|
Purchase of non-food products |
32.2 |
35.9 |
37.3 |
37.7 |
40.4 |
32.6 |
34.1 |
37.8 |
34.0 |
|
Purchase of alcoholic drinks |
3.1 |
3.3 |
2.4 |
2.2 |
1.6 |
2 |
1.9 |
2.1 |
2.0 |
|
Payment for services |
13.0 |
11.7 |
18.9 |
23.1 |
20.8 |
24.1 |
26.0 |
24.4 |
26.7 |
|
Source: Regiony Rossii. Sotsial’no-ekonomicheskie pokazateli. 2009: stat. sb. [Regions of Russia. Socio-Economic Indicators. 2009: Statistical Collection]. Rosstat. Moscow, 2013. P. 184. |
|||||||||
Figure 1. Number of people with incomes below the subsistence level in the Russian Federation and the Vologda Oblast, %
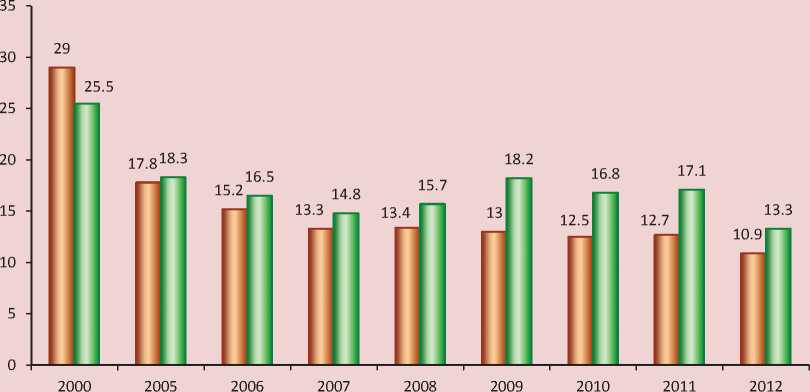
□ Russian Federation □ Vologda Oblast
Source: Regiony Rossii. Sotsial’no-ekonomicheskie pokazateli: stat. sb. [Regions of Russia. Socio-Economic Indicators. Statistical Collection]. Rosstat. Moscow, 2013. P. 184.
The analysis of people’s assessment of their own financial position, based on the methodology of L.A. Belyaeva, allows us to structure the population by this characteristic. According to the research, 16% of the Vologda Oblast population formed the group of “prosperous” and “rich” in 2013, which is almost twice as much as in 2010. Slightly more than one third of the population is “well-off” (38%). Eighteen per cent of the respondents consider themselves “needy”. One in five people said he/she was “poor” or “extremely poor”.
Stabilization of the socio-economic situation in the post-crisis period had a positive effect on the financial condition of households in the oblast, resulting in the significant decreased in the share of the “poor” and “extremely poor” (from 33 to 18%) and “needy” (from 26 to 18%). The comparison of the welfare of the residents in the Vologda Oblast and in its neighboring regions of the Northwestern Federal District shows that the distribution of population by level of welfare is similar (tab. 2). According to the research conducted by CSSCC IP RAS, the situation in Russia in 2006–2010 changed for the better.
ISEDT RAS research results confirm that the income of half of the region’s residents is sufficient only to satisfy their vital needs [1]. Note also that the low income groups (“extremely poor”, “poor”) are dominated by women, the wealthy groups – by men.
Table 2. People’s assessment of their own financial welfare level, in %
|
Answer |
Vologda Oblast |
NWFD |
Russia |
Nominal stratum |
||||||
|
2008 |
2010 |
2012 |
2013 |
2006 |
2010 |
2013 |
2006 |
2010 |
||
|
Money is run out before payday, I have to borrow it |
7 |
10 |
10 |
8 |
3 |
2 |
8 |
11 |
13 |
“Extremely poor” |
|
Entire salary goes to everyday expenses |
22 |
23 |
17 |
13 |
16 |
14 |
14 |
22 |
19 |
“Poor” |
|
I have enough money for daily needs, but buying clothes is difficult |
22 |
26 |
24 |
18 |
23 |
21 |
18 |
21 |
21 |
“Needy” |
|
In general I have enough money, but I have to borrow it to buy expensive items |
35 |
32 |
36 |
38 |
35 |
44 |
36 |
29 |
31 |
“Well-off” |
|
I have enough money for almost any purpose, but I cannot afford to buy an apartment or a dacha |
11 |
8 |
11 |
14 |
15 |
14 |
17 |
9 |
11 |
“Prosperous” |
|
We have enough money to buy almost everything we want |
3 |
1 |
2 |
2 |
1 |
2 |
3 |
2 |
3 |
“Rich” |
|
I don’t know, I refuse to answer |
1 |
0 |
0 |
7 |
7 |
2 |
4 |
6 |
3 |
|
Source: data of the surveys “Socio-cultural portrait of the region”, held by ISEDT RAS in 2008, 2010, 2012 and 2013, and the surveys “Values and interests of Russia’s population”, held by CSSCC IP RAS in 2006 and 2010.
Financial position changes in proportion to the age of the population: the share of the older age group among “the poor and extremely poor” is 3/4 of the total number of representatives in this category; and their share in the “well-off” and the “rich” is only 1/5. The opposite situation can be observed in the group of young people.
Some questions in the questionnaires allow us to compare the people’s attitudes in relation to social policy. The study of public opinion has helped identify the level of trust and the attitude of the citizens to the authorities of various levels. Almost half of the Vologda Oblast residents believe that the improvement of their life depends on the district administrations (45%). A large percentage of those who found it difficult to answer (31%) point out the weak involvement of the population in the life of the city, town, village, and they also note the low public awareness concerning the authorities’ actions to address social problems of the territory. Naturally, in separate municipalities of the oblast the share of assessments varies, but in general we can say that the majority of the population assesses the work of district administrations as satisfactory. The distribution of responses similar to the regional level is observed throughout the Northwestern Federal District (tab. 3); but its comparison to 2008–2010 shows a decrease in the proportion of people (7–10%) who believe that improvement of their life depends on local or municipal authorities.
In the federal district in general more than half of respondents (53%) believe that the improvement of life depends on the authorities; as for the Vologda Oblast residents, they are more optimistic, and almost one in three people doubt his/her assessment, relying also on their own resources and opportunities (78%), and on the help of close relatives (55%).
Table 3. Distribution of answers to the question: “In your opinion, how much does the improvement of your life today depends on...?”, in %
|
Answer |
Vologda Oblast |
NWFD |
|||
|
2008 |
2010 |
2012 |
2013 |
2013 |
|
|
District, city/town authorities |
|||||
|
Depends completely |
11 |
12 |
13 |
17 |
16 |
|
Depends very likely |
41 |
43 |
33 |
28 |
26 |
|
I don’t know, it is difficult to say |
31 |
30 |
33 |
31 |
29 |
|
Doesn’t depend, likely |
10 |
8 |
12 |
9 |
13 |
|
Doesn’t depend completely |
9 |
8 |
9 |
15 |
17 |
|
National authorities |
|||||
|
Depends completely |
14 |
14 |
19 |
24 |
28 |
|
Depends very likely |
35 |
40 |
30 |
23 |
25 |
|
I don’t know, it is difficult to say |
32 |
31 |
33 |
31 |
24 |
|
Doesn’t depend, likely |
10 |
7 |
10 |
9 |
9 |
|
Doesn’t depend completely |
10 |
8 |
9 |
14 |
15 |
|
Source: data of the surveys “Socio-cultural portrait of the region”, held by ISEDT RAS in 2008, 2010, 2012 and 2013. |
|||||
According to the data obtained for the two analyzed years (2010–2012), the people’s assessments of authorities’ performance have deteriorated – there has been more than the twofold increase in the proportion of people who believe that the Legislative Assembly and the President of the Russian Federation work inrfficiently and their performance is unsatisfactory (tab. 4) . In 2012, one in ten Vologda residents believed that the Vologda Oblast Governor, the heads of the district administrations and settlements are working inefficiently (10% of the respondents), and there was a 50% increase in the share of those who considered their work unsatisfactory (20%).
We note that negative estimates are most often made by the poorest segments of the population, by women, by less educated, by village dwellers and urban-type settlements residents. More positive assessments are given by the prosperous and educated part of the society. The study of socio-cultural changes in the society has shown that when assessing the activities of local executive authorities, the cultural attitudes of the population become of great importance. Among those who believe that “respect for the established customs and traditions is not important” more than a third give negative assessments of the performance of the Governor and district authorities. There are more than 35% of positive assessments and fewer negative ones (15%) among those who believe that “the people and the state should care most of all for children”.
The bulk of criticism of the local authorities comes from that part of the residents who are unable to identify their values clearly and who select a certain middle variant of their assessment. A large part of the population expects that the state, in pursuing social policy, will follow the principles of social justice, equality, rule of law, responsibility,
Table 4. Performance of the authorities as assessed by the Vologda Oblast residents, in %
|
Bad |
Unsatisfactory |
Satisfactory |
Good |
Excellent |
||||||
|
2010 |
2012 |
2010 |
2012 |
2010 |
2012 |
2010 |
2012 |
2010 |
2012 |
|
|
RF President |
3 |
8 |
10 |
20 |
46 |
52 |
34 |
17 |
7 |
3 |
|
Legislative Assembly |
4 |
9 |
15 |
22 |
57 |
56 |
23 |
11 |
2 |
1 |
|
Vologda Oblast Governor |
4 |
9 |
13 |
20 |
54 |
54 |
26 |
15 |
3 |
2 |
|
Head of the district administration |
5 |
10 |
16 |
21 |
55 |
53 |
22 |
13 |
2 |
2 |
|
Settlement Head |
6 |
10 |
16 |
20 |
53 |
51 |
23 |
13 |
2 |
2 |
Source: data of the surveys “Socio-cultural portrait of the region”, held by ISEDT RAS in 2008, 2010 and 2012.
and socially significant values. Heads of the government themselves often provoke high expectations, promising in their public speeches the plans that are difficult to realize, thus deepening the gap between the real capacity of the authorities and hopes of the population. In the course of implementing reforms in the social sphere, the population reacts in the form of protest actions against the measures undertaken by the authorities in various spheres of social life. The Vologda Oblast population supports nationwide protest rallies and organizes local ones against the ways and methods by which the government tries to resolve social issues it highlights. During the last seven years the following protests in the region were carried out in defense of the rights of different communities and public organizations:
-
• February 26, 2008 in Vologda there was a rally of liquidators of the Chernobyl nuclear disaster. They protested against the actions of the court and the bodies of social protection that “impede the exercise of their legal rights to compensation for harm”.
-
• April 12, 2008 a rally was held in Cherepovets, where people protested against high utility tariffs and against political repression.
-
• September 10, 2008 the all-Russian protest against rising fuel prices was held in the Vologda Oblast.
-
• in 2008 the students of the University of the Third Age protested against the intention of the Mayor’s office to “evict” them from the building they are housed in. The University was founded in Vologda in 2005 on the basis of a private institution of additional education People’s University “Knowledge” and served for many pensioners as the only way to get vital knowledge, and as a place of communication and support.
-
• in December 2010 the farms in Grib-kovo and Yermakovo suspended their work for one hour because of the delay and nonpayment of wages.
-
• May 24, 2013 there was a rally of healthcare workers in Cherepovets. The basic requirements of physicians concerned their low wages, poor social conditions and also the unjust policy pursued by health care officials.
-
• October 6, 2013 the teachers in Cherepovets organized a rally “For decent work!”.
-
• March 10, 2014, a rally of teachers from musical schools and other educational institutions was held in Vologda. The main reason was the reduction in funding of special schools and low salaries for teachers.
-
• May 24 to June 1, 2014 the action “All Russia – for rural schools!” was held in Russia. This action was held due to the fact that officials wanted to close a rural school in the village Zamoshye in the Vologda Oblast. The people protested against the closure of small schools, especially in rural areas, against the elimination of schools for persons with disabilities, against an “education reform”, essentially meaning the collapse of the educational system.
The recent reduction in the number of rallies in the oblast is connected, in our opinion, with decline in the protest potential of the population (tab. 5) . Opinion polls show that more and more people are not ready to participate in protest actions (their share increased from 38% in 2008 to 48% in 2012).
The best outcome of the implementation of social policy is when the people trust the government and see practical results of its activity [2]. Note that the estimates of the population have neither the former nor the latter. The results of the survey of the Vologda Oblast residents show a dramatic decline in people’s trust in the regional government: for instance, in 2008 the level of trust was quite high – one in two people had trust in Governor V.E Pozgalev; as for 2010, there was a decrease by 10 percentage points, and people’s trust continued to decline after the appointment of O.A. Kuvshynnykov – in 2012 only a third of the oblast population had trust in the Governor (fig. 2).
Over the years people’s trust in all the analyzed levels of power has decreased. The people do not trust the Legislative Assembly most of all. More than one third of the residents have a neutral position, thus creating the impression that the society is disappointed with the actions of local authorities; it misunderstands the true ultimate effect and the feasibility of ongoing regional social events. Today people are plunged into a huge stream of continuous and often conflicting information provided by television, radio, the press, the Internet; and it is not surprising that only 28% of the Vologda Oblast population have trust in the media.
The current system of distribution of social benefits affects social well-being and emotional state of the population. Social well-being is an integral indicator reflecting economic, political and social processes taking place in the society; this indicator can be assessed by estimating social indicators, namely, the indicators showing the change of socially significant quantities that are
Table 5. Willingness of the population to participate in protest actions, in %
|
Answer |
2008 |
2012 |
|
I am willing |
12 |
8 |
|
I am sooner willing |
23 |
17 |
|
I am sooner not willing |
11 |
16 |
|
I am not willing |
27 |
32 |
|
It is difficult to answer |
27 |
27 |
|
Source: data of the surveys “Socio-cultural portrait of the region”, held by ISEDT RAS in 2008 and 2012. |
||
Figure 2. Distribution of answers to the question: “To what extent do you trust or not trust the government authorities?”, in %
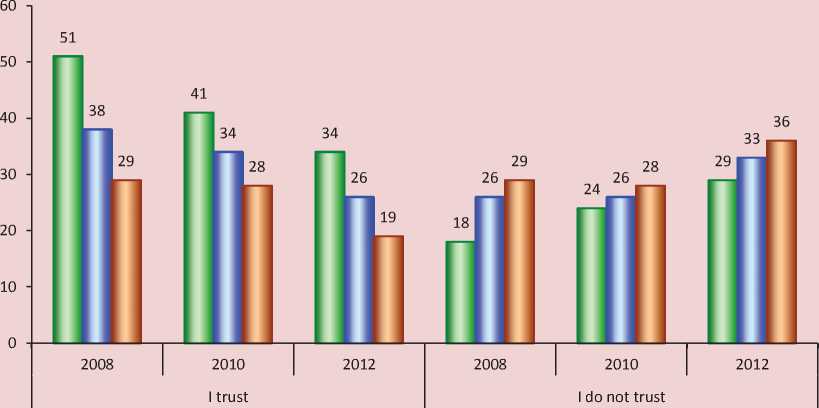
□Vologda Oblast Governor □Government □ Legislative Assembly, Duma
Source: data of the surveys “Socio-cultural portrait of the region”, held by ISEDT RAS in 2008, 2010 and 2012.
of importance in the analysis of social development, in the implementation and evaluation of social policy. In accordance with the methodology “The socio-cultural portrait of the region” [3] it includes three main components: the degree of safety of the region’s population from major dangers; the degree of satisfaction with their lives in general; the degree of optimism in the evaluation of their present and future [7]. The results of the calculations show that in 2010 in the Vologda Oblast the integral index of social well-being decreased from 0.62 (2008) to 0.58 and it was significantly lower than in the Northwestern Federal District and in Russia as a whole (fig. 3). At that time the region felt the consequences of the financial crisis, which seriously undermined its economy [5]. Subsequent stabilization of the socio-economic situation, the adoption of the Decree “On approval of measures to ensure sustainable functioning of the economy and social sphere” [6] by the Vologda Oblast Government had a positive impact on the residents’ well-being, so that in 2012 the ratio rose to 0.64. Note that the minimal level of the index sufficient for the stability of the society (the degree of its sensitivity to external environment changes) is in the range from 0.51 and above (the insufficient level is below 0.5). Thus, the analysis with regard to the Vologda Oblast proves that the sustainability of the society is at an extremely low level.
Figure 3. Dynamics of the index of social well-being of the population in the Vologda Oblast, Northwestern Federal District, and Russian Federation
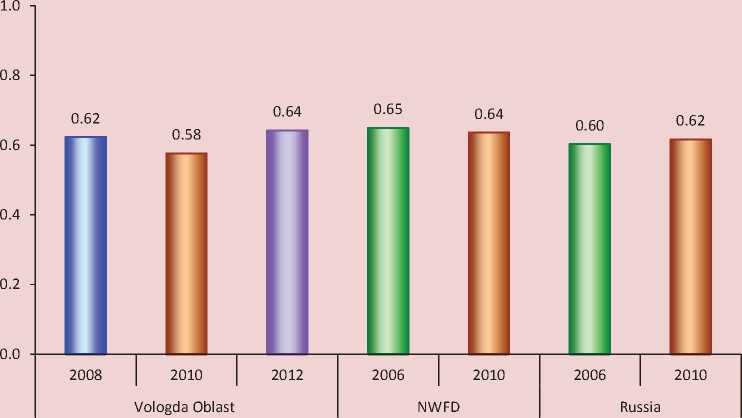
Source: data of the surveys “Socio-cultural portrait of the region”, held by ISEDT RAS in 2008, 2010 and 2012, and the surveys “Values and interests of Russia’s population”, held by CSSCC IP RAS in 2006 and 2010.
The detailed analysis of the components of the integral index shows that their changes are irregular. Satisfaction with life in the oblast residents was higher than their degree of optimism in 2012 (fig. 4) . The level of optimistic sentiment in the society and its degree of safety from dangers decreased in the post-crisis 2010. Managers experienced the greatest stress; the optimism ratio decreased in the people with low income, in those aged 35–55, and in unmarried people. The highest decrease in the index of social well-being was observed in urban-type settlements. the ratio of satisfaction with life in general was lower in the region in comparison with the Northwestern Federal District and the
Russian Federation (0.61 against 0.71 and 0.68, respectively, in 2010), the optimism indicator corresponded to the level of the NWFD and was higher than in Russia as a whole (0.61 against 0.58). The level of safety from dangers proved the most troublesome issue in the Vologda Oblast; for instance, its value was close to an unstable condition in 2010 [4].
By identifying the problems and dangers for the people, we can show some critical aspects of social development in the region. According to the estimates of the region’s residents, crime is the prime problem: 54% of the Vologda residents feel vulnerable to this danger. Poverty ranks second (53%).
Figure 4. Components of the index of social well-being in the Vologda Oblast population
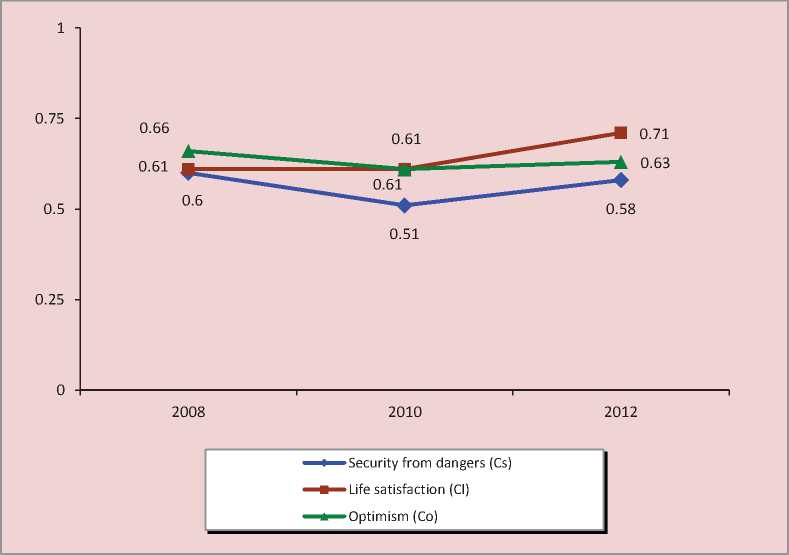
Source: data of the surveys “Socio-cultural portrait of the region”, held by ISEDT RAS in 2008, 2010 and 2012.
Arbitrariness of officials (45%) has been on the third place since 2012, ahead of environmental security that was considered relevant by 45% of the respondents in 2010. The average level of the residents’ security can be determined for the following categories: persecution for political beliefs, the arbitrariness of law enforcement agencies, environmental threat, loneliness and abandonment. A high level of security of the region’s residents can be judged by the degree of their differentiation by nationality, religious beliefs, age and sex (less than 25% of the respondents feel a sense of insecurity). Comparing 2008 with 2012 we point out the growing anxiety in the population, and the most significant increase (over 5%) is observed in the first four of the studied problems and dangers (tab. 6). All the categories of the population, regardless of age and income level, feel equally insecure. The divorced and those living in small towns (up to 100 thousand people) feel more insecure from social dangers than the people in other categories.
Thus, the Vologda Oblast residents do not feel any threat to their spiritual and ideological views; as for the issues related to safety of life and health, decent standard of living, legitimate and fair performance of the main social institutions, they are handled inefficiently. In our opinion, social security should provide a set of measures to support people’s life taking into account public interests and needs.
Table 6. Distribution of answers of the Vologda Oblast residents concerning their security from social dangers, %
|
No. |
Types of danger |
I am secure; I think I am secure |
It is difficult to say |
I think I am not secure; I am completely insecure |
||||||
|
2008 |
2010 |
2012 |
2008 |
2010 |
2012 |
2008 |
2010 |
2012 |
||
|
1. |
Crime |
13.4 |
10.9 |
14.3 |
34.1 |
35.8 |
32.3 |
48.6 |
53.3 |
53.5 |
|
2. |
Poverty |
19.8 |
13.3 |
17.3 |
31.7 |
36.7 |
29.4 |
46.1 |
50 |
53.3 |
|
3. |
Arbitrariness of officials |
20.5 |
17.3 |
19.5 |
38 |
39.6 |
35.2 |
38.9 |
43 |
45.3 |
|
4. |
Loneliness and abandonment |
28.1 |
24.2 |
27.4 |
33.9 |
36.4 |
29.4 |
36.8 |
39.5 |
43.2 |
|
5. |
Environmental damage |
27.1 |
20.8 |
23.2 |
32.9 |
34.1 |
35.1 |
37.8 |
45 |
41.7 |
|
6. |
Arbitrariness of law enforcement agencies |
21.4 |
19.1 |
20.3 |
36.6 |
41.6 |
38.5 |
39.3 |
39.3 |
41.2 |
|
7. |
Harassment on the basis of political opinions |
38 |
40.9 |
30.6 |
36.8 |
42.6 |
43.7 |
22.3 |
16.5 |
25.7 |
|
8. |
Age or gender harassment |
42.4 |
45.7 |
43.1 |
32.9 |
34.5 |
33.8 |
22.5 |
19.8 |
23.1 |
|
9. |
Religious harassment |
50.3 |
59 |
50.5 |
30.5 |
30.2 |
33.1 |
16.2 |
10.9 |
16.4 |
|
10. |
Racial harassment |
51.1 |
58.9 |
52.3 |
29.2 |
29.6 |
31.2 |
16.8 |
11.4 |
16.5 |
Note. Ranked by the column “I think I am not secure; I am completely insecure” in 2012.
Source: data of the surveys ‘”Socio-cultural portrait of the region” carried out by ISEDT RAS in 2008, 2010 and 2012.
Social policy should create conditions to stabilize social relations, to ensure efficiency and sustainability in the development of the whole society, which should react adequately to all positive and negative effects.
Social policy in the Vologda Oblast aims to create conditions for raising the standard of living and enhancing the quality of life of citizens in the area. For instance, the state program “Social support of the citizens in the Vologda Oblast for 2014–2018” provides for monthly money payments to veterans (the budget allocates 34 million rubles for this purpose), additional financial support to persons who deserved well of the Vologda Oblast (34 million rubles), allowances to low-income families (17.5 million rubles), allowances to low-income families raising children with disabilities (37.3 million rubles), money payments to other categories of citizens (805.4 million rubles), money compensation of the expenses for accommodation or utility services (1035 million rubles), provision of the citizens with subsidies to pay for accommodation and utility services (756.5 million rubles). In the Vologda Oblast there are more than 470 thousand people who obtain various kinds of social support on a monthly basis; they constitute almost 40% of the oblast population; and there are more than 1160 thousand (97%) of those who receive social support on a non-recurring basis or once a year.
In conclusion we emphasize that the scientific value of the research performed and the sociological material generalized has somewhat clarified the knowledge about the actual state and prospects of development of society in the Vologda Oblast. The main conclusion is as follows: it is necessary to achieve harmony between the spheres of social, cultural and economic life. It is important to recognize that social policy contributes a lot to efficient economic development. The financing of social programs should be carried out not only at the expense of state funds and local budgets, but also at the expense of enterprises, organizations and communities. Society should become “civil”, and this requires the activity of public organizations that are independent of the authorities. All the actions of the government should be subject to public control and should be transparent to people living in this region. People should participate in politics and socially important affairs. Social policy should protect the poor, develop education, promote health, protect the environment; in addition, it should pursue a goal of sensible impact on the sociocultural sphere of human activity with the purpose of changing it qualitatively. It should maintain relationships between and within different social groups and communities, thereby providing the conditions for raising the standard of living, and enhancing social welfare. It is also important to create economic incentives for people’s participation in social production, while social policy pursued by the government should be coordinated with the overall economic situation in the region and the country.
Cited works
-
1. Kostyleva L.V. Inequality of Russia’s Population: Trends, Factors, Regulation . Vologda: ISERT RAN, 2011. 223 p.
-
2. Kul’pina K.P., Sizova I.L. Participation of the Population in the Implementation of Social Policy. Bulletin of the Lobachevsky State University of Nizhny Novgorod. Social Sciences Series , 2007, no. 2 (7), pp. 62-69.
-
3. Lapin N.I., Belyaeva L.A. Program and Standard Tools “Socio-Cultural Portrait of the Region of Russia” (2010 Modification) . Moscow: IFRAN, 2010. 11 p.
-
4. Lastochkina M.A. Social Security of Russia’s Population: an Overview of the Past Years Studies. Economic and Social Changes: Facts, Trends, Forecast , 2013, no. 2, pp. 171-179.
-
5. Shabunova A.A., Gulin K.A., Lastochkina M.A., Solov’eva T.S. Modernization of the Economy of the Region: Socio-Cultural Aspects: Monograph. Vologda: ISERT RAN, 2012. 158 p.
-
6. On Approval of Measures to Ensure Sustainable Functioning of the Economy and Social Sphere of the Oblast: Decree of February 17, 2009 No. 255 .
-
7. Romashkina G.F. Socio-Cultural Portrait of the Tyumen Oblast: Experience of an Empirical Study. In: Experience of Testing the Standard Methodology “The Sociological Portrait of the Region: Proceedings of the All-Russian Research-and-Methodological Conference . Tyumen: TyumGU, 2006. Part 2. 182 p.
-
8. Ilyin V.A., Shabunova A.A., Lastochkina M.A., Antonova M.A. Through the Crisis to the Development of Industrial Modernization. Socio-Cultural Modernization of Russia’s Regions. Compiled and edited by L.A. Belyaeva, N.I. Lapin. Moscow: Academia, 2013. Chapter 15. Pp. 218-235.
-
9. Eurostat. Available at: http://epp.eurostat.ec .
References Monitoring of the region's social and cultural development as a component to enhance the effectiveness of social administration
- Regiony Rossii. Sotsial’no-ekonomicheskie pokazateli. 2009: stat. sb. . Rosstat. Moscow, 2013. P. 184
- Kostyleva L.V. Neravenstvo naseleniya Rossii: tendentsii, faktory, regulirovanie . Vologda: ISERT RAN, 2011. 223 p.
- Kul’pina K.P., Sizova I.L. Uchastie naseleniya v realizatsii sotsial’noi politiki . Vestnik Nizhegorodskogo universiteta im. N.I. Lobachevskogo. Seriya Sotsial’nye nauki , 2007, no. 2 (7), pp. 62-69.
- Lapin N.I., Belyaeva L.A. Programma i tipovoi instrumentarii “Sotsiokul’turnyi portret regiona Rossii” (Modifikatsiya -2010) . Moscow: IFRAN, 2010. 11 p.
- Lastochkina M.A. Sotsial’naya zashchishchennost’ naseleniya Rossii: obzor issledovanii poslednikh let . Ekonomicheskie i sotsial’nye peremeny: fakty, tenden-tsii, prognoz , 2013, no. 2, pp. 171-179.
- Shabunova A.A., Gulin K.A., Lastochkina M.A., Solov’eva T.S. Modernizatsiya ekonomiki regiona: sotsiokul’turnye aspekty: monografiya . Vologda: ISERT RAN, 2012. 158 p.
- Ob utverzhdenii meropriyatii po obespecheniyu ustoichivogo funktsionirovaniya ekonomiki i sotsial’noi sfery oblasti: postanovleniya ot 17 fevralya 2009 g. № 255 .
- Romashkina G.F. Sotsiokul’turnyi portret Tyumenskoi oblasti: opyt empiricheskogo issledovaniya . In: Opyt aprobatsii tipovoi metodiki “Sotsiologicheskii portret regiona”: sbornik materialov Vserossiiskoi nauchno-metodicheskoi konferentsii . Tyumen: TyumGU, 2006. Part 2. 182 p.
- Ilyin V.A., Shabunova A.A., Lastochkina M.A., Antonova M.A. Cherez krizis -k razvitiyu industrial’noi modernizatsii . Problemy sotsiokul’turnoi modernizatsii regionov Rossii . Compiled and edited by L.A. Belyaeva, N.I. Lapin. Moscow: Academia, 2013. Chapter 15. Pp. 218-235.
- Eurostat. Available at: http://epp.eurostat.ec.
