Monitoring of Wide Area Power System Network with Phasor Data Concentrator (PDC)
")
Author: Surender Kumar, M.K. Soni, D. K. Jain
Journal: International Journal of Information Engineering and Electronic Business(IJIEEB) @ijieeb
Article in issue: 5 vol.7, 2015.
Free access
This paper presents the fault detection technique in wide area power system network using Phasor Data Concentrator (PDC). Single line to ground (SLG) fault data of transmission line is processed using the WAMS technology. Phasor Data Concentrator (PDC) is primarily data collecting centres located at the control centre processing unit and is responsible for collecting all the PMUs data that is transmitted over the communication link, which will detect fault in transmission line. This will help the operators in control centre to monitor the health of wide area power system network, and can initiate corrective actions when time is the critical issue. In this paper, the voltage and current phasor information, and other transmission line parameters from 14 IEEE bus system is processed and detects the fault in transmission lines. The proposed fault detection technique in transmission line of wide area power system network is very useful for improving power system reliability and power quality.
Smart grid, Power Quality, fault detection, Phasor Measurement Unit (PMU), Phasor Data Concentrator (PDC), Wide Area Monitoring System (WAMS)
Short address: https://sciup.org/15013366
IDR: 15013366
Text of the scientific article Monitoring of Wide Area Power System Network with Phasor Data Concentrator (PDC)
Published Online September 2015 in MECS DOI: 10.5815/ijieeb.2015.05.04
Presently, the electric power grid is undergoing a significant transformation into an intelligent, reliable, secure, and fully automatic grid which is called the ‘smart grid’ (SG). Smart grid is an integration of advance communication infrastructure, information technology system, advanced measurement technology, advanced monitoring and control, into electrical power grid that uses to collect and act on information, such as information about the behaviours of utilities and customers, in an automated manner to improve the efficiency, reliability, security, economics, and sustainability of the production and distribution of electricity [1].
There are multiple objectives for developing and deploying smart grid technologies [2]. The key objectives are summarized as follows:
-
i .) To improve the reliability, availability, and
security of the power supply for consumers,
-
ii .) To maintain the quality of power supply to
increasing share of sensitive digital loads,
-
iii .) To improve efficiency and economy in power generation, transmission, distribution, storage, and utilization,
-
iv .) To improve security and safety in grid operation by observability and controllability of the power grid,
-
v .) To enable and promote the integration and utilization of renewable and sustainable energies, vi.) To enable and facilitate demand side participation to increase asset utilization and return on investment
Above mentioned objectives for deployment of smart grid technologies, require the collection of various types of information of energy generation, transmission, distribution, and storage through its communication infrastructure. This information can be exchanged between consumer and utility. Since reliable and effective information exchange is a key to the success of the future SG, a communication system in a SG must at least satisfy the some basic requirements which are documented in [3].
Modern power system is subject to a wide range of power quality disturbances, from small to large. Despite of disturbances, the supply of electric power should be continuous without any interruption. There should be no malfunction/damage of sensitive equipments. There should be no blackout and outage [2]. Therefore to achieve objective of smart grid, many technologies have been developed to supervise, monitor and control the power system during disturbances and to continue its operation [4].
Phasor measurement technology is one of them. The PMUs which are installed at strategic locations in wide area power system network send information to PDCs through communication link. Thereafter, PDCs, will detect fault in transmission line. This technology has gained significant attention after recent historic blackouts [4].
With increasing scale and complexity of wide area power system network due to deployment of smart grid technologies, the probability of power system fault which could occur at any voltage level, is also increasing in a geometric progression [5]. About 2/3rd faults in power system occur on transmission lines [6]. The occurrence of faults in a transmission line is uncertain. There are various reasons of fault. A contact between two or more lines causing short circuit or one or more lines coming with contact with ground in three phase power system are the reasons. A fault if not detected has many effects on a power system. A fault in power system results in power quality and damage of power system equipment. So, it becomes necessary to detect fault on the line and clear the fault as soon as possible in order not to cause such damages [7].
The remaining part of paper is organized as follows: The section II presents Wide Area Monitoring System (WAMS). The related work of fault detection in transmission line is presented in section III, followed by simulation results and discussion of proposed work in section III. The paper is concluded in section IV.
-
II. Wide Area Monitoring System (WAMS)
A measurement system that incorporates PMUs deployed over large portions of the power system is known as Wide Area Monitoring System (WAMS). The effective utilization of these technologies is very useful for improving power system reliability and power quality. The basic components of WAMS are as follows:
-
1) PMUs,
-
2) PDCs
-
3) Super PDC
-
4) Communication networks
The PMU is an intelligent measuring device to address many power quality problems around the world. PMUs are becoming an integral part in many power system applications from load flow analysis and state estimation to analyzing blackout causes. It is used to measure the voltage and current waveform that is synchronized with a clocking signal obtained continuously from the Global Positioning System (GPS) as per the synchrophasor standards [4].
The PMUs can be further used to calculate voltage and current magnitudes, phase angles, real and reactive power flows etc. The estimation of the phasor quantities is done using a Discrete Fourier Transformer (DFT) with both fixed and variable width sampling windows. The other attractive features of PMUs are such as high sampling rate of 30-60 samples/second, and high accuracy of 1 μs [8].
A Phasor Data Concentrator (PDC) is a PMU data collecting device that synchronizes the measurements taken at every time instant independent of when the data was received [9]. Similar to the PMU, the PDC time needs to be synchronized. PMUs phasor information in form of data stream is transmitted either via dedicated lines between specified locations, or over a switched link that is established for the purpose of the communication to PDCs. The phasor information is also sent to additional PDCs connected to other power utilities. PDC can also receive data from other PDCs.
Thereafter, the time synchronized data are transmit to a higher level of PDC (Super PDC) or to the superior application software for the analysis of power system, as shown in figure 1. Based on this analysis, monitoring, control, protection and various other functions are initiated. PDC’s must have storage capability to buffer data for a reasonable time to allow data alignment and other applications for subsequent event analysis.
The PDC also monitors power quality indices such as voltage sag, frequency, active power, and reactive power. The PDC can also have other functionality, such as bad data rejection, error checking and to create a coherent record of simultaneously recorded data.
The data stream between the PMUs and PDCs is defined by a standard developed for measurement and transfer of synchrophasors [10]. This standard defines the reporting rate of the incoming PMU data frames as submultiples of the system frequency such as 10, 25 and 50 Hz for a 50 Hz system and 10, 12, 15, 20, 30 and 60 Hz for a 60 Hz system. IEEE standard C37.242-2013 is for guidelines for installation testing of PDC and IEEE standard C37. 244-2013 is for PDC communication and requirements. IEEE C37.118.2-2011 standard defines the synchrophasor message format in a configuration frame and data frame. There are four types of frames that are transmitted between PMU/PDC and PDC.
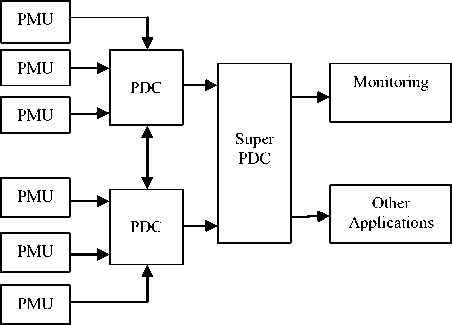
Fig. 1. Architecture of WAMS
A huge amount of information is transmitted from PMUs to PDCs. So, PDC’s should have storage capability to buffer data for a short time period to allow data alignment and other vital tasks. The PDC waits a maximum amount of time to receive an input from all PMUs for each individual time tag. If the PDC does not receive all PMU inputs, then it should label the missing PMU data block with a flag. If the PDC receives the missing PMU input after the maximum wait time, this frame is considered late and should be discarded. The wait time must also be much shorter than the buffer size since the buffer must store the data of all PMUs while the PDC is waiting. The maximum wait time should be set so that it can accommodate the PMU input that is usually received last under normal network delays. This setting should be higher than the average time difference between the latest arriving PMU input and the soonest arriving PMU input.
To transmit data stream between PMUs, PDCs, and Super PDC, there are several communication media such as power line carrier, satellite communication, microwave network, fiber optics, etc. Every medium has its merits and demerits. For example, the fiber optic communication networks permits to transmit large volumes of data from point to point with high reliability and lower error rate. The choice of communication medium depend upon the bandwidth, data transfer rate, and latency [11]. The permissible time delay during data transfer between PMU to PDC is 20 ms, PDC to Super PDC is 40 ms, and from control centre to relay at substation is 50 ms [12].
In addition to communication medium, PMUs need to use communication protocol to transmit PMUs phasor data to PDCs. Different communication protocols have been used by different PMU manufacturers. Limited maximum data throughput is the main limitation of the serial communication. Internet protocols are increasingly being used for PMU communications. These internet protocols are mostly used over Ethernets [13-14]
-
III. Related Work
Transmission and distribution lines are exposed to faults that are caused by different reasons such as short circuits, birds, and storms. The faults are symmetrical and unsymmetrical faults. The most prominent faults occurring in transmission lines are of four types, i.e. single phase to ground fault, line to line fault, double line to ground fault, and three phase short circuit fault. These faults are further classified by making subsequent sets, into total seven faults [15].
In power system network, the data measured during the fault must be collected over a large geographical area to determine the sequence of events and eventually the cause of the failure. Traditionally, the measurements are communicated by Remote Terminal Units (RTUs) and each RTU has its own local time source, therefore there may be large variations in the time stamp of the measurements from different RTUs. Due to advancement of smart grid technologies, fast, efficient and secure communication infrastructure with GPS facility is available.
In recent years, major efforts have been initiated to the exploration and development of new methodologies that detect faults that occur in the transmission and distribution lines. There are various methods exist in literature for monitoring, detecting and locating faults on power transmission and distribution system [16-23]. Several articles used artificial intelligent such as neural network, fuzzy logic, or genetic algorithm for fault detection. Also, many author used wavelet transform for detection [16]. However, fault detection methods for a wide area grid have not received the same amount of attention.
The conventional fault detection techniques are designed based on current or voltage magnitude measurements [17]. When faults occur in the power system, then, there will be significant changes in the system quantities like over-current, over or under-power, power factor, impedance, frequency and power or current direction. When a fault occurs on a power system is that fault current is almost greater than the pre-fault load current in any system element. A very effective and simple fault detecting principle is that of using the current magnitude as an indicator of a fault of the power system.
The condition of the fault occur on transmission line is mainly detected by two components. First is reduction in voltage of the transmission line because of the fault occurrence. The other component is the direction of the power flow after occurrence of the fault in transmission line. Fault current direction is determined with the help of phase angle with respect to reference quantity. Direction of fault will be known by comparing the phase angle of the transmission line. Power flow from higher phase angle to lower phase angle [18].
Most of methods for fault detection and localization, utilize phasor measurements of voltage and current of buses located different points in power system. The phasor data provides information of pre-fault or post-fault conditions. The phasor information enables system analysts to determine the exact sequence of events which have led to the blackouts.
It is widely recognized that two-terminal based fault detectors/locators are subject to errors coming from unsynchronized sampling clock. To overcome this limitation, Phasor Measurement Technology is an emerging technology. Use of a timing signal from GPS can greatly reduce or eliminate such errors.
The theory and algorithms for an adaptive fault detection/location technique based on PMU for transmission line is discussed in [19] and the new developed smart DFT based method and line parameter estimation algorithms are combined with PMU configuration to form the adaptive fault detection/locator system [20]. Lee et al. [21] utilized synchronized phasors at both terminals to obtain the fault location. The developed algorithm was based on positive and zero sequence components of post fault voltages and currents. In particular, errors will be presented when dealing with three phase faults where zero sequence components are absent.
-
IV. Simulation Results and Discussion
The simulation is carried out by standard IEEE 14 bus system using DigSilent software. A SLG fault is developed in bus system which causes a change in voltage at a certain point, not only in magnitude but also in phase angle. The simulation diagram for healthy and faulty IEEE 14 bus system is shown in figure 2 and 3 respectively. Load flow studies were performed for a healthy and faulty IEEE bus system. The voltage and current phasor information from IEEE 14 buses are processed and analyzed. The measured values of phase angle of bus, bus voltage, bus voltage (pu) during normal operation, and during fault between Line 13 and Line 14, are given in Table1 and Table 2 respectively.
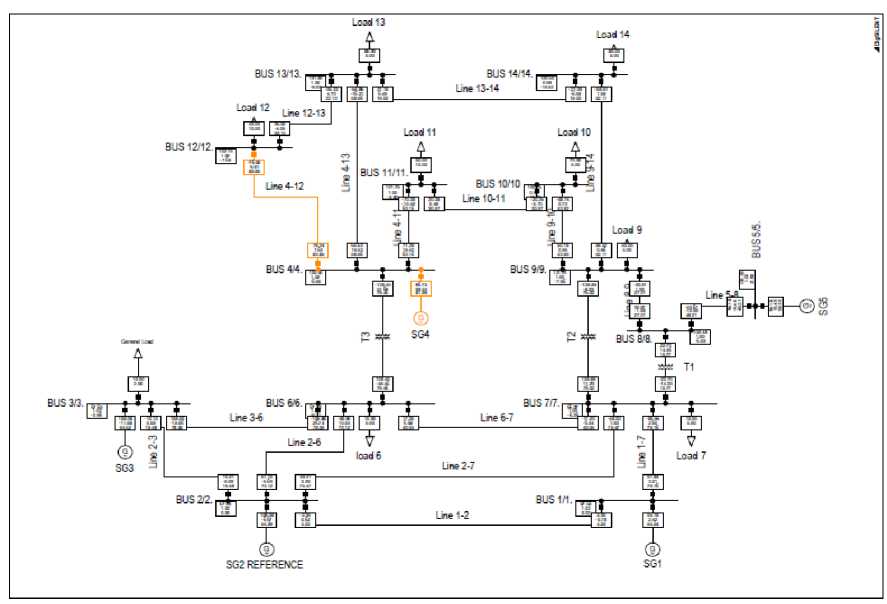
Fig. 2. Simulation diagram for healthy IEEE 14 bus system
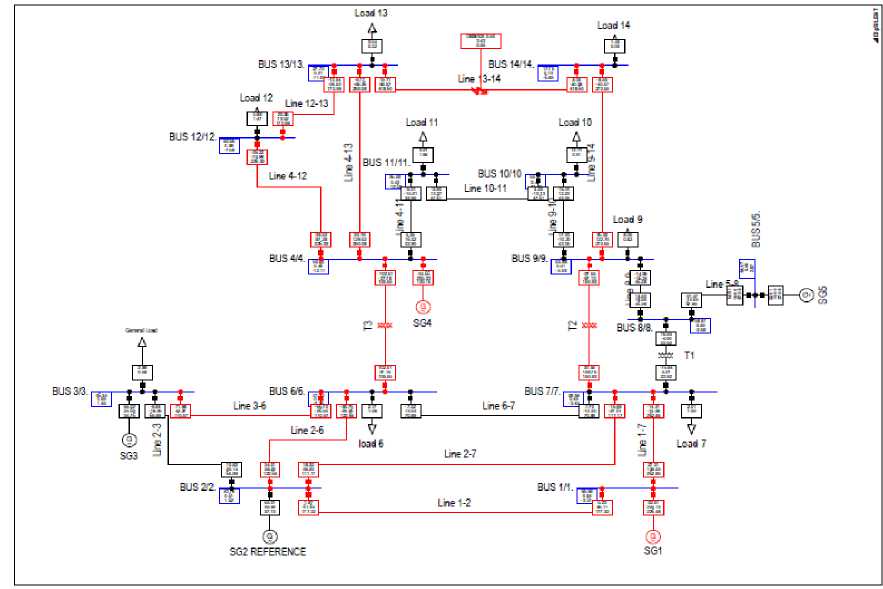
Fig. 3. Simulation diagram for fault in IEEE 14 bus system
If fault is nearer, measured voltage is lesser. If fault is farther, measured voltage is more. It is recommended that the voltage sag source, a short circuit fault, is located at the bus with the maximum voltage deviation. This criterion is adopted here to identify the faulty transmission line in the wide area power system network.
From Table 1 and Table 2, it is observed that there is maximum voltage deviation at bus 13 and bus 14. Figure show the graph bus voltage magnitude Vs bus nodes during fault between line 13 and line 14. It is clear that the there is a fault between line 13 and line 14.
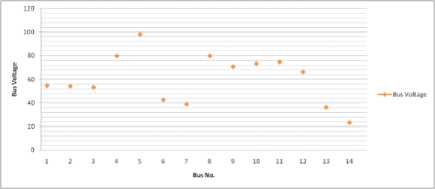
Fig. 4. Representation of bus voltage magnitude at various buses during fault at Line 13-14
Table 1. Measurement of phase angle, rated voltage, voltage (pu) under normal condition
|
Bus No |
Bus Voltage |
Bus Voltage (p.u) |
Phase Angle |
|
1 |
67.65 |
1.02 |
+0.30 |
|
2 |
67.65 |
1.02 |
+0.00 |
|
3 |
67.65 |
1.02 |
-0.96 |
|
4 |
135.30 |
1.02 |
-6.56 |
|
5 |
135.30 |
1.02 |
-3.58 |
|
6 |
67.08 |
1.02 |
-6.32 |
|
7 |
66.07 |
1.00 |
-6.26 |
|
8 |
132.48 |
1.00 |
-6.03 |
|
9 |
131.91 |
1.00 |
-7.56 |
|
10 |
130.76 |
0.9 |
-10.05 |
|
11 |
131.75 |
1.00 |
-9.81 |
|
12 |
132.15 |
1.00 |
-7.69 |
|
13 |
131.83 |
1.00 |
-9.53 |
|
14 |
130.60 |
0.99 |
-10.52 |
Table 2. Measurement of phase angle, rated voltage, voltage (pu) during fault at Line 13-Line 14
|
Bus No |
Bus Voltage |
Bus Voltage (p.u) |
Phase Angle |
|
1 |
54.75 |
0.83 |
+1.59 |
|
2 |
54.31 |
0.83 |
+0.91 |
|
3 |
53.35 |
0.81 |
-0.43 |
|
4 |
79.79 |
0.60 |
-5.14 |
|
5 |
98.09 |
0.74 |
-1.80 |
|
6 |
42.62 |
0.63 |
-2.34 |
|
7 |
39.00 |
0.59 |
-2.39 |
|
8 |
79.86 |
0.61 |
-2.32 |
|
9 |
70.85 |
0.54 |
-4.17 |
|
10 |
73.22 |
0.53 |
-3.30 |
|
11 |
74.78 |
0.57 |
-7.82 |
|
12 |
66.44 |
0.50 |
-0.60 |
|
13 |
36.36 |
0.28 |
-4.05 |
|
14 |
23.47 |
0.18 |
-5.49 |
The measurement of power during normal operation, and during fault between Line 13 and Line 14, are given in Table 3 and Table 4 respectively. From Table 3, it is observed that the power flows from higher level (+ ve) to lower level (-ve) during normal condition. From Table 4, during the fault occurring on line between 13 and 14, the direction of power flow between line 13 and 14 is +33.91 at line 13 and +14.12 at line 14 signifying a sink of power in between.
By simulating SLG fault on other transmission lines of IEEE 14 bus system, similar kind of observations validate the results.
Table 3. Power flow during normal condition
|
Node No |
Power flow between Lines |
Power (MW) |
Power (MW) |
|
1 |
Line 1-2 |
+2.43 |
-2.43 |
|
2 |
Line 1-7 |
+51.76 |
-50.58 |
|
3 |
Line 2-6 |
+51.13 |
-49.97 |
|
4 |
Line 2-7 |
+49.44 |
-48.37 |
|
5 |
Line 3-6 |
+108.53 |
-105.87 |
|
6 |
Line 4-11 |
+71.29 |
-70.40 |
|
7 |
Line 4-12 |
+78.24 |
-76.55 |
|
8 |
Line 4-13 |
+36.55 |
-36.32 |
|
9 |
Line 5-8 |
+54.19 |
-53.67 |
|
10 |
Line 6-7 |
+17.38 |
-17.22 |
|
11 |
Line 9-10 |
+50.17 |
-49.53 |
|
12 |
Line 10-11 |
-20.27 |
+20.21 |
|
13 |
Line 12-13 |
+36.55 |
-36.32 |
|
14 |
Line 13-14 |
+21.19 |
-21.10 |
Table 4. Power flow during fault at line 13-14
|
Node No |
Power flow between Lines |
Power (MW) |
Power (MW) |
|
1 |
Line 1-2 |
+3.60 |
-3.60 |
|
2 |
Line 1-7 |
+30.90 |
-25.98 |
|
3 |
Line 2-6 |
+36.62 |
-32.18 |
|
4 |
Line 2-7 |
+28.09 |
-23.33 |
|
5 |
Line 3-6 |
+85.03 |
-73.14 |
|
6 |
Line 4-11 |
+23.14 |
-22.65 |
|
7 |
Line 4-12 |
+66.25 |
-45.10 |
|
8 |
Line 4-13 |
+40.90 |
-16.7 |
|
9 |
Line 5-8 |
+27.50 |
--23.23 |
|
10 |
Line 6-7 |
+8.87 |
-7.96 |
|
11 |
Line 9-10 |
+15.97 |
-15.70 |
|
12 |
Line 10-11 |
-6.24 |
+06.54 |
|
13 |
Line 12-13 |
+34.99 |
-23.28 |
|
14 |
Line 13-14 |
+33.91 |
+14.12 |
-
V. Conclusion
In this paper, PDC is being used to detect transmission line fault after receiving PMUs data according to the GPS time stamp. After processing PMUs data, PDC sent time stamp data to control centre for further advanced applications. Thereafter, the operators in control centre can monitor the status of health of modern power grid in real time, and can send alarming signals. This technique can be used for a wide area grid with many buses and transmission lines involved. Effective utilization of WAMS technology is very useful for improving power system reliability and power system monitoring. The advantage of this technique is the fast transfer of data and detection of faulty line.
References Monitoring of Wide Area Power System Network with Phasor Data Concentrator (PDC)
- S. E. Collier, "Ten Steps to a Smarter Grid", IEEE Industry Application Magazine, vol. 16, no. 2, 2010, pp. 62-68.
- Berger Lars T. and Krzysztof Iniewski, Smart Grid: Applications, Communications, and Security, (Edited): Willey Pub. 2012.
- C. H. Hauser, D. E. Bakken, and A. Bose, "A Failure to Communicate: Next Generation Communication Requirements, Technologies, and Architecture for the Electric Power Grid", IEEE Power and Energy Magazine, vol. 3, no. 2, March-April 2005, pp. 47-55.
- Saikat Chakrabarti, Elias Kyriakides, Tianshu Bi, Deyu Cai, and Valdimir Terzija, "Measurements Get Together," IEEE Power and Energy Magazine, Jan. /Feb. 2009, vol.7, no. 1, pp. 41-49.
- Zheng Zhao, Can Wang, Yagang Zhang, and Yi Sun, "Latest Progress of Fault Detection and Localization in Complex Electrical Engineering", Journal of Electrical Engineering, vol. 65, no. 1, 2014, pp. 55–59.
- M. Singh, K.B. Panigrahi, and R.P.Maheshwari, "Transmission Line Fault Detection and Classification", International Conference on Emerging Trends in Electrical and Computer Technology (ICETECT), March 2011, pp. 15 - 22
- R.C. Dugan, M. F. McGranaghan, and H.W. Beaty, Electric Power Systems Quality. New York, McGraw-Hill, 1996.
- A.G. Phadke, "Synchronized Phasor Measurements in Power Systems", IEEE Computer Application Power, vol. 6, no. 2, 1993, pp. 10-15.
- C. Martinez, M. Parashar, J. Dyer, and J. Coroas, "Phasor Data Requirements for Real Time Wide-Area Monitoring, Control and Protection Application," EIPP White Paper, 26th Jan., 2005, pp. 1-27.
- IEEE Standard for Synchrophasor Measurements for Power Systems, IEEE Standard 1344-1995 (R2001), 1995.
- IEEE Standard C37.118-2005, IEEE Standard for Synchrophasors for Power Systems, (Revision of IEEE Std 1344-1995.
- Yi Deng, Hua Lin, A. G. Phadke, S. Shukla, J. S. Thorp, and L. Mili, Communication Network Modeling and Simulation for Wide Area Measurement Applications, IEEE PES Innovative Smart Grid Technologies (ISGT), 2012, pp. 1-6.
- IEEE Standard for Synchrophasor Data Transfer for Power Systems, IEEE C37. 118. 2-2011, (Revision of IEEE Std. C37.118-2005
- IEEE Power System Relaying Committee, "IEEE PC37.244 D6.0, Draft Guide for Phasor Data Concentrator Requirements for Power System Protection, Monitoring and Control," IEEE Power and Energy Society, New York, 2013
- Chung Wang, et al., "A WAMS/PMU Based Fault Location Technique," Electric Power System Research, vol. 77, no.8, Jun 2007, pp. 936-945.
- K.M. Silva, B.A Souza, and N.S. D. Brito, "Fault Detection and Classification in Transmission Lines Based on Wavelet Transform and ANN", IEEE Transactions on Power Delivery, vol. 21, no.4, 2006, pp. 2058 – 2063.
- Kola Venkataramana Babu, Manoj Tripathy, and Asheesh K Singh, " Recent Techniques used in Transmission Line Protection: a Review", International Journal of Engineering, Science and Technology, vol. 3, no. 3, 2011, pp. 1-8
- M. Saha, J. Izykowski, and E. Rosolowski, Fault Location on Power System, Springer, New York, 2010.
- Joe-Air Jiang, et al., "An Adaptive PMU based Fault Detection/Location Technique for Transmission Lines .1. Theory and Algorithms," IEEE Transactions on Power Delivery, vol.5, no.2, 2000, pp. 486-493.
- Joe-Air Jiang, e al., "An Adaptive PMU Based Fault Detection/Location Technique for Transmission Lines. II. PMU Implementation and Performance Evaluation," IEEE Transactions on Power Delivery, vol.5, no.4, 2000, pp.1136-1140.
- C. J. Lee, J.B. Park, J.R. Sin, and Z.M. Radojevie, " A New Terminal Numerical Algorithm for Fault Location, Distance Protection, and Arching Recognition", IEEE Transactions on Power System, vol. 21, no. 3, August 2006, pp.1460-1462.
- C. S. Yu, C. W. Liu, S. L. Yu, and J.A. Jiang, "A New PMU Based Fault Location Algorithm for Series Compensated lines," IEEE Transactions on Power Delivery, Jan. 2002, vol. 17, no. 1, pp. 33–46.
- S.M. Brahma, and A.A. Giris, "Fault Location on a Transmission Line using Synchronized Voltage Measurements", IEEE Transactions on Power Delivery, vol. 19, no. 4, 2004, pp.1619-1922.
- Ching-Shan Chen, Chih-Wen Liu, and Joe-Air Jiang, "A New Adaptive PMU Based Protection Scheme for Transposed/Untransposed Parallel Transmission Lines", IEEE Transactions on Power Delivery, vol. 17, no. 2, April 2002, pp. 395-404.
