Morphophysiological parameters of hard and soft wheat genotypes depending on different water supply

Author: Abdulbagiyeva Sevda, Mammadova Sevinj, Zamanov Atif, Ibrahimova Irada
Journal: Бюллетень науки и практики @bulletennauki
Section: Сельскохозяйственные науки
Article in issue: 4 т.9, 2023.
Free access
To determine drought tolerance of 10 wheat varieties (3 durum and 7 bread) differing in architectonics, the research was performed under normal and drought conditions. The reduction in the plant height due to cultivation conditions rather than genetic properties of the genotypes occurred because of the decreasing length of upper internodes by 0.47-9.51%. Structural components of the product were determined. The greatest reduction in above-ground dry biomass per unit of the field was detected in Barakatli 95 and Garagylchyg 2 genotypes. The amounts of pigments were determined to evaluate the level of the photosynthetic apparatus development, its physiological state, formation and accumulation potential of the product. The content of chlorophyll a, b and carotenoids was determined during the grain forming, milk ripening, and wax ripening phases. Green plastids were broken down and chlorophyll content decreased under drought. Chlorophyll a content decreased more sharply compared with chlorophyll b. Chlorophyll a content decreased more sharply in all phases in the durum variety Barakatli 95 (during the phases, respectively, 19.7; 16.6 and 35.6%) and bread variety Gyrmyzy gul 1 (21.9; 15.3; 39.5%). Chlorophyll b amount decreased less in the durum variety Tartar (11.0; 7.30; 14.2%) and bread variety 4th FEFWSN-50 (4.83; 10.8; 9.20%). Amounts of the photosynthetic pigments were determined in various regions (Gobustan and Jalilabad Regional Experimental Stations). Chlorophyll a content decreased more in the Gyrmyzy gul 1 and Garagylchyg 2 varieties (in Gobustan: 2.302 and 2.979 mg/g fresh weight) in Jalilabad: 2.096 and 2.737 mg/g fresh weight) under rainfed conditions. Drought had a relatively less impact on chlorophyll a content in the Azamatli 95 and Gobustan varieties. Chlorophyll b content ranged from 0.033 to 2.398 mg/g fresh weight in Gobustan and from 0.057 to 2.175 mg/g fresh weight in Jalilabad, whereas the content of did not decrease.
Wheat, drought resistance, chlorophylls, carotenoids
Short address: https://sciup.org/14127645
IDR: 14127645 | UDC: 633.11:633.112 | DOI: 10.33619/2414-2948/89/14
Морфофизиологические показатели генотипов твердой и мягкой пшеницы в зависимости от различной водоснабженности
Для определения засухоустойчивости 10 сортов пшеницы (3 твердых и 7 мягких), различающихся по архитектонике, были проведены исследования в нормальных и засушливых условиях. Снижение высоты растений за счет условий выращивания, а не генетических свойств генотипов произошло за счет уменьшения длины верхних междоузлий на 0,47-9,51%. Определены структурные компоненты продукта. Наибольшее снижение надземной сухой биомассы на единицу площади отмечено у генотипов Баракатли 95 и Гарагылчыг 2. Количество пигментов определяли для оценки уровня развития фотосинтетического аппарата, его физиологического состояния, способности образования и накопления продукта. Содержание хлорофиллов a, b и каротиноидов определяли в фазы формирования зерна, молочения и восковой спелости. Зеленые пластиды разрушались, а содержание хлорофилла уменьшалось при засухе. Содержание хлорофилла a уменьшалось более резко по сравнению с хлорофиллом b. Содержание хлорофилла а снижалось более резко во все фазы у твердого сорта Баракатли 95 (по фазам соответственно 19,7, 16,6 и 35,6%) и мягкого сорта Гырмызы гуль 1 (21,9, 15,3 и 39,5%). В меньшей степени количество хлорофилла b уменьшилось в сортах твердых сортов Тартар (11,0, 7,30 и 14,2%) и мягком сорте 4th FEFWSN-50 (4,83, 10,8 и 9,20%). Количество фотосинтетических пигментов определяли в различных районах (Гобустанская и Джалилабадская опытные станции). Содержание хлорофилла a в большей степени уменьшилось в сортах Гырмызы гюль 1 и Гарагылчыг 2 (в Гобустане: 2,302 и 2,979 мг/г сырого веса), в Джалилабаде: 2,096 и 2,737 мг/г сырого веса) в условиях богарного земледелия. Засуха относительно меньше повлияла на содержание хлорофилла a у сортов Азаматли 95 и Гобустан. Содержание хлорофилла b колебалось от 0,033 до 2,398 мг/г сырого веса в Гобустане и от 0,057 до 2,175 мг/г сырого веса в Джалилабаде, тогда как содержание хлорофилла не уменьшалось.
Text of the scientific article Morphophysiological parameters of hard and soft wheat genotypes depending on different water supply
Бюллетень науки и практики / Bulletin of Science and Practice
Climate change that is a major environmental problem in the world, poses a serious threat to ecosystems, food security, water resources and economic stability in general [1]. Frequent and prolonged droughts due to climate change in different parts of the world lead to reduced productivity and food shortages [7].
Climate change, which makes it difficult to ensure food security, has become a global problem, and drought has been a major stressor in many countries, negatively affecting the plant productivity [5]. Frequent droughts, which are abiotic stressors, lead to the spread of diseases in wheat varieties and a decrease susceptibility to biotic stresses. This leads to both loss of product and quality to reduce [2].
Frequent droughts, which are abiotic stressors, lead to the spread of diseases in wheat varieties and reduced susceptibility to biotic stresses. This leads to both loss of product and reduced quality. Considering that wheat is an important, strategical plant ensuring food security, selection of new, intensive, tolerant to biotic and abiotic factors wheat varieties that are suitable for the ecological conditions of the regions and applying them to the production is very actual for the development of grain growing. Recent research is focused on increasing drought tolerance as well as the quality of wheat varieties [1-3, 10].
Materials and methods
Phenological observations were performed according to Kuperman (1984) [8]. Chlorophyll a, b and carotenoids of leaf extracts were determined spectrophotometrically (Genesys 20, Thermo Scientific, USA) in 96% ethanol at 664, 648, 470 nm, respectively, and expressed as mg/g fresh weight (Lichtenthaler 1987). Productivity was determined using sheaves taken from a unit area [3].
Local bread and durum wheat genotypes and the wheat genotypes introduced from international centers were selected as the object of the research.
Results and discussion
Drought tolerance of 10 regionalized and perspective wheat varieties (3 durum and 7 bread varieties) differing in architectonics and other indices has been studied. Perspective wheat varieties introduced from various international centers and chosen from nurseries (12nd FAWWON no. 97 and 4th FEFWSN no. 50) were used as the study objects along with local genotypes. Structural analysis of the production was performed, and morphological traits of watered and drought-exposed plants were compared.
The height of genotypes, which not only depends on genetic properties but also on the water supply, decreased in all genotypes exposed to drought, so it is mainly attributed to the decrease of the length of upper internodes [10].
The height of watered and drought exposed plants in the ranged 85.4-88.4 cm and 80,0-85,0 cm during vegetation, respectively, which indicates 0.47-9.51% decrease due to drought (Figure 1).
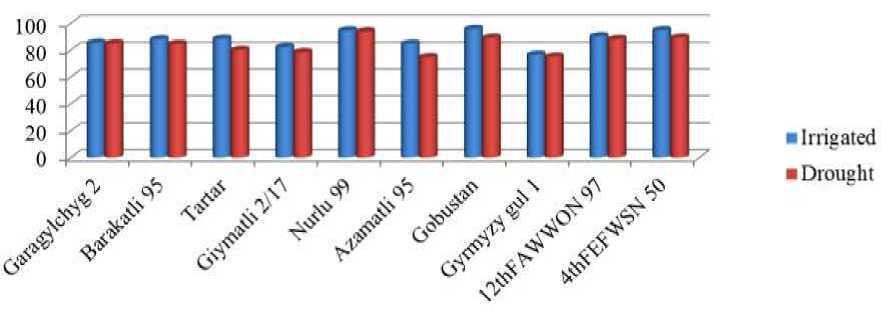
Figure 1. Effect of the drought stress on the height of wheat genotypes, cm
The smallest decrease was observed in Garagylchyg 2 (0.47%). In bread wheat varieties, it varies in the range of 76.6-95.6 cm and 74.8-93.8 cm, respectively, and the reduction from the effects of drought is 0.85-11.8% [4].
The level of the development and physiological state of the photosynthetic apparatus, formation and harvesting potential of the production under various cultivation conditions can be assessed based on pigment amounts. Amounts of chlorophyll “a”, “b” and carotenoids were determined in the VIII tier leaves of watered and drought exposed wheat genotypes, during the heading, milk ripening and, wax ripening phases. Drought caused the plastid destruction leading to the chlorophyll content decline. The chlorophyll “a” content was found to decrease more sharply compared with chlorophyll “b” under drought [5].
The chlorophyll “a” content in the durum wheat genotype Barakatli 95 (in respective phases, 19.7, 16.6 and 35.6%) and the bread wheat genotype Gyrmyzy gul 1 (in respective phases, 21.9, 15.3, and 39.5%) decreased more sharply compared with other genotypes during all phases. The chlorophyll “b” content decreased less in the durum wheat genotype Tartar (in respective phases, 11.0, 7.30 and 14.2%) and in the bread wheat genotype 4thFEFWSN 50 (in respective phases, 4.83, 10.8 and 9.20%) (Figures 2a, 2b) [6].
The amounts of pigments decreased in all genotypes exposed to drought and the largest decrease in chlorophyll (a + b) was observed in the durum wheat variety Barakatli 95 (in respective phases, 19.2, 25.2 and 31.9%), and bread wheat variety Gyrmyzy gul 1 (in respective phases, 21.8, 24.5 and 37.8%). The highest chlorophyll (a + b) amount was observed in watered variants of Gyrmyzy gul 1 and Barakatli 95.
The amount of the photosynthetic pigments was determined also in the VIII tier leaves of the same genotypes in regions with contrasting climate conditions: Gobustan (drylands, rainfed) Jalilabad (plains, rainfed), Absheron (irrigated).
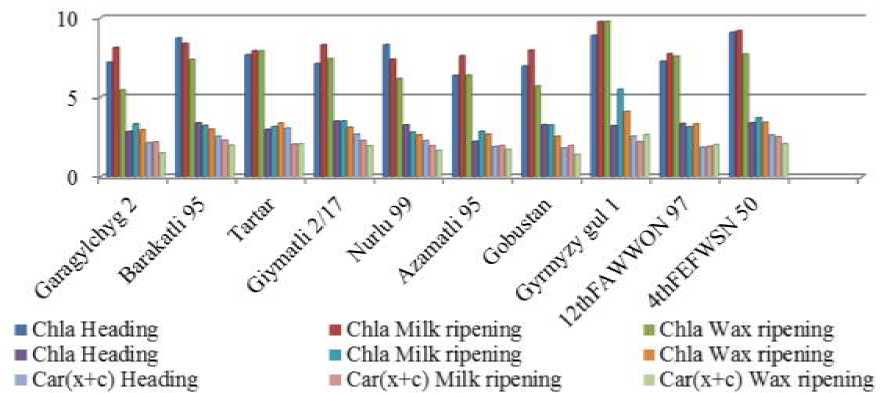
Figure 2 (a). Chlorophyll content in the VIII tier leaves of wheat varieties (watered), mg/g fresh weight
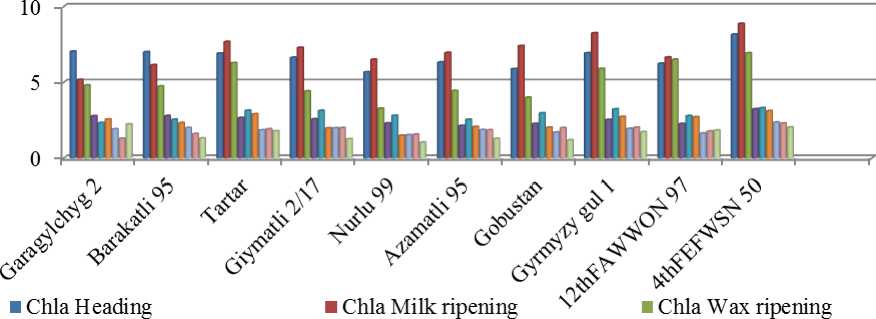
■ Chib H eading ■ Chib Milk ripening ■ Chib Wax ripening
■ Car(x+c) Heading ■ Car(x+c) Milk ripening ■ Car(x+c) Wax ripening
Figure 2 (b). Chlorophyll content in the VIII tier leaves of wheat varieties (drought), mg/g fresh weight
The amounts of the photosynthetic pigments decreased under rainfed conditions compared with irrigated ones (Figure 3). The largest amount for chlorophyll “a” was detected in the Gyrmyzy gul 1, 4th FEFWSN 50 and 12th FAWWON 97 (respectively, 9.739, 9.171 and 9.068 mg/g fresh weight) genotypes under irrigated conditions. Under rainfed conditions, the chlorophyll “a” content decreased more in the Gyrmyzy gul 1 and Garagylchyg 2 varieties (respectively, in Gobustan 2.302 and 2.979 mg/g fresh weight, Jalilabad 2.096 and 2.737 mg/g fresh weight) exposed to drought. Whereas a weak effect of drought on the chlorophyll “a” amount was detected in the Azamatli 95 and Gobustan varieties.
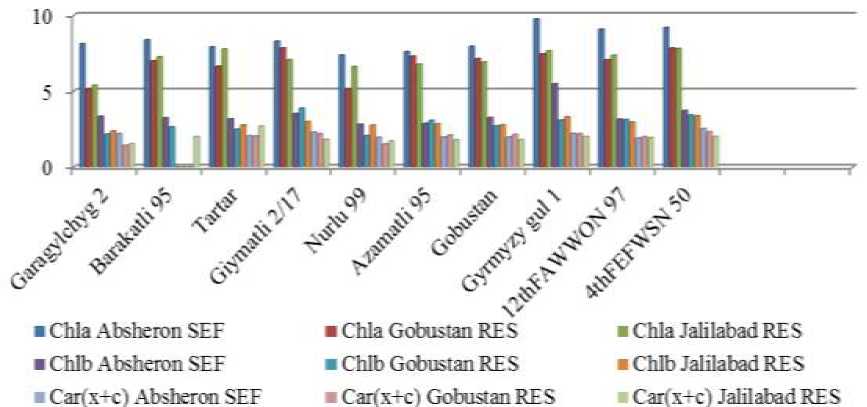
Figure 3. Chlorophyll content in the VIII tier leaves of wheat varieties in various regions, mg/g fresh weight
The amount of chlorophyll “b” changed under drought in the range of 0.033-2.398 mg/g fresh weight and 0.057-2.175 mg/g fresh weight in the Gobustan and Jalilabad regions, respectively. The carotenoid content also decreased in all studied varieties under rainfed conditions [7].
1000 kernel mass was higher in the durum wheat varieties compared with bread wheat varieties and under both conditions, this parameter was greater in the Barakatli 95 variety (respectively, 54.8 and 46.6 g), which can be attributed to the decrease in the amount of photoassimilates transported to grain under drought. High grain yield was found in the durum wheat varieties Barakatli 95, which ranged under irrigated conditions from 473 to 696 g/m2 and under drought from 437 to 603 g/m2. Higher productivity was observed in the bread wheat varieties Gobustan (650 and 600 g/m2) and Azamatli 95 (625 and 595 g/m2) compared with other bread wheat varieties. Due to the drought, a greater decrease in grain yield was observed in the 4thFEFWSN 50 (28,0%), Giymatli 2/17 (16,7%), Tartar (15,9%) genotypes, a less decrease was detected in the Azamatli 95(4,8%) variety (Figure 4) [8].
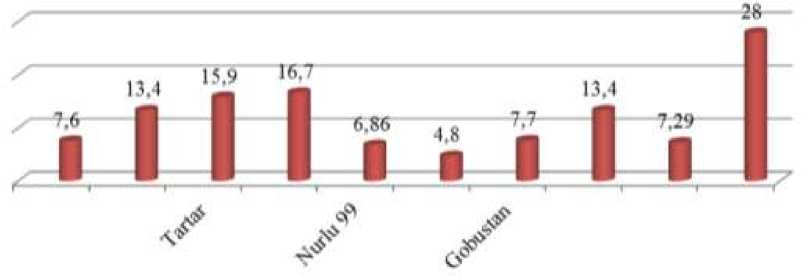
Figure 4. Decrease in productivity of wheat genotypes exposed to drought stress, %
The productivity index expresses the transportation degree of the assimilates accumulated in vegetative organs. The results of our research showed that the average productivity index was higher in the bread wheat varieties compared with durum wheat genotypes. In both variants productivity index was higher in the durum wheat varieties Tartar (respectively, 0.32 and 0.31), in the Gyrmyzy gul 1 (respectively, 0.36 and 0.35) and Gobustan (respectively, 0.34 and 0.34) genotypes [9].
Wheat genotypes are mainly infected with brown rust and powdery mildew. Brown rust in durum wheat was observed in Garagylchyg 2 variety (10MS) at irrigated conditions. Depending on the conditions, the infection with powdery mildew was in the range of 4-6 points in irrigation and 26 points in drought. At bread wheat, brown rust is found in 57.1% of the varieties studied under irrigation (Giymatli 2/17 30S, Gobustan 20MS, Gyrmyzy gul 1 60S and 4thFEFWSN 50 10S), and in drought conditions in 28.5% (Giymatli 2/17 10S and Gyrmyzy gul 1 20S) were observed. Infection with floury dew was in the range of 3-8 points and 2-8 points, respectively. Infection with powdery mildew was in the range of 3-8 points and 2-8 points, respectively [10].
The linear relationship between spike elements and productivity was studied using SPSS 16.1 program (Table). A positive and strong correlation was detected between the grain productivity and biological productivity, between the mass of the grains per spike and the mass of spike grain of watered. A positive and strong correlation was detected between the biological productivity and grain productivity.
Table
LINEAR RELATIONSHIP BETWEEN SPIKE ELEMENTS AND PRODUCTIVITY OF WHEAT VARIETIES
Drought Watered
|
PH |
BP |
GP |
TKW 1000 |
LS |
WS |
NS |
MS |
NGS |
MGS |
|
|
PH |
1 |
0.272 |
0.461 |
0.068 |
0.529 |
0.260 |
-0.136 |
0.330 |
0.520 |
0.400 |
|
BP |
0.306 |
1 |
0.766** |
0.363 |
-0.244 |
0.209 |
-0.206 |
0.229 |
0.181 |
0.259 |
|
GP |
0.426 |
0.802** |
1 |
0.138 |
0.039 |
0.359 |
-0.272 |
0.389 |
0.581 |
0.487 |
|
TKW 1000 |
-0.077 |
-0.129 |
-0.316 |
1 |
-0.722* |
-0.182 |
-0.065 |
0.474 |
-0.044 |
0.478 |
|
LS |
0.523 |
0.276 |
0.542 |
-0.459 |
1 |
0.437 |
0.113 |
-0.177 |
0.219 |
-0.143 |
|
WS |
-0.066 |
0.009 |
0.151 |
0.253 |
0.346 |
1 |
0.563 |
0.485 |
0.135 |
0.466 |
|
NS |
-0.022 |
0.063 |
-0.260 |
0.759* |
-0.088 |
0.264 |
1 |
0.018 |
-0.495 |
-0.051 |
|
MS |
0.052 |
0.176 |
0.137 |
0.776** |
-0.007 |
0.382 |
0.686* |
1 |
0.542 |
0.985** |
|
NGS |
-0.129 |
0.253 |
0.421 |
0.407 |
0.127 |
0.422 |
0.364 |
0.795** |
1 |
0.627 |
|
MGS |
0.047 |
0.185 |
0.215 |
0.675* |
0.030 |
0.336 |
0.539 |
0.977** |
0.844** |
1 |
Abbreviations are as follows: PH — plant height, BP — biological productivity, GP — grain productivity, TKW — 1000 kernel weight, LS — length of spike, WS — width of spike, NS — the number of spikelets, MS — the mass of spike, NGS — the number of grains per spike, MGS — the mass of the grains per spike
1000 kernel weight positively correlated with, the mass of spike, and the mass of grains per spike. A positive correlation was observed between the number of spikelets and the mass of spike, between the mass of spike and the number of grains per spike, the mass of the grains per spike, between the number of grains per spike and the mass of the grains per spike.
Conclusion
Thus, water stress (drought) retarded the growth of the wheat genotypes and decreased indices of the structural elements (biological productivity, the spike mass, the number of spikelets per spike, the number and mass of grains per spike, 1000 kernel weight) of production. The decrease in grain yield was found to be 7.60-15.9% in durum and 4.80-28.0% in bread wheat genotypes under drought conditions. Drought caused decreases in amounts of chlorophyll a, b, (a + b) and carotenoids.
References Morphophysiological parameters of hard and soft wheat genotypes depending on different water supply
- Абугалиева А. И., Кипшакбаева Г. А. Оценка исходного материала на качество зерна // Центральноазиатская конференция. Алматы, 2003. С. 197-198.
- Курбанов Г. К., Умарова М. М. Ценные сорта для селекции пшеницы по качеству // Центральноазиатская конференция. Алматы, 2003. С. 199.
- Уразалиев Р. А., Аширбаева С., Абугалиева А. И. Озимая твердая пшеница: качество зерна, урожайность и стабильность их формирования // Пшеница и тритикале. 2001. С. 293-298.
- Bray E. A. Responses to abiotic stresses //Biochemistry and molecular biology of plants. 2000. P. 1158-1203.
- Khakwani A. A., Dennett M. D., Munir M. Drought tolerance screening of wheat varieties by inducing water stress conditions // Songklanakarin Journal of Science & Technology. 2011. V. 33. №2.
- Reynolds M. P., Ortiz R. Adapting crops to climate change: a summary // Climate change and crop production. Wallingford UK: CABI, 2010. P. 1-8.
- Da Silva E. C. Drought stress and plant nutrition // Plant stress. 2011. V. 5. №1. P. 32-41.
- Куперман Ф. М. Морфофизиология растений: Морфофизиол. анализ этапов органогенеза различных жизненных форм прокрытосеменных растений. М.: Высшая школа, 1977. 288 с.
- Lichtenthaler H. K. Chlorophylls and carotenoids: pigments of photosynthetic biomembranes // Methods in enzymology. Academic Press, 1987. V. 148. P. 350-382.
- Абдулбагиева С. А., Ахмадова Ф. А., Заманов А. А., Ибрагимова И. Г. Изучение влияния засухи на морфофизиологические особенности генотипов пшеницы // Труды НИИ растениеводства. 2018. Т. 29. С. 192-198.
