Mortgage availability vs. availability of housing. We wanted the best, but it turned out...?

Author: Basova Elena A.
Journal: Economic and Social Changes: Facts, Trends, Forecast @volnc-esc-en
Section: Regional economy
Article in issue: 4 т.14, 2021.
Free access
The Russian government's decision to lower mortgage rates in the spring of 2020 was announced as a measure to support the population during the spread of coronavirus infection. However, is this decision optimal and strategically correct in terms of improving the availability of housing for Russian citizens in the future? In the context of rising real estate prices, this issue in domestic economic research is insufficiently addressed. The relevance of the research is additionally conditioned by the evaluation necessity of the “bubble” formation probability on the primary housing market due to the “double boom”. In this paper, we present the study results of availability of housing dynamics for the period from 2000 to 2020. We identified the regions with the lowest and the highest availability of housing. We have studied the current state of the mortgage lending market in Russia and constructed a multiple regression factor model for residential real estate prices on the new housing market. The scientific novelty of the presented research consists in the determination of the reasons of the rash growth of real estate prices in the spring of 2020 on the Russian housing market and their forecast for the medium term period. It is recognized that in modern conditions the key factor contributing to the increase in primary housing prices is the reduction in mortgage interest rates on loans. The decision to sharply reduce the interest rate has caused an increased demand for housing and the subsequent excessive growth of prices, which ultimately did not contribute to the availability of housing. We substantiate the absence of a “bubble” and the reasons for lower prices on the Russian residential real estate market in the short term. We have implemented the forecasting of primary housing prices through a combination of traditional economic tools and neural networks. The persistence of significant price levels on the Russian market of new buildings in the medium term can be explained by the negative trends in the development of key influencing factors and other macroeconomic indicators characterizing the socio-economic development of the country. We have proposed managerial measures aimed at expanding the availability of housing for Russian citizens.
Availability of housing, preferential mortgage lending, primary housing market, real estate price growth factors, neural network modeling
Short address: https://sciup.org/147235420
IDR: 147235420 | UDC: 338 | DOI: 10.15838/esc.2021.4.76.7
Text of the scientific article Mortgage availability vs. availability of housing. We wanted the best, but it turned out...?
Contemporary Russia is characterized by a significant level of non-monetary inequality [1; 2], one of the clearest manifestations of which is the limited availability of housing. According to the Presidential Address of the Russian Federation to the Federal Assembly in April 2021, the expansion of the availability of housing remains the main task in the country’s development and improving the quality of life of Russian citizens1. However, the satisfaction of the basic human need for housing is complicated by a number of negative aspects which are characterized not only by regional spatial heterogeneity in the volume of housing commissioning, but also, above all, by the low income level of population and a sharp increase in real estate prices, accelerated during the transition to the market. These factors have significantly increased the level of the unavailability of housing for the vast majority of population.
As of January 1, 2020, 2266.854 thousand people (or 4.1% of the total population of the Russian Federation) were registered as needing residential premises, compared to 5419.293 thousand people (10.9%) in 2000. The positive dynamics in this issue is obvious. However, the severity of the problem with the availability of housing in the Russian Federation is clearly demonstrated by the low level of availability of living space. On average, there are 26.3 sq. m. per Russian resident (according to data for 2019), with the European norm of 30–40 sq. m. and 100% comfort of housing. At the same time, there are a significant number of regions, where the availability of housing is several times less than the average Russian indicator2. If we take into account that not all housing in Russia is comfortable and has basic amenities in the form of running water, hot water, a bathroom, etc., then the average availability indicator in the country will decrease to 17 sq. m. [3, p. 329]. Currently, almost a third of the population of the Russian Federation (45 mil. people) lives without a full set of basic communal amenities (or without cold water, or hot water, etc.). Approximately 3 million people are still forced to live in communal apartments. 19% of Russian citizens account for less than 9 sq. m. of the total area. For comparison, the provision of comfortable housing per person in the United States is four times higher, and in France it is 2.5 times higher than in Russia. The indicators of housing commissioning in the United States and the Russian Federation differ at the level of two times (not in favor of our country). The urgency of resettling citizens (it is 3.9% in 2020) from emergency housing is still high. Moreover, mortgage loans for solving the housing issue are not available for many people. According to the estimates of DOM.RF, only 37% of families have the opportunity to service a mortgage loan3.
It is obvious that the presented data largely characterize the availability of housing in Russia at an extremely low level, despite the implementation of state programs in the housing sector and some positive changes in this direction.
A number of numerous projects and programs in the field of housing construction are designed to contribute to the formation of an available housing market in Russia: the National Project “Housing and the Urban Environment”, designed for 2018– 2024, the State Program “Providing Available and Comfortable Housing and Communal Services to Citizens of the Russian Federation”, the State Program of preferential lending at 6.5% per annum, the Strategy for developing the housing sector of the Russian Federation for the period through to 2025, and some other documents. The main tasks of state regulation of the housing sector are to create conditions that contribute to ensuring the availability of housing by increasing the use of mortgage instruments, increasing the volume of housing construction, as well as reducing housing that is unsuitable for living, etc.
The implementation of the program of preferential mortgage lending, put into effect by the Government Decree of the Russian Federation in April 20204, coincided with an increase in prices both on average in Russia and in most regions. However, it is unclear, what was the trigger for the rapid price growth? What factors have most influenced the formation of prices in the Russian housing market? In this regard, it is interesting to confirm or deny the existence of a relationship between the increase in prices on the Russian housing market and a decrease in mortgage rates, as well as to explore the prospects for price fluctuations for residential real estate in the medium term. As hypotheses of the study, we consider the following:
H1 – in the primary housing market in Russia in 2020, the determinant of the sharp increase in prices for residential real estate was a decrease in mortgage interest rates which led to the so-called “double boom”;
H2 – high level of prices for primary residential real estate will continue in the medium term including due to the unfavorable factors of the macroeconomic environment.
Theoretical aspects of the research
In the English-language literature, the peak of mentions of the “availability of housing” concept occurred in 1975 (Fig. 1) . The category of “housing” is widespread in the Russian-speaking environment which explains its more active use in the domestic economic literature, especially after the 1990s. The study of the availability of housing in Russia due to limited statistical data is just beginning to gain momentum.
Many fundamental works of foreign scientists are devoted to the study of theoretical and methodological issues of pricing and housing profitability: A. Smith [4, p. 312], D. Ricardo [5, p. 201], A. Marshall [6, p. 135], etc. The problems of the residential real estate market and implementation of housing policy at the regional level are noted in the works of Russian scientists: E.V. Alenicheva, S.V. Kuznetsov, M.G. Shamaeva, T.Y. Ovsyannikova, T.I. Kubasova, O.A. Miroshnikova, B.G. Preobrazhenskii, V.I. Zhilina, V.S. Mkhitaryan, etc. The issues of availability and satisfaction with housing in the context of nonmonetary inequality are presented in the works of L.N. Ovcharova, N.N. Ryabushkin, O.V. Berveno, S.V. Mareeva, etc. The works of I.V. Lipsits, E.I. Lunin, V.M. Tarasevich, G.N. Chubakov are devoted to modeling prices in the housing market. The assessment of the factors influencing the formation of prices for residential real estate is carried out in the studies of V.D. Ardzinov,
Figure 1. Frequency of mentioning the concepts of “availability of housing”, “housing” and “housing inequality” in the English-speaking environment, %
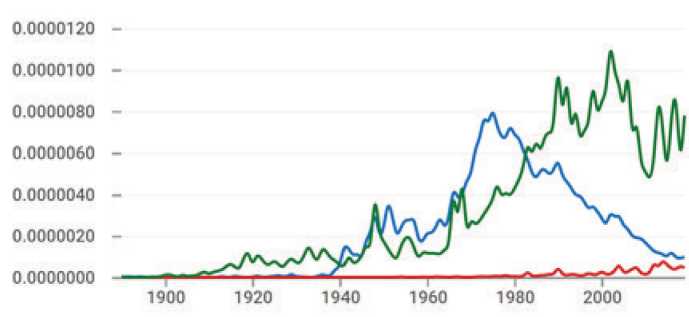
Housing
Availability of housing Housing inequality
Source: according to the data from the Books Ngram Viewer service.
V.I. Koretskii, A.G. Kuzminskii, L.I. Mazurin, and A.M. Reznik. The problems of assessing the impact of mortgage rates on the housing market state have been studied by K.L. Astapov, I.V. Dovdienko, P.N. Kostrikin, E.B. Pokoptseva, etc.
The main macroeconomic factors that determine the formation of prices in the housing market are the level of prices for oil and other export goods, dollar exchange rate, GDP value, inflation, housing commissioning volume, population income, availability of investment areas for investing temporarily available funds, employment level, volume of housing loans issued, etc. Its location, distance to the center of the settlement, total housing area, availability of high-quality water in the area and a number of other parameters affect the price formation of a specific real estate object [7–10].
According to the IMF5, prices for residential real estate are determined by the rent cost for rented housing, the level of population income and the increase in the volume of mortgage lending. The mortgage boom (due to a sharp increase in demand for housing due to low mortgage rates) creates prerequisites for the emergence of a “bubble” in the real estate market which is confirmed by the results of the IMF assessment according to data from 21 out of 23 world countries. The formation of inflated housing prices due to a sharp increase in the population’s demand for the purchase of apartments (houses) leads to a financial crisis. According to calculations, carried out by the IMF specialists, the growth in the volume of loans issued accounts for almost half of the price fluctuations for housing in various countries of the world since 2009. The increased demand for housing due to low mortgage interest rates, creating a “double” boom (housing and mortgage), in many cases ends with a recession of the economy. At the same time, the indicators of economic development after such a crisis period are expected to recover more slowly which is more expensive in terms of lost profits.
The appearance of a “bubble” in the housing market due to the activation of credit policy was first noted by Kinledberger in a monograph in 1978. The scientist showed the role of stimulating monetary policy, as well as economic shocks (the emergence of innovative technologies and markets, changes in legislation) in the process of emerging financial bubbles [11, p. 138]. Currently, a fairly large number of studies have been accumulated in the world, which link the appearance of “bubbles” in the real estate market with credit expansion [12–16]. To date, a small number of works have been noted in domestic science and practice that characterize the likelihood of a “bubble” in the Russian real estate market due to the easing of the mortgage credit policy in the spring of 2020. To a certain extent, our study is designed to fill this gap.
Materials and methods
The researchers use a fairly large arsenal of tools to study factors and develop price forecasts in the residential real estate market [17–22]. This paper presents the results of the application of traditional economic tools and neural network modeling. Working out the factor model is based on the use of multiple regression [22; 23].
As part of the study, we propose the following factors as the main factors influencing the formation of prices in the primary housing market in Russia (Tab. 1).
As a result of applying the stepwise regression method, taking into account F-test and the value of the determination coefficient, there has been obtained an economic and mathematical model of factors affecting the formation of prices in the primary housing market with the following set of independent variables: Y = 11 707.15 – 3 760.4Х1 – – 1053.5Х2 + 803.1Х3 – 78.4Х5 + 0.5Х6. The good quality of the constructed model is confirmed by statistically significant relationships according to the F-test (F-statistics is less than 0.5). The value of the adjusted coefficient (R2adj = 0.95; R2 = 0.98) is the largest in comparison with other regression models.
The identified factors are of particular practical importance, as they act as points of managerial influence; it is especially relevant in modern conditions, as “the time of non-interference in the pricing policy in the housing market has passed”6. On the other hand, the presented model is the
Table 1. Factors of price formation in the primary housing market in the Russian Federation and their dynamics for the period from 2010 to 2020
|
Indicator |
2010 |
2012 |
2014 |
2016 |
2018 |
2020 |
|
Average prices in the primary housing market, rub. (Y) |
48,144 |
48,163 |
51,714 |
53,287 |
61,832 |
79,003 |
|
Average level of the interest rate on a residential mortgage loan, % (Х1) |
13.2 |
12.2 |
12.4 |
12.5 |
9.6 |
7.8 |
|
Average level of the interest rate on deposits with a term of more than a year, % (Х2) |
6.0 |
7.7 |
8.1 |
8.4 |
6.2 |
4.6 |
|
CPI, December in % compared to December of the previous year (Х3) |
108.8 |
106.6 |
111.4 |
105.4 |
104.3 |
104.9 |
|
Producer price index for construction products, % (Х4) |
109.6 |
108.3 |
104.6 |
106.6 |
106.5 |
102.9 |
|
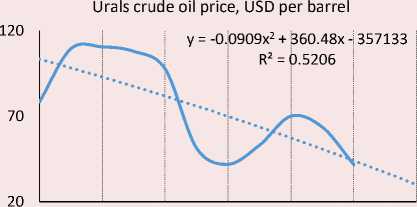
Average price of Urals crude oil, US doll. per barrel (Х5) |
78.2 |
110.5 |
97.6 |
41.9 |
70.0 |
41.7 |
|
Average per capita monetary income, rub. per month (Х6) |
18,958 |
23,221 |
27,412 |
30,865 |
33,178 |
35,361 |
|
Average nominal exchange rate of the US dollar to the ruble for the period, rub. (Х7) |
30.4 |
31.1 |
38.4 |
67.0 |
62.7 |
72.2 |
|
GDP at current prices, trill. rub. (Х8) |
37,687,768 |
49,926,069 |
59,188,270 |
69,237,704 |
84,976,724 |
83,989,295 |
|
Average cost of construction is 1 sq. m. of the total area of residential premises in commissioned residential buildings in RF, rub. (Х9) |
31,877 |
34,354 |
39,447 |
40,890 |
41,358 |
44,518 |
|
Dynamics of commissioning of residential buildings, % to the previous period (Х10) |
97.6 |
105.6 |
119.4 |
94.0 |
95.5 |
100.2 |
|
Source: data of Rosstat, CB RF. |
||||||
6 Speech by Min Zhu, Deputy Managing Director of the IMF at the conference “Housing Markets, Financial Stability and Growth”, India, 2014.
basis for developing forecast values of prices in the housing segment including in the framework of neural network modeling.
The factors of the econometric model became the basis (input data) when making a forecast using neural networks. The combination of traditional statistical tools and neural networks makes it possible to increase the accuracy of forecasts [24, p. 824], as not just a set of variables from tens or hundreds of units is loaded into the network, but a set of variables that have undergone primary statistical processing which are obviously significant factors of housing price growth. In this regard, it takes much less time and epochs (experimental calculations) to train the network.
Artificial neural networks have proven their effectiveness in forecasting macroeconomic processes including in modeling prices on the housing market [25–29]. However, unlike the classical regression forecasting scheme with a clear research algorithm and easy-to-understand stages of its implementation, neural networks are a “black box”. This is an economic and mathematical modeling tool based on the principle of operation of the main biological analogues of artificial neural networks (ANN): neurons (networks of nerve cells of the brain). The formal neuron (Fig. 2) which has a different number of input data (variables) contains an adaptive adder, the output of which is a weighted sum of the inputs S. After comparing the adder with the threshold value of the weight w0 and implementing the activation function of the neuron, we have a signal (Y) at the output, i.e. the output of the neuron or the output of the simulated data.
The neural network modeling algorithm includes a preliminary normalization of input data, in our case – according to the standard formula: Хnorm = (Х – Хmin)/(Хmax – Хmin). As the results of the study have proved, the most optimal structure of a neural network is a multilayer perceptron which consists of 7 inputs, 7 hidden neurons and 1 output (MLP 7-7-1). The activation function of neurons on the hidden layer is the logistic function, on the output layer, it is the sigmoid function. The average error in the forecasts of normalized values was 1.2%, with an error on the test sample of 1.9%. Neural network modeling was carried out in the Statistica program.
The information base of the study is the official information resources of the Federal State Statistics Service of Russia, statistical and analytical publications of the Central Bank of the Russian
Entrances
Figure 2. Formal neuron
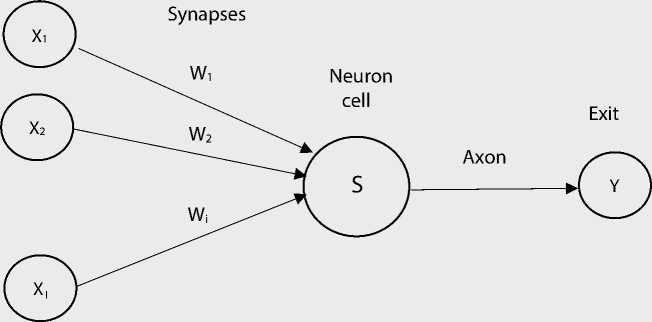
Source: according to [30 , p. 223].
Federation, data from the Unified Information System of Housing Construction of the Ministry of Construction of Russia7.
Discussion on the obtained results and conclusions
In Russia, the situation with the availability of housing has never been easy. According to V.V. Putin, “the housing problem is an eternal problem of Russia”8. This statement is especially true for low-income segments of population. Only representatives of the seventh quintile and above can afford to save money / pay a mortgage loan for the purchase of housing. According to the study [31, p. 66], the population near the poverty line, even after receiving a mortgage loan, which is almost impossible with the existing requirements for the initial payment, will not be able to use it as the time, required for payments, will exceed the average life expectancy. Nevertheless, the trends of recent years (Fig. 3), developing in the area of the range of prices for residential real estate, painted an optimistic picture regarding the value of the indicator “availability of housing” at the average Russian level.
If in 2000 it would have taken about 6 years to buy a standard housing for a family of three with a total area of 54 sq. m (assuming the investment of all the annual income received), by 2019 it will be about half as much – 2.7 years. The secondary market showed a more modest
Figure 3. Availability of housing in RF according to the classical and modified version of calculations for 2000–2020
Number of Rub.
years
^^^ Availability on the primary market, classic variant ^^^ Availability on the primary market, modified variant ^^^ Availability on the secondary market, classic variant ^^^ Availability on the secondary market, modified variant ^^^^^^^^^ Average per capita cash income, rub. per month Average prices on the primary housing market
Average prices on the secondary housing market
Source: according to Rosstat data.
improvement in availability: at the level of 4.3 and 2.5 years, respectively. To some extent, the modified version of the calculation of the availability of housing allows taking into account the current household expenses including the amount of family expenses at the level of the established subsistence minimum for three people. According to the calculations, the availability of new buildings in 2000 at the average Russian level was about 13 years having decreased to 3.9 years by 2019. The dynamics of availability in the secondary market was 9.9 and 3.6 years, respectively.
A slight decrease in the availability of housing was noted in 2007–2008 due to a sharp increase in real estate prices which is associated with the negative consequences of the global economic crisis, a rapid decline in oil prices and an increase in the dollar exchange rate. The population invested money in the housing purchase which provoked a sharp increase in real estate prices. After 2010, prices stabilized; there was a gradual improvement in the situation with the availability of housing purchases until 2019.
Due to the increase in prices after the introduction of the program of preferential mortgage lending in 2020, a decrease in the availability of housing was noted in almost all regions. The best availability level of primary housing in the classical measurement of the indicator by the end of 2020 was observed in Dagestan, the Tyumen Oblast and the Jewish Autonomous Oblast (Tab. 2) . An alarming situation
Table 2. Russian regions with the highest and lowest availability of housing on the primary market*, years
As a result of implementing the State Program “Preferential Mortgage at 6.5% per Annum” in half of the entities of the Russian Federation, the growth rate of mortgage lending in 2020 exceeded the average Russian level9. The other regions showed not so significant, but also positive growth dynamics. A surge in the issuance of loans for 9 months of 2020 compared to the same period of the previous year was noted in fifteen Russian regions: an increase of 44% was recorded in Moscow and the Krasnoyarsk Krai, 41% – in the Republic of Tatarstan, as well as the Sverdlovsk and Nizhny Novgorod Oblasts.
The history of issuing residential housing mortgage lending (HML) in the Russian banking sector began in 1995 [32, p. 136] after the creation of a working group including representatives of the Government of the Russian Federation, the National Association for Mortgage Lending, as well as foreign consultants, and the subsequent approval of the federal target program “Own Home”10. The main goal of this program was to create a two-tier mortgage lending system in Russia, aimed at attracting extra-budgetary funds to improve the living conditions of those in need. This system assumed the functioning of commercial banks for issuing mortgage loans and the “Agency for
Currently, mortgage lending is the main source of growth in the retail loan portfolio of banking institutions. Preferential mortgages are introduced as a measure to “ensure the sanitary and epidemiological well-being of the population”. Conditions of the preferential mortgage program are: citizenship of the Russian Federation, primary housing (under construction or ready for delivery), the maximum loan amount from 6 to 12 million rubles (depending on the region), the rate of 6.5% per annum for the entire loan term, an initial instalment of at least 15% of the cost of the purchased housing, the loan agreement was concluded from April 17, 2020 to July 1, 2021. The loan term is no more than 30 years. The loan is issued in the range of up to 6 million rubles (inclusive) for residential premises located on the territories of the entities of the Russian Federation, except Moscow, the Moscow Oblast, St. Petersburg and the Leningrad Oblast; it is up to 12 million rubles (inclusive) for residential premises located in the territories of Moscow, the Moscow Oblast, St. Petersburg and the Leningrad Oblast12.
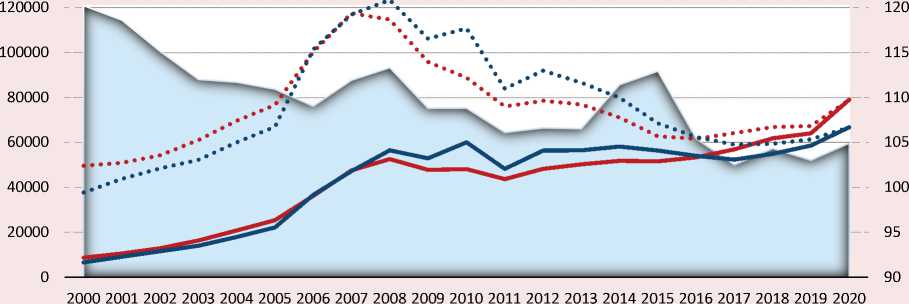
Figure 4. Dynamics of indicators of the mortgage market in the Russian Federation
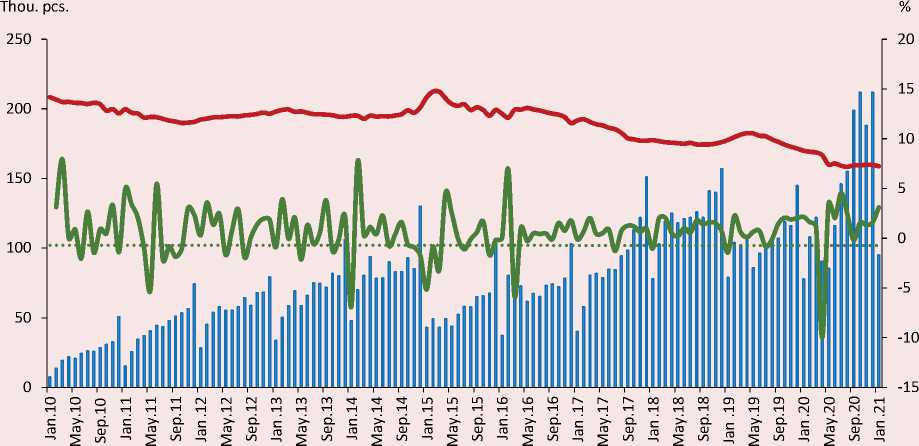
I I Number of issued HML, thou. pcs.
^^^^^^w Weighted average interest rate on HML, %
^^^^^^^^^ Increase in the average amount of HML, %
Logarithmic (increase in the average amount of HML, %
Source: according to the data of CB RF and Unified Information System of the Ministry of Construction of the Russian Federation.
The implementation of the program “Preferential mortgage at 6.5% per annum” led to a decrease in the interest rate on the primary housing market from 8.3 to 5.9% per annum, and on the secondary – from 9.3 to 8% per annum13. In general, in 2020, the Russian banking sector issued 1.7 million mortgage loans worth over 4.3 trillion rubles. Thus, the increase in the volume of mortgage loans in the year of introducing preferential mortgages was about 25%.
The main peak of the HML issuance occurred in the last quarter of 2020. At the same time, if in the 4th quarter of 2010, there were issued 612 thousand mortgage loans for a total of 151 billion rubles
(Fig. 4) , then for the same period of 2020, the number of issued housing and communal services increased almost 5.4 times (1,598 bill. rub.). An increase in the average amount of a mortgage loan was almost doubled: from 1,207 rubles in 2010 to 2,476 rubles in 2020 (at comparable prices by 12%). The term of mortgage loans has also increased: from 16.3 years in 2010 to 18.4 years in 2020. These trends, along with a decrease in the area of apartments under construction, do not indicate in favor of increasing the availability of housing. If the average area of a two-room apartment in the early 2000s was about 55 sq. m., then by the end of the study period, it was about 50 sq.m. Developers during the construction of multi-apartment housing reoriented to more liquid options for sale: studios, one- and two-room apartments of a smaller area.
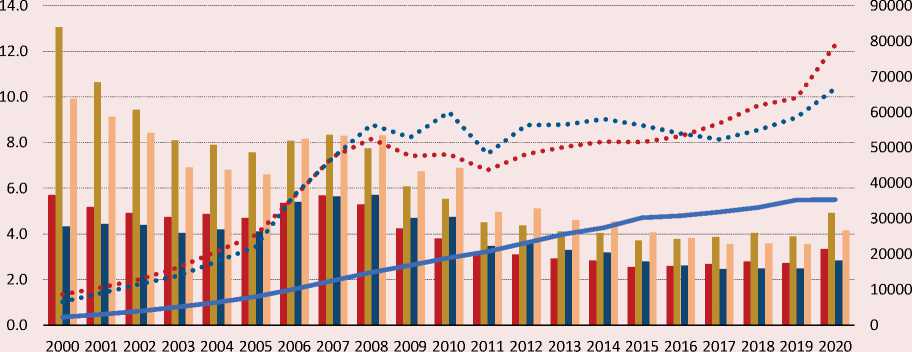
Figure 5. Dynamics of average prices on the primary and secondary housing markets in current and comparable prices, RF
Rub.
%
Consumer price index, %
Average prices in the primary housing market (current prices)
Average prices on the secondary housing market (current prices)
Average prices in the primary housing market (2020 prices)
Average prices in the secondary housing market (2020 prices)
Source: Rosstat data.
According to experts14, those borrowers stood to gain who issued a mortgage loan in the first 3–4 months of the state program of preferential lending, when price fluctuations in the housing market have just begun to move up and have not yet reached a peak. By the end of 2020, the average price per 1 sq. m. in the primary and secondary housing markets (Fig. 5) amounted to 79,003 and 66,712 rubles, respectively, exceeding the prices of the early 2000s by several times. When converted into prices in 2020, it can be seen that prices for new buildings have almost doubled in twenty years (at current prices, it is 9 times), for secondary housing – 1.6 times (or 10 times in the current estimate), with an increase in consumer prices for goods and services over the same period by about 6 times.
The increase in housing prices is noted not only in Russia, but also in other countries. However, if in the EU the price increase for 2010–2019 amounted to about 19%, in the Russian Federation in the primary market for this period, it was 33%, in the secondary market – 37%. According to experts15, the main factors of the rise in the price of residential real estate in Russia after 2018, along with the increase in the cost of housing construction, are the introduction of escrow accounts and a tax on bank deposits which contributed to an increase in investment demand for real estate.
The results of the correlation analysis16 show that one of the main factors that caused the jump in prices on the primary housing market in 2020 was a decrease in mortgage interest. The correlation between the average mortgage interest rate and the value of prices for new buildings is the maximum value at the level of r = -0.90 (Tab. 3) . The highest statistically significant impact on the change in the price of residential real estate was also exerted by average per capita monetary income (r = 0.82), the dollar exchange rate (r = 0.78), the dynamics of GDP
(r = 0.83). Before the introduction of the preferential mortgage program, the key factors of price formation in the primary market were the volume of GDP, average per capita monetary income and the cost of construction of 1 sq. m. of housing. In addition, data are obtained indicating a slight influence of the main macroeconomic factors on prices in the secondary housing market which indirectly indicates a significant impact of the psychological component when setting prices in this market segment.
Table 3. Correlation matrix*
|
Y |
Х 1 |
Х 2 |
Х 3 |
Х 4 |
Х 5 |
Х 6 |
Х 7 |
Х 8 |
Х 9 |
Х10 |
|
|
Y |
1 |
||||||||||
|
Х 1 |
-0.90 |
1 |
|||||||||
|
Х 2 |
-0.51 |
0.72 |
1 |
||||||||
|
Х 3 |
0.44 |
0.66 |
0.60 |
1 |
|||||||
|
Х 4 |
-0.64 |
0.41 |
-0.17 |
-0.01 |
1 |
||||||
|
Х 5 |
-0.64 |
0.39 |
0.03 |
0.21 |
0.46 |
1 |
|||||
|
Х 6 |
0.82 |
-0.69 |
-0.06 |
-0.40 |
-0.76 |
-0.73 |
1 |
||||
|
Х 7 |
0.78 |
-0.60 |
-0.05 |
-0.34 |
-0.60 |
-0.91 |
0.93 |
1 |
|||
|
Х 8 |
0.83 |
-0.76 |
-0.17 |
-0.50 |
-0.66 |
-0.68 |
0.98 |
0.91 |
1 |
||
|
Х 9 |
0.83 |
-0.70 |
-0.09 |
-0.36 |
-0.79 |
-0.73 |
0.98 |
0.91 |
0.95 |
1 |
|
|
Х10 |
-0.21 |
0.15 |
0.16 |
0.36 |
-0.18 |
0.61 |
-0.18 |
-0.45 |
-0.22 |
-0.13 |
1 |
|
* It is based on data for the Russian Federation for 2010–2020. Source: own compilation. |
|||||||||||
Table 4. Distribution of the Russian regions by the strength of the correlation between interest rates on the HML and prices on the primary housing market
|
Territory* |
0.1–0.3 (weak) |
0.3–0.7 (average) |
0.7–1.0 (strong) |
|
Central Federal District |
2(+) |
6(-) |
10(-) |
|
Northwestern Federal District |
2(-), 1(+) |
2(-) |
4(-) |
|
Southern Federal District |
– |
– |
6(-) |
|
North Caucasus Federal District |
1(-) |
3(-), 2(+) |
1(-) |
|
Privolzhsky Federal District |
3(-) |
7(-) |
4(-) |
|
Ural Federal District |
– |
4(-) |
– |
|
Siberian Federal District |
– |
4(-) |
5(-) |
|
Far Eastern Federal District |
– |
3(-) |
7(-) |
|
* Except the Murmansk Oblast, the Republic of Tyva, the Republic of Crimea, Sevastopol, the Chukotka Autonomous Okrug, the Nenets Autonomous Okrug, the Khanty-Mansi Autonomous Okrug – Yugra and the Yamalo-Nenets Autonomous Okrug. Source: according to the data of Rosstat and CB RF. |
|||
16 For correlation analysis and the construction of a factor model, data for the Russian Federation from 2010 to 2020 were used in a quarterly breakdown.
The most significant decrease in the mortgage interest rate had an impact on price growth in the primary segment of the housing market in 37 regions of the Russian Federation (Tab. 4) . At the same time, in the Southern Federal District, a strong correlation is noted in all entities, which is probably due to a good level of the availability of housing (compared to other districts), a significant level of commissioning of residential buildings and a high indicator of migration population growth. In the Central Federal District, the maximum correlation coefficient was recorded in the Tula (-0.89), Bryansk (-0.84) and Moscow (-0.84) Oblasts. The introduction of preferential mortgages did not have a statistically significant impact on prices in the Vladimir Oblast (0.02), the Komi Republic (0.15) and the Tver Oblast (0.23). The average level of positive response of the mortgage rate to price fluctuations was noted in the Republic of Ingushetia and the Kabardino-Balkar Republic, where the cost per square meter is 2–2.5 times lower than the average Russian level. By the value of the price per 1 sq. m. in terms of residential real estate, these entities are at the bottom of the regional Russian rating (76th and 82nd place, respectively).
Determining the nature of demand (investment, natural, deferred, etc.) in each particular region requires additional study of not only statistical information (often not available), but also the results of sociological surveys. However, at this stage of developing the situation in the housing market, it is absolutely necessary to prevent a new round of price growth, and therefore a “smart” and strategically verified approach is necessary. As suggested by the speaker of the Federation Council V.I. Matvienko17, there is a need to introduce a “smart regional mortgage”, aimed at taking into account the socio-economic situation in the regions including in the housing market. The extension of preferential mortgages is not on the entire territory of the Russian Federation, but only in those regions where a sharp jump in prices is not recorded, the Head of the Central Bank of the Russian Federation E. Nabiullina announced in her speech. 24 regions can apply for the continuation of the program of preferential housing lending after July 202018. As the analysis showed, the list includes entities that are characterized by a low increase in housing prices with high rates of its input. Nevertheless, it is questionable whether the Volgograd Oblast is included in the list, where there is a significant increase in residential real estate prices in 2020 (21% compared to 2019), while the Lipetsk Oblast, characterized by high rates of housing construction and low price fluctuations (within 6%) during the period of the preferential mortgage, is not included in it. According to the Chairman of the Central Bank, the list of regions is subject to clarification and further discussion.
According to the characteristics of the methodological approach, described in the previous section of our study, we present the results of price forecasting in the primary housing market of the Russian Federation based on artificial neural networks (Fig. 6) .
Rub.
Figure 6. Results of forecasting prices for primary housing using neural networks
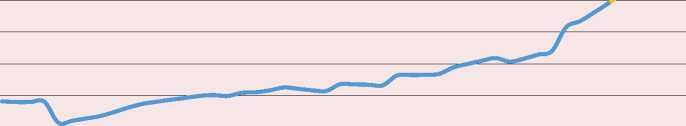
Source: own compilation.
The forecast allows concluding that high prices in the primary housing market will remain in the medium term (in the absence of additional decisions of state authorities and management) which is largely explained by the disappointing trend of retrospective and forecast values of the main macroeconomic indicators (Fig. 7) .
According to Rosstat data, since 2000, the average per capita monetary income of population in current prices has been increasing annually. However, the level of real disposable income of population, having begun to decline since 2013, by the end of 2020 decreased by about 10% in ruble equivalent and by 61% in dollar terms. Over the previous few years, the number of jobs has decreased by 0.5 million units. These trends do not contribute to the expansion of the availability of housing. The rise in the cost of construction work, the need for developers to open escrow accounts are also not in favor of lowering prices and are factors of “no return” to the prices of the previous seasons. Moreover, the lack of GDP growth dynamics against the background of a gradual decline in oil demand in the world (according to World Bank forecasts) creates an additional negative moment in the development of the situation in the country in the medium and long term. In other words, at the moment there are no logical prerequisites for a significant decline in prices in the housing market. We have to state that a “bubble” has not been formed in the housing market; the probability of its deflation is minimal, as prices are not subject to a significant decrease in the near future.
The obtained results do not contradict the opinion of a number of real estate market experts who express the opinion that there are signs of stagnation in the housing market in 2021. Almost half of the surveyed realtors (45%) assumed that the demand for real estate after 2020 will decrease due to rising prices. About 15% of real estate market specialists predict a decline in prices and a further recession in the market. The extension of a preferential mortgage taking into account the presence of deferred demand and a decrease in
Average actual cost of construction of 1 sq. m. of the total area of residential premises, rub.
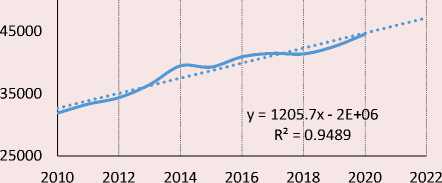
Figure 7. Forecast trends of macroeconomic indicators in RF
Real disposable cash income, % to the previous period
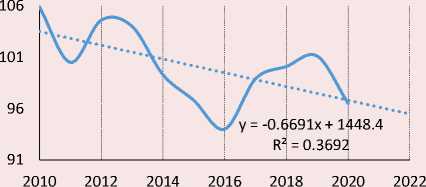
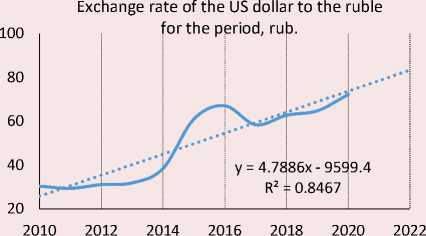
Dynamics of commissioning of residential buildings, % to the previous period
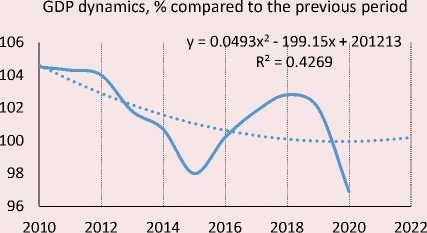
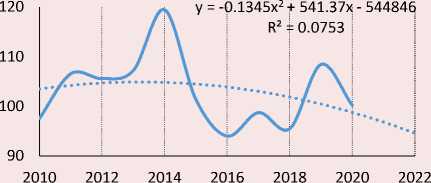
Source: according to Rosstat data.
2010 2012 2014 2016 2018 2020 2022
the volume of supply on the market, according to a third of respondents, will lead to an increase in housing prices from 4–5 to 20%.
Conclusion
The obtained results confirmed the hypotheses that the price jump in the market of new buildings is the result of a “double boom” due to a reduction in the interest rate on the housing market and an increase in demand for real estate. The growth of the scale of the demand market has its limits, especially in the context of increased housing prices. In this regard, the probability of blowing off the “bubble” in the residential real estate market is insignificant. Moreover, in the medium term, price fluctuations are expected to stagnate, confirmed by the results of forecasting using artificial neural networks.
Due to the lack of prospects for the growth of the budget revenue of the Russian population, with high housing prices, citizens postpone the purchase of housing for an indefinite time. As the results of calculations showed, the increase in prices led to a decrease in the availability of housing for the classic version for six months, for the modified version – for almost a year. Given that three years according to the method of the availability of housing is almost 10 years of a mortgage [3, p. 321], it is not difficult to determine what additional period of the unavailability of housing awaits Russian citizens. Moreover, in conditions when the loan period is stretched, and the amount of the initial payment is growing, we should not talk about increasing the availability of housing through a reduction in the rate, but about increasing the degree of population creditworthiness and the appearance of a “mortgage hook” for Russians. Time will tell whether the reduction of the HML rate is a planned step of monetary policy in order to support the Russian banking sector or, as former Prime Minister of the Russian Federation V.S. Chernomyrdin said: “We wanted the best, but it turned out as always”. But now we can say with confidence that the “mortgage hook” and the introduction of escrow accounts are more in the hands of bankers and only partly ordinary citizens in need of housing.
Currently, the solution to the problem of increasing the availability of housing is seen in improving the socio-economic policy in the country in terms of the effective use of natural rent, as Academician D.S. L’viv repeatedly stated back in the late 1990s. The scientist insisted on the impossibility of its concentration in the hands of a certain group of people. In his opinion [33, p. 31], natural rent should work for the benefit of the country’s entire population. This will allow the main part of the received income to be directed to investments and economic development. These actions, along with the simplification of legislation and taxation of small businesses as a source of new jobs, will allow intensifying activities in terms of increasing the income of the population. It is impossible to solve the problem of the availability of housing only with the help of certain macroeconomic factors; therefore, in order to expand the availability and security of housing for Russian citizens, a targeted policy should be pursued in terms of income and wage growth.
The results of the conducted research may be in demand by federal and regional government authorities when working out programs for the development of the housing sector of territories, as well as measures within the framework of social policy aimed at increasing the availability of housing. The methodological tools used can be used by state authorities and private financial companies when conducting their own research on the residential real estate market. In the future, it is possible to study the availability of housing for various income strata of the population including using the results of sociological surveys.
References Mortgage availability vs. availability of housing. We wanted the best, but it turned out...?
- Mareeva S.V. Non-monetary inequalities and their impact on the economic situation of the population. In: Gorshkov M.K., Tikhonova N.E. (Eds.). Rossiiskoe obschestvo i vyzovy vremeni. Kniga 3 [Russian Society and Challenges of the Time. Book Three]. Moscow: Ves Mir, 2016. Pp. 247–265 (in Russian).
- Basova E.A. Theoretical-methodological bases of researching the notion of “non-monetary inequality”. Aktual’nye problemy ekonomiki i prava=Actual Problems of Economics and Law, 2020, vol. 14, no. 3, pp. 415–427. DOI: http://dx.doi.org/10.21202/1993-047X.14.2020.3.415-427 (in Russian).
- Aganbegyan A.G. O prioritetakh sotsial’noi politiki [About Priorities of Social Policy]. Moscow: Izd. Delo, 2020. 512 p.
- Petty V., Smith A., Ricardo D., Keynes J., Freeman M. Klassika ekonomicheskoi mysli: sochineniya [Classics of Economic Thought: Essays]. Moscow: EKSMO-Press, 2000. 896 p.
- Ricardo D. Nachala politicheskoi ekonomii i nalogovogo oblozheniya. Izbrannoe [On the Principles of Political Economy and Taxation. Selected Works]. Moscow: Eksmo, 2007. 960 p.
- Marshall A. Printsipy ekonomicheskoi nauki [Principles of Economics]. Moscow: Progress Publishers, 1993. Vol. 1. 415 p.
- Lin Y. Application of nonparametric regression in house price forecast. Advances in Social Sciences, January, 2020, vol. 09(08), pp. 1123–1131. DOI:10.12677/ASS.2020.98156
- Gao P., Zhang R., Yang X. The application of stock index price prediction with neural network. Mathematical and Computational Applications, 2020, vol. 25(3), pp. 53–69. DOI:10.3390/mca25030053
- Yasnitskii L.N., Yasnitskii V.L. Development and application of the complex neural network model for mass appraisal and forecasting of the urban real estate in the case study of the real estate markets of Yekaterinburg and Perm. Imushchestvennye otnosheniya v Rossiiskoi Federatsii=Property Relations in the Russian Federation, 2017, no. 3, pp. 68–84 (in Russian).
- Yilmaz B., Kestel S. A stochastic approach to model housing markets: The US housing market case. Numerical Algebra, 2018, vol. 8(4), pp. 481–492. DOI:10.3934/naco.2018030
- Netunaev E.B. The effectiveness of monetary policy as a tool to counter financial bubbles. Vestnik Instituta Ekonomiki Rossiyskoy akademii nauk=The Bulletin of the Institute of Economics of the Russian Academy of Sciences, 2018, no. 3, pp. 134–150 (in Russian).
- Glaeser E., Gottlieb J.D., Tobio K. Housing booms and city centers. American Economic Review, 2012, vol. 102(3), pp. 127–133. DOI:10.1257/aer.102.3.127
- Aoki K., Proudman J., Gertjan V. House prices, consumption, and monetary policy: a financial accelerator approach. Journal of Financial Intermediation, 2004, vol. 13, pp. 414–435.
- Glaeser E.L., Gyourko J., Saiz A. Housing supply and housing bubbles. Journal of Urban Economics, 2008, vol. 64, pp. 198–217.
- Caraiani P., Luiky M.-A., Wesselbaumz D. Credit policy and asset price bubbles. Journal of Macroeconomics, 2020, vol. 65, pp. 103–229. DOI:10.1016/j.jmacro.2020.103229
- Dokko J., Doyle B.M., Kiley M.T., Kim J. Monetary policy and the global housing bubble. Economic Policy, 2011, vol. 26(66), pp. 237–287. DOI:10.1111/j.1468-0327.2011.00262.x
- Curry B., Morgan P.Н., Silver M. Neural networks and non-linear statistical methods: An application to the modelling of price-quality relationships. Computers and Operations Research, 2002, vol. 29(8), pp. 951–969. DOI:10.1016/S0305-0548(00)00096-4
- Clapp J. M., Giaccotto C. Evaluating house price forecasts. Journal of Real Estate Research, 2002, vol. 24(1), pp. 1–26.
- Dua P., Miller S., Smyth D. Using leading indicators to forecast U.S. home sales in a Bayesian vector autoregressive framework. Journal of Real Estate Finance and Economics, 1999, no. 18(2), pp. 191–205.
- Maqsood Z., Akhtar R., Latif H. Housing price forecastability by using factor analysis. Pyrex Journal of Business and Finance Management Research, 2019, vol. 5 (3), pp. 25–31.
- Chen H., Wang S., Li Z., Xia J., Wei J. The housing price forecasting model based on improved GM model. Computer Science and Application, 2018, vol. 08(12), pp.1804–1812. DOI:10.12677/CSA.2018.812200
- Daiitbegov D.M. Komp'yuternye tekhnologii analiza dannykh v ekonometrike: monografiya [Computer Technologies of Data Analysis in Econometrics: Monograph]. Moscow: Vuzovskii uchebnik: INFRA-M, 2018. 587 p.
- Mariel P., Hoyos D., Meyerhoff J. Econometric modelling: basics. In: Environmental Valuation with Discrete Choice Experiments, Guidance on Design, Implementation and Data Analysis. 2020. Pp. 61–81. DOI:10.1007/978-3-030-62669-3_5
- Balatsky E.V., Yurevich M.A. Application of neural networks for forecasting inflation: New opportunities. Vestnik URFU=The Bulletin of Ural Federal University. Economics and Management, 2018, no. 5, pp. 823–838 (in Russian).
- Ketova K.V., Vavilova D.D. Neural network forecasting algorithm as a tool for assessing human capital trends of the socio-economic system. Ekonomicheskie i sotsial'nye peremeny: fakty, tendentsii, prognoz=Economic and Social Changes: Facts, Trends, Forecast, 2020, vol. 13, no. 6, pp. 117–133. DOI: 10.15838/esc.2020.6.72.7 (in Russian).
- Serrano W. The random neural network in price predictions. In: Artificial Intelligence Applications and Innovations. 2020. Pp. 303–314. DOI:10.1007/978-3-030-49161-1_26
- Linh M. The hedonic pricing model applied to the housing market. International Journal of Economics and Business Administration, 2020, VIII (Special Issue 1), pp. 416–428. DOI:10.35808/ijeba/526
- Gupta N., Nigam S. Crude oil price prediction using artificial neural network. Procedia Computer Science, 2020, vol. 170, pp. 642–647. DOI:10.1016/j.procs.2020.03.136
- Khalafallah A. Neural network based model for predicting housing market performance. Tsinghua Science & Technology, 2008, no. 13, pp. 325–328. DOI:10.1016/S1007-0214(08)70169-X
- Khaikin S. Neironnye seti: polnyi kurs [Neural Networks: a Full Course]. Moscow: Williams, 2006, 1104 p.
- Kubishin E.S., Sedlov A.P., Soboleva I.V. Poverty in Russia: Measurement methodology and international comparisons. Vestnik Instituta Ekonomiki Rossiyskoy akademii nauk=The Bulletin of the Institute of Economics of the Russian Academy of Sciences, 2021, no. 1, pp. 56–70. DOI: 10.24412/2073-6487-2021-1-56-70 (in Russian).
- Varlamova T.P. Mortgage lending system in Russia: establishment and prospects for development. Vestnik SGSEU=Vestnik of Saratov State Socio-Economic University, 2018, no. 5(74), pp. 136–139 (in Russian).
- L’vov D.S. Russia: The framework of reality and the contours of the future. Ekonomicheskie i sotsial'nye peremeny: fakty, tendentsii, prognoz=Economic and Social Changes: Facts, Trends, Forecast, 2007, no. 37, pp. 27–33 (in Russian).
