Motion-based vehicle speed measurement for intelligent transportation systems

Author: Ali Tourani, Asadollah Shahbahrami, Alireza Akoushideh, Saeed Khazaee, Ching. Y. Suen
Journal: International Journal of Image, Graphics and Signal Processing @ijigsp
Article in issue: 4 vol.11, 2019.
Free access
Video-based vehicle speed measurement systems are known as effective applications for Intelligent Transportation Systems (ITS) due to their great development capabilities and low costs. These systems utilize camera outputs to apply video processing techniques and extract the desired information. This paper presents a new vehicle speed measurement approach based on motion detection. Contrary to feature-based methods that need visual features of the vehicles like license-plate or windshield, the proposed method is able to estimate vehicle’s speed by analyzing its motion parameters inside a pre-defined Region of Interest (ROI) with specified dimensions. This capability provides real-time computing and performs better than feature-based approaches. The proposed method consists of three primary modules including vehicle detection, tracking, and speed measurement. Each moving object is detected as it enters the ROI by the means of Mixture-of-Gaussian background subtraction method. Then by applying morphology transforms, the distinct parts of these objects turn into unified filled shapes and some defined filtration functions leave behind only the objects with the highest possibility of being a vehicle. Detected vehicles are then tracked using blob tracking algorithm and their displacement among sequential frames are calculated for final speed measurement module. The outputs of the system include the vehicle’s image, its corresponding speed, and detection time. Experimental results show that the proposed approach has an acceptable accuracy in comparison with current speed measurement systems.
Speed Measurement, Object Tracking, Video Processing, Intelligent Transportation Systems
Short address: https://sciup.org/15016046
IDR: 15016046 | DOI: 10.5815/ijigsp.2019.04.04
Text of the scientific article Motion-based vehicle speed measurement for intelligent transportation systems
Published Online April 2019 in MECS DOI: 10.5815/ijigsp.2019.04.04
Transportation is very much intertwined with our daily lives and it plays a significant role. As the demands for transportations in metropolitan areas have been increasing, the authorities’ answers could not be limited only to build new infrastructures or widening the existing roads. With the passage of time, it faced many important issues like car accidents, traffic congestions, air pollution and other challenging matters [1]. Therefore, evolution in transportation systems is required to balance the society’s demands and existing transportation sources. This evolution took place by the means of Intelligent Transportation Systems (ITS) [2]. Over the last three decades, the initiation, development, and deployment of ITS services have resulted in higher efficiency and enhanced management of traffic-related problems [3]. ITS applications have the advantage of integrating cutting-edge technologies and communication tools with the facilities of transportation. This benefit makes them strong enough to be used in monitoring traffic flow, violation detection and mobility enhancement purposes [4-5]. Among different approaches of ITS, the VideoBased Intelligent Transportation System (VB-ITS) which executes based on the output of video cameras are more suitable and have the advantages of easy maintenance and high flexibility in traffic monitoring [6]. Therefore, over the past decade, applying video-based systems has been a topic of great interest to researchers that can lead to faster development of transportation planning and traffic engineering applications [7]. Traffic flow control approaches like vehicle count and classification, traffic density estimation and speed measurement are some of the most popular applications of video-based ITS [8]. Among them, vehicle speed measurement is a well-known process to recognize violations in video-based systems.
In the last few years, cameras have become an important part of speed measurement systems. They have the benefits of lower maintenance costs, a wider field of view and providing better documentation proofs [8]. Moreover, considering recent improvements in image/video processing algorithms, there has been a great interest to utilize computer vision techniques to process the images of vehicles captured by these cameras, known as vision-based approaches [10]. Since the speed of a moving vehicle describes how fast it moves in a particular period of time, the distance of movement and elapsed time form the two main parameters to calculate vehicle’s speed. It has to be mentioned that typically there are two types of speeds including average and instantaneous speed. An average speed expresses how much distance a vehicle covers during a certain time span, while the instantaneous speed refers to the exact speed that a vehicle is moving at a given instant in time. In this paper, the term speed refers to instantaneous and not the average speed. In vision-based speed measurement approaches, the time period can be calculated from the video’s frame-rate parameter, known as frames-per-second (fps). By tracking a vehicle in consecutive frames, the number of vehicle’s presence frames is divided by fps to calculate the time period in seconds. In addition, to estimate a vehicle’s movement distance, a pixel-to-meter mapping process is needed that converts a point X in the real 3D world to its corresponding pixel Y in the digital image [17].
Vision-based methods can be divided into singular and monocular vision categories, but they commonly use one camera as the monitoring sensor device [18]. As another classification, generally in vehicle detection applications, there are two main categories including motion-based and feature-based methods [19]. Feature-based approaches try to find some specific visual features of the vehicles like license-plate, rear light or front-hood in each frame and are more common in monocular systems. Although these methods need high computational costs, they mostly provide better accuracies because of dependency to a static feature and higher probability to filter non-vehicle objects [20]. On the other hand, in motion-based methodologies, all moving parts of the scene are detected and considered as a unique moving vehicle. Motionbased approaches are not dependent on visual features but they provide a shorter time and lower computational costs that make them appropriate for real-time systems. To solve the problems related to lack of visual features, these methods should filter non-vehicle objects in ROI by some filtration functions. Although cameras often suffer from some challenging drawbacks like sensitivity to light and weather conditions, these issues can be handled by the deployment of appropriate video processing techniques [16].
In this paper, a robust approach to measure instantaneous speed using vehicle detection and tracking is proposed that can handle the lack of sufficient visual features of vehicles due to low frame-rate data acquisition cameras. This method uses motion information of moving vehicles inside a predefined ROI and filters non-vehicle objects by defining multiple vehicle detection strategies. The vehicles inside the ROI are tracked by a blob tracking method and the number of frames is stored for speed calculation. Our implementation results using real data showed that the proposed method can detect vehicles with high accuracies in most common cases and estimate their speed with 94.83% sensitivity. Additionally, the method can provide speed measurement results with lower processing frames, which makes them appropriate especially in embedded systems with limited sources and real-time applications.
The rest of the paper is organized as follows: previous approaches are presented in Section II and the proposed method to utilize motion information for speed measurement is discussed in Section III. In Section IV, some experimental results to analyze the performance of the proposed method are presented. Finally, a conclusion will be drawn in Section V.
-
II. R elated W orks
The main goal of vehicle detection methods is to separate vehicles from other non-vehicle objects like road surface and pedestrians. Detected vehicles are later tracked for various purposes such as traffic estimation, vehicle count and speed measurement [21]. A fully automated system for traffic surveillance is presented in [22] that take advantage of motion detection and tracking techniques to detect vehicles by utilizing good features to track and Kanade-Lucas-Tomasi (KLT) tracking algorithms. Considering self-calibration advantage, the performance of the system is highly dependent to correct detection of lanes in order to detect and track vehicles. In [23] a 3D tracking method based on the probabilistic inference theory for challenging scenarios is presented that uses background subtraction technique to find moving vehicles’ width and length and then constructs their third dimension by applying a homograph matrix on final blob objects. Here, the possibility of misclassification in detecting a vehicle type through its size can be a challenging issue. Another vehicle detection method based on And-Or-Graph (AOG) was proposed in [24] that tackles the multiscale problem of vehicles in the video scene. This approach detects large-scale vehicles by their visual features and small-scale vehicles by their contours and edges. Additionally, in [25] the same AOG structure for congested traffic conditions is used to detect vehicles by their windscreen as a detection parameter, especially in occluded traffic conditions. Each vehicle node in the graph is mapped into separate parts of the windscreen and Active-Basis Model (ABM). The vehicle node is applied beside a wavelet transform algorithm to match input vehicle parameters. Another approach presented in [26] utilizes regression analysis for detection, classification and counting of vehicles in a video scene that provides the benefit of lower time consumption and calculation due to group tracking of vehicles in congested traffic situations. The main purpose of [24-26] approaches is to introduce a method to work almost well in traffic occlusion situations, while the proposed method tries to waiver this challenge by defining inscribed detection areas for each vehicle. In [27] a new detection and tracking method based on license-plate and tail-light localization for rear-view vehicles by the means of a novel color space and texture model is proposed. Detected vehicles later tracked by Kalman filtration method that is an appropriate technique for low framerate videos. Additionally, in [28] Relative-Discriminative Histogram of Oriented Gradients (RD-HOG) as a complementary module for HOG vehicle detection that concentrates on central block of vehicle region is utilized. Detected vehicles then tracked by particle filter that resulted in lower error-rate in a low-quality video. As it can be seen from the most of the mentioned methods, they focus on detection of vehicles by their visual features, whereas the proposed method employs motion evidence of the vehicles as a detection parameter after applying three filtration functions, which results in filled shapes instead of a vehicle image representation. This can eventuate lower processing time and better performance.
On the other hand, some other studies focused on the speed measurement process using different tracking and mapping methods. A system for speed measurement in the low-light conditions was proposed in [29] that performs detecting and pairing headlights of vehicles. The main challenge of this system is the correct pairing of vehicle’s headlights which is performed by the Normalized Cross-Correlation Method (NCCM) and PinHole techniques. In [30], a simulation model for speed measurement by License-Plate Reading (LPR) and tracking using Elsag O2CR technology for both monocular and binocular systems is introduced that is performed by defining pan, elevation and roll angles of the video camera. Similarly, in [33] a method to measure vehicle speed in stereo-vision systems based on detection of license-plate and the corresponding detection time to calculate vehicle speed is proposed. Optical Character Recognition (OCR) and Convolutional Neural Network (CNN) methods are used in this method to recognize license-plate characters that resulted in less than 3 km/h speed measurement error. In both [30] and [33] approaches, the performance is highly dependent to correct recognition of license plate’s characters and mapping process which can be a challenge in low illumination or quality conditions. As another methodology, [31] introduces a block-based AdaBoost algorithm that is able to calculate vehicle speed even in low-quality videos. The classified objects then segmented into 5×5 blocks and neighbor edges combined using Edge Oriented Histogram (EOH) method. The objects later tracked by Lucas-Kanade (LK) algorithm to measure vehicle speed which resulted in 98.6% detection and 97.7% speed measurement accuracy. The main challenge of this system is high computational costs and processing time. In [32], a motion and text detection method is presented that uses Motion History Image (MHI) and Vertical Projection Profile (VPP) for vehicle detection and segmentation lanes. Each detected vehicle’s license-plate is then detected using Text-HOG descriptor and the detected features are later tracked using LK algorithm. The authors of [32] also provided an available speed measurement dataset which has been used in the proposed method for the experiment, too. Correspondingly, in [34] a gray constraint Optical Flow algorithm and a new three frame differentiation method to detect moving vehicles are presented that takes advantage of Horn and Schunck tracking algorithm. The methods presented in [32] and [34] are more similar to the proposed method which is described in Section3 due to applying motion detection algorithms for speed measurement.
-
III. P roposed M ethod
The presented approach aims to measure the instantaneous speed of vehicles by tracking their motion characteristics in the video output of a stationary camera. Such system targets urban areas due to limited speeds of the vehicles. The proposed method is not dependent on visual features of vehicles like license-plate or tail-light that leads to performing the whole process in a shorter time and without the need for further matching of visual parameters. Detected vehicles across sequential frames are later tracked and their corresponding speeds are calculated by analyzing the number of frames needed for the vehicle to cross a predefined region. As it is demonstrated in Fig.1, the proposed method consists of five sequential steps including pre-processing, vehicle detection, vehicle tracking and speed measurement followed by a violation detection module.
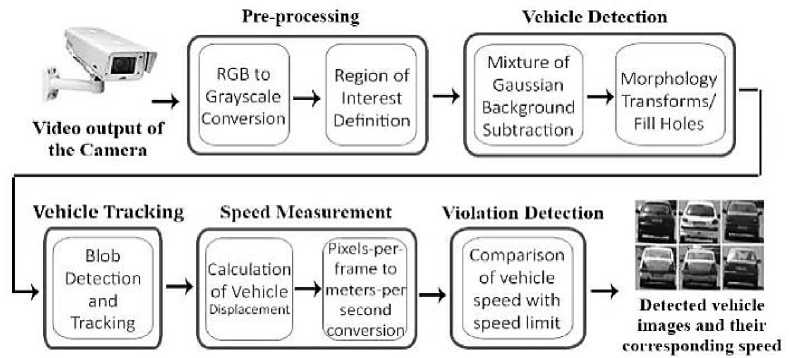
Fig.1. Flowchart of the proposed method.
Some assumptions considered for this system including no sudden changes of illumination and vehicle speed, a fixed camera installed at a high position with the view of the road surface, normal light conditions and predefined region with real known dimensions. The whole process is organized as follows:
-
A. Pre-processing and Calibration
In the first step, some calibration and initiation of variables need to be performed. The conversion of RGB video frames to grayscale mode can reduce processing channels. Furthermore, by defining a Region-of-Interest (ROI) to filter useless parts of the scene –parts that do not affect the final result- the main process executes with a lower computational cost. The ROI should be defined on a road lane with known length and width in a real-world environment. As can be seen in Fig.2, this region should have appropriate size to cover the whole vehicle area, a suitable position to crop the most probable place in which vehicles appear –i.e. lanes- and also the ability to adjust these two factors for configuration and calibration. It has to be mentioned in this manuscript, each ROI is placed in a single road lane.
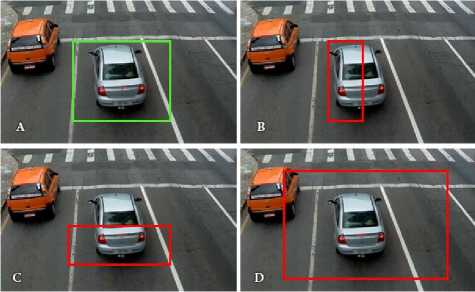
Fig.2. Samples of ROI: A) Acceptable, B) Low width, C) Low length, D) Too wide.
-
B. Vehicle Detection
The second step in the proposed approach is to detect vehicles by their motion history inside the ROI. Background subtraction method is one of the most popular techniques to detect object motions. In this case, each frame compares to a static frame –i.e. background scene- and the difference of frames present in a binary image format [35]. Thus, pixels with different values in comparison to the reference pixel are extracted and considered as moving parts. This method is very sensitive to small changes, where moving leaves of trees or any sudden illumination changes may be considered as motion [36]. Therefore, the reference frame should be updated alternatively to avoid this issue. One of the extensions to the common background subtraction method is Mixture of Gaussian (MOG) background subtraction that is dependent to a combination of frames instead of only one frame [37]. In this method, for each background pixel, a mixture of k Gaussian distribution and a weighting parameter are utilized to save the lifetime of pixels in the scene. Thus, remaining pixels with more than a threshold time in the scene means they have the higher possibility of belonging to the background scene. On the other hand, if the pixel remains unchanged for a period of time, it is considered as a dominant background pixel. The differences between a common background subtraction method and a MOG-BS result is shown in Fig.3.
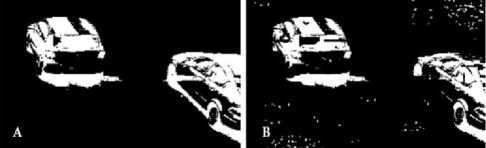
Fig.3. Background subtraction sample outputs: A) Mixture of Gaussian method, B) Common method with a static frame reference.
As it is shown in Fig.3, the overall shape of a moving vehicle in the final binary image is comprised of multiple separate parts due to various illuminations in different frames. In some approaches like Optical Flow, each moving part expresses by motion vectors and finally, a collection of vectors is combined as a single object by similarity analysis [15]. In the proposed method, morphological transformations are utilized to present a single object as the vehicle for detection and tracking process. These transformations are some mathematical operations with two inputs including a binary image and the kernel (structuring element) [14]. Among different morphological transforms, opening and closing functions have been used in this method. Fill-holes or flood-fill method is another operation which fills inside the connected-components of an object by predefined pixels due to their illumination and nearness parameters [13]. In this method, closing, filling the holes and opening operations are used to provide a filled shape representing a vehicle respectively, as it is shown in Fig.4.
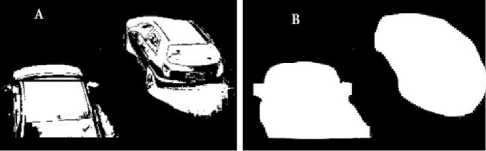
Fig.4. Vehicle detection output: A) After Mixture of Gaussian background subtraction, B) After morphological transforms.
After these operations, each moving object –known as a blob- is referred to a moving vehicle inside ROI region. These blobs are not dependent on visual features of the vehicle and consequently, they can be any other moving objects like pedestrians or animals crossing the streets. To handle this challenge and to filter non-vehicle objects, three sequential filters namely maximum blob, thresholding and trajectory filtrations are used in the proposed method as follows:
-
• Maximum Blob Filtration – This module finds the largest blob inside the ROI that represents a vehicle in the most probable case. In the
calibration step, the ROI is selected in the part of the scene that covers a vehicle area. Therefore, by dismissing smaller blobs, the probability of being a vehicle increases. Fig.5 shows an instance of this module’s effect. As it can be seen, only the vehicles moving inside the current lane which have larger blob area is found and the other vehicle with a partial observable blob is dismissed.
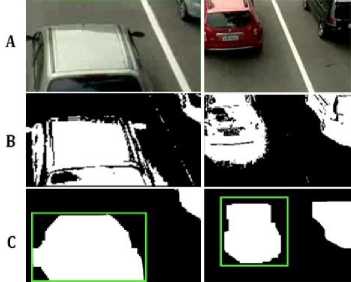
Fig.5. The result of maximum blob filtration: A) Region of Interest, B) Background subtraction result, C) After maximum blob filtration.
-
• Thresholding Filtration – After applying the first filter, some maximum and minimum thresholds should be defined for the system based on a fraction of ROI size. For instance, if the largest found blob is smaller than an ordinary vehicle size or the width to height ratio of the object is smaller than a predefined threshold, these blobs should be dismissed. Thus, by utilizing this filtration method as the second sequential filter, motorcycles and individual pedestrians will be filtered and only blobs with the rational vehicle sizes will remain on the scene for further process. Fig.6 shows the final result of applying this filtration where the motorcycle and pedestrian are dismissed.
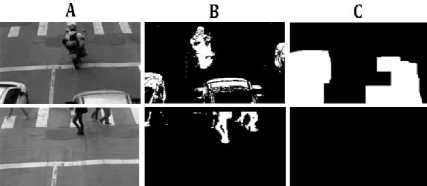
Fig.6. The result of thresholding filtration: A) Region of Interest, B) Background subtraction result, C) After thresholding filtration.
-
• Trajectory Filtration – In some situations like where multiple pedestrians walking beside each other since the emerged blob size is larger than the minimum threshold, it may not be dismissed by the two past filters. For this reason, the trajectory filter considers the corresponding displacement of blobs in sequential frames to waiver non-vehicle objects. Because the pedestrians are commonly walk through crosswalk - which is perpendicular to the roadway- they are recognized as non-vehicle objects. Therefore, the location of each blob is
stored to obtain its trajectory. Fig.7 shows the effect of this filtration step where the emerged blob is not considered as a vehicle due to the unsuitable trajectory.
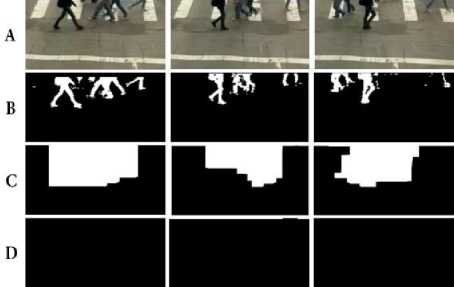
Fig.7. The result of trajectory filtration: A) Region of Interest, B) Background subtraction result, C) After applying maximum blob and thresholding filtrations, D) After applying trajectory filtration.
Finally, only the moving blobs which are highly probable to be a vehicle will be left on the binary frames and send to tracking step for further processes.
-
C. Vehicle Tracking
The output of detection step –i.e. vehicle’s blob inside the ROI- should be tracked in sequential frames to detect motion. Tracking process can be performed using various techniques. In the proposed method, if the vehicle has just entered the ROI, means it has not been tracked yet, it should be labeled by a VehicleID . In addition, a FrameCounter variable to preserve the number of frames refers to vehicle presence inside the ROI is initialized. As long as vehicle blob with the same VehicleID is observable inside the ROI, horizontal centroid of each blob preserves for further tracking process and the displacement of each blob in two sequential frames is calculated in pixels. The amount of displacement is not constant due to capture-related reasons, changes of blob shape over time and the perspective effect of the camera. These important factors should be considered in the format of a calibration parameter to provide true displacement calculation results. For this reason, a regression thresholding parameter pc is utilized that behaves differently in various parts of the ROI. Finally, the average of displacements, dp total , and the count of frames FrameCounter dispatch to speed measurement step. Equation (1) shows the displacement calculation in pixels.
d-Pi = |pOS; - POS/—J X pc (1)
Where dp i is the amount of displacement in frame i in comparison with the previous frame and pc is calibration constant. In addition, pos i and pos i-1 are horizontal blob centroids in frame i and i-1 , respectively. As long as the vehicle lasts inside the ROI, this operation is repeated and by leaving the region, the average of displacements is calculated as it has been shown in Equation (2):
_ Ef+ime^dPi/ Fig.8 and Fig.9 present the tracking algorithm and a dPtotai = 'n (2) common output of this step, respectively. Violet lines in
Fig.9 refers to the horizontal centroid of blobs in each frame.
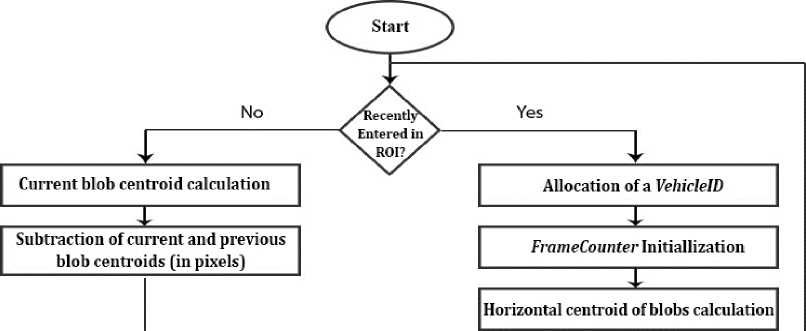
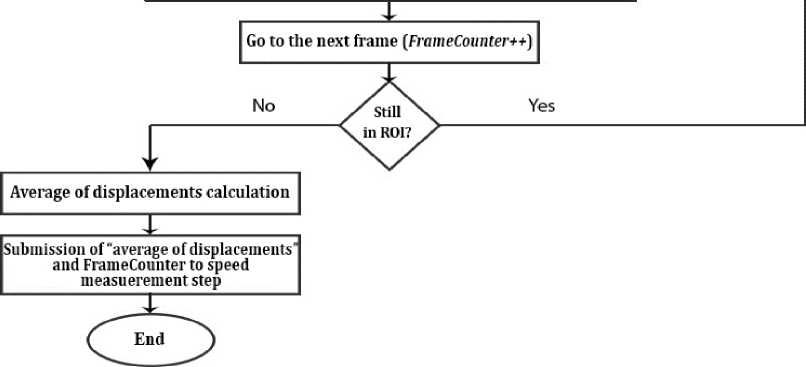
Fig.8. A general block diagram of vehicle tracking algorithm.
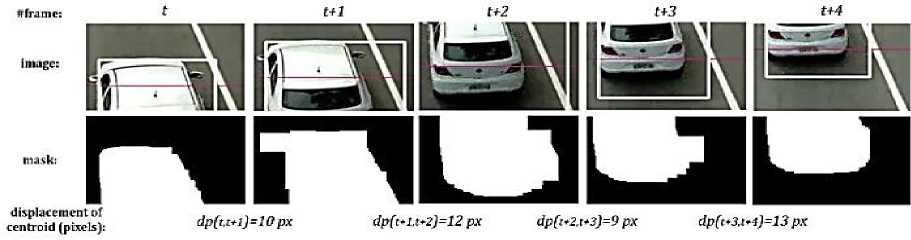
Fig.9. Vehicle tracking output samples in different frames.
-
D. Speed Measurement
In this step, two important parameters including the amount of displacement and elapsed time are needed to calculate the vehicle’s speed. Each displacement vector is a measure of the instantaneous speed in a period of time in pixels. To transform this measure to the real world scale -i.e. km/h- two separate mapping functions for pixels to meters and frames to seconds’ conversion should be defined. Since the size of ROI is known in pixels and the calibration constant pc, pixel density is:
ratio = dp totai /ROIH eight (3)
Where ratio refers to the average area exist in each pixel of ROI in meters. Thus, the displacement is calculated as:
displacement (m) = dptotal x ratio(4)
On the other hand, to calculate time in seconds, time-related parameters including FrameCounter and fps are needed. Therefore, the elapsed time is:
time (s) = Frame_counter/fps(5)
Finally, vehicles speed in km/h is calculated using Equation (6):
Speed (km/h) = (displacement x 3600)/(time x 1000)
The final calculated speed is, in fact, the average of multiple instantaneous speeds of the vehicle inside the ROI. Since the displacement of vehicles inside the ROI is within a few meters, the difference between average and instantaneous speeds is not severe.
-
E. Violation Detection
As there are various speed limitations for different types of roads, the final calculated speed of vehicles should be compared to the legal speed limit. Thus, by detecting a speed violation an image of the vehicle should be captured as evidence in addition to its speed and time of presence in ROI. In metropolitan areas, the speed limit is commonly 50-70 km/h while this limit in highway areas is 90-120 km/h, considering the type and capacity of the road.
-
IV. E xperimental R esults
In this section, the performances of the proposed approach in terms of detection and speed measurement accuracy are presented. The input of the system is video data and the output is a series of vehicle images with their corresponding calculated speed and image acquire time. Some more information like VehicleID and FrameCounter were also stored in an XML file for further analysis. The system was analyzed on a computer with Intel Core 2Duo 2.66 GHz with 4GB of DDR2 RAM. In this regard, provided datasets are discussed in Section IV-A. In Section IV-B, the criteria for vehicle detection and speed measurement purpose are introduced. Additionally, two different examinations have been performed on presented datasets including vehicle detection and speed measurement experiments that are discussed in Sections IV-C and IV-D, respectively. Finally, a comparison with related works is discussed in Section IV-E.
-
A. Datasets
To analyze the performance of the proposed system, three video datasets provided by academic organizations have been utilized. The first one is provided by the Federal University of Technology of Paraná (FUTP) including five H264 videos with different illumination and weather conditions summarized in Table 1 [32]. This dataset is captured by a five-megapixel image sensor with the resolution of 1920×1080 and 30.15 fps. Each video has an associated ground truth value containing vehicle speeds measured by a high precision system based on inductive loop detectors, properly calibrated and approved by the Brazilian national metrology agency (Inmetro). The second dataset is Amirkabir Artificial Intelligence Competitions Urban Highway Traffic dataset (AAIC_UHT) produced by Amirkabir University including twelve MP4 videos of urban traffic with the duration of five minutes and 29 fps with no available vehicle speeds [12]. The main reason for utilizing this dataset is to calculate vehicle detection accuracy of the proposed system. Finally, the third dataset is a real condition video provided by the authors of this work with the contribution of University of Guilan Business Incubator (UGBI) including a thirty-minute grayscale video with the resolution of 1920×1080 and 20 fps [39]. To provide data, a five-megapixel low-cost camera located in the University of Guilan’s campus which captured passing vehicles in daylight conditions. Subsequently, a vehicle with steady speed bypassed several times in the field of view of the camera and its real speed provided by the vehicle’s cruise control system was stored for further experiments. The main reason for utilizing this dataset was to examine the performance of the proposed method with a lower fps real-condition video. Since in lower fps vehicle’s motion looks jagged, the occurred motion blur effect leads to loss of details which can be considered as a challenge for vehicle detection, tracking, and speed measurement modules. Table 1 shows the properties of FUTP and UGBI datasets with their corresponding vehicle speed ranges. Additionally, Fig.10 shows some instance frames of these datasets.
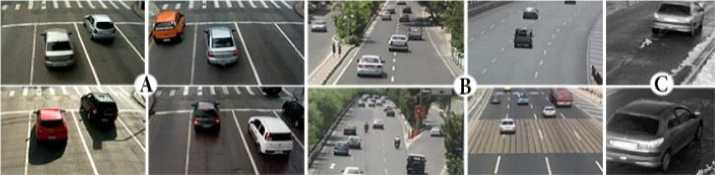
Fig.10. Sample images of the datasets: A) Federal University of Technology of Paraná (FUTP) dataset, B) Amirkabir Artificial Intelligence Competitions Urban Highway Traffic (AAIC_UHT) dataset, C) University of Guilan Business Incubator (UGBI) dataset.
Table 1. properties of datasets with available passing vehicle speeds.
|
Dataset |
File name |
#frames |
#Vehicles |
#Available Vehicle Speed |
||||
|
0 19 |
2039 |
4059 |
6079 |
|||||
|
Set01 |
video01 |
6918 |
119 |
111 |
||||
|
3 |
26 |
82 |
0 |
|||||
|
Set02_ |
video01 |
12053 |
223 |
198 |
||||
|
6 |
43 1 |
147 |
2 |
|||||
|
Federal University of |
Set03_ |
video01 |
24301 |
460 |
418 |
|||
|
Technology of Paraná [32] |
15 |
77 |
320 |
6 |
||||
|
Set04_ |
video01 |
19744 |
349 |
317 |
||||
|
11 |
108 |
195 |
3 |
|||||
|
Set05_ |
video01 |
36254 |
869 |
795 |
||||
|
32 |
256 |
498 |
9 |
|||||
|
University of Guilan |
Video01 |
1152 |
31 |
31 |
||||
|
Business Incubator [39] |
11 |
13 1 |
7 |
0 |
||||
|
Total |
100422 |
2051 |
1870 |
|||||
|
- |
78 |
1255 |
517 |
20 |
||||
-
B. Evaluation Criteria
This section introduces the main criteria for later experiments presented in section IV-C and IV-D. Experiments are analyzed on the basis of three key criteria as follows:
-
• Sensitivity: this factor is a commonly used statistical measure of performance for relevance evaluation which is defined as the fraction of relevant data among the whole retrieved results. Relevant data or correctly classified objects are also known as hit or True-Positive (TP) and FalseNegative (FN) indicates data which are wrongly classified as irrelevant. Consequently, the whole retrieved results are the sum of TP and FN values.
-
• Mean Squared Error (MSE): this factor measures the average of the squares of the errors.
An error is referred to the difference between real and estimated data in experiments.
-
• Variance: this factor is the expectation of the squared deviation of a random variable from its mean.
-
C. Vehicle Detection
The main reason for conducting this experiment was to obtain the performance of the proposed method for vehicle detection presented in Section III-B. Thus, the ROI location was adjusted based on the properties of each dataset for calibration of the system. To perform this experiment, the sensitivity factor defines as the number of correctly detected vehicles by the system among the real number of existed vehicles in the dataset. Table 2 shows the result of vehicle detection analysis.
Table 2. The results of vehicle detection test.
|
Dataset |
File name |
#vehicles in dataset (total) |
#detected vehicles (TP) |
Sensitivity percentage (TP/total) |
|
Federal University of Technology of Paraná [32] |
Set01_video01 |
119 |
114 |
95.79% |
|
Set02_video01 |
223 |
212 |
95.06% |
|
|
Set03_video01 |
460 |
442 |
96.09% |
|
|
Set04_video01 |
349 |
329 |
94.26% |
|
|
Set05_video01 |
869 |
843 |
97.00% |
|
|
Amirkabir Artificial Intelligence Competitions Urban Highway Traffic dataset [12] |
Video1 |
143 |
135 |
94.41% |
|
Video2 |
139 |
97 |
69.78% |
|
|
Video3 |
264 |
233 |
88.25% |
|
|
Video4 |
275 |
251 |
91.27% |
|
|
Video5 |
342 |
224 |
65.49% |
|
|
Video6 |
471 |
461 |
97.87% |
|
|
Video7 |
587 |
569 |
96.93% |
|
|
Video8 |
212 |
198 |
93.39% |
|
|
Video9 |
49 |
48 |
97.95% |
|
|
Video10 |
134 |
127 |
94.77% |
|
|
Video11 |
*** |
*** |
- |
|
|
Video12 |
*** |
*** |
- |
|
|
University of Guilan Business Incubator [39] |
Video01 |
31 |
30 |
96.77% |
*** Inappropriate for detection due to traffic occlusion.
As can be seen in Table 2, the accuracy of the system for vehicle detection is acceptable in most cases. It should be reminded that the proposed method is not dependent on any visual features of vehicles which avoids some misclassification of objects due to the inability of detection features in sequential frames. The main reasons for providing such accuracies for vehicle detection can be summarized as appropriate motion detection and nonvehicle object filtration inside the predefined ROI.
-
D. Speed Measurement
This experiment was performed to calculate the accuracy of the proposed method in speed measurement. It should be noted that both the speed measurement results and real vehicle speeds are stored as floating point numbers and thus, the probability of being equal to each other is extremely low. Consequently, to compare them, an acceptable limit of speeds should be defined which is [-3, +2] km/h in this study according to U.S. standard acceptable limits. So if the subtraction of measured and real speeds is within the limited range, the measured speed is considered as Ideal. Else, it falls into More or Less categories for higher and lower than defined limits, respectively. Table 3 demonstrates the analysis results of speed measurement using the proposed method. Since the real speed of passing vehicles is unavailable in AAIC_UHT dataset, this experiment was performed on FUTP and UGBI datasets only.
Table 3. Speed measurement results using the proposed method in [-3, +2] km/h range.
|
Dataset |
File name |
"3 5 О > |
Measured speed |
м я > 5 О У 2 Й м |
Analytical accuracy |
|||
|
т |
S |
^ C/D |
.5 > |
|||||
|
Federal University of Technology of Paraná [32] |
Set01_video01 |
111 |
2 |
108 |
1 |
97.29% |
+0.07 |
3.72 |
|
Set02_video01 |
198 |
4 |
189 |
5 |
95.45% |
+0.24 |
3.66 |
|
|
Set03_video01 |
418 |
5 |
403 |
10 |
96.41% |
-0.01 |
3.89 |
|
|
Set04_video01 |
317 |
4 |
301 |
12 |
94.95% |
+0.08 |
3.81 |
|
|
Set05_video01 |
795 |
9 |
743 |
43 |
93.45% |
+0.22 |
4.08 |
|
|
Total |
1839 |
24 |
1744 |
71 |
94.83% |
+0.12 |
3.83 |
|
|
University of Guilan Business Incubator [39] |
Video01 |
30 |
1 |
27 |
2 |
90.00% |
+0.45 |
3.01 |
Table 3 shows the speed measurement accuracy in two different statistical criteria including sensitivity and analytical accuracy. Sensitivity is the percentage of Ideal classified data among all available vehicle speeds in the dataset. On the other hand, analytical accuracy contains MSE and variance parameters which are related to the difference between real and calculated results. As it can be seen in Table 3, in case of appropriate illumination and weather conditions, more than 94% of vehicle speeds have been calculated within Ideal limitation by the means of the proposed method on FUTP dataset.
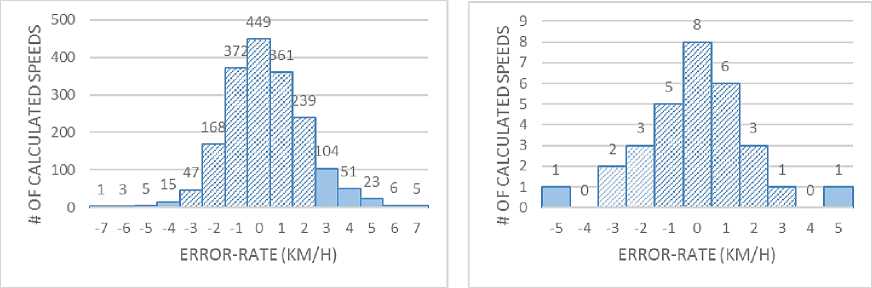
Fig.11. Distribution of speed measurement errors: A) Federal University of Technology of Paraná (FUTP) dataset, B) University of Guilan Business Incubator (UGBI) dataset.
Additionally, Fig.11 shows the distribution of real and calculated speed subtraction errors in km/h. Errors within [-3, +2] km/h is demonstrated with pattern-filled bars.
-
E. Comparison with Related Works
To compare the pros and cons of the proposed method with another speed measurement approach, the system presented in [32] was selected, because it also analyzed the results on FUTP dataset. Experimental results in [32] were also compared with an ideal license-plate detector and a particle filter tracker approach presented in [11]. Table 4 shows the results compared with the mentioned references.
According to Table 4, the final experimental results show that the accuracy of the proposed method is not much different from feature-based and ideal detector approaches. Although the method presented in [32] provided better results compared with an ideal detector, it needs at least 10 frames –from the first detection of license-plate in the scene to the last appearance inside the ROI- to track vehicles which leads to an average of 49.8 milliseconds tracking process per frame. On the other hand, the proposed method needs at least 4 frames for tracking a vehicle, while providing more fps can result in better speed measurement accuracy due to more available displacement samples. Hence, the proposed method needs fewer frames for analysis which provides the advantage of real-time performance.
Table 4. Comparison of different approaches.
|
Approach |
Measured Speed |
||
|
More |
Ideal |
Less |
|
|
Ideal detector |
3.0% |
96.1% |
0.9% |
|
Feature-based approach [32] |
2.8% |
96.0% |
1.1% |
|
Particle filter blob tracking [11] |
57.6% |
22.1% |
20.3% |
|
Proposed method |
3.9% |
94.8% |
1.3% |
Additionally, to analyze the performance of these two methods on real conditions, a set of calculations have been performed with different camera frame-rates. Table 5 shows the maximum number of vehicle appearances inside the ROI in different frame-rates and for various speeds. The least needed appearances for tracking and speed measurement are 4 and 10 times for the proposed and feature-based method presented in [32], respectively. In addition, to satisfy the least number of appearances, the ROI dimensions are set to 5 and 12 meters for the proposed and feature-based method, respectively. Since the proposed method needs a smaller ROI size, the number of vehicle appearances is also less than the other approach. In Table 5, highlighted cells with strikethrough lines refer to inadequate vehicle appearance for speed measurement. As it can be seen, to measure speeds higher than 100 km/h, the camera’s frame-rate should be higher than 30 for both methods.
Table 5. Comparison of the featured-based method and the proposed method based on a maximum number of vehicle appearances in ROI for speed measurement .
Camera’s fps
|
Speed |
50 |
40 |
30 |
20 |
10 |
||||||
|
1 |
i |
Я |
"5 © On © £ |
Я |
"5 © о. о £ |
я |
© © On © £ |
Я |
© © On © £ |
Я |
© £ |
|
20 |
5.56 |
107 |
44 |
86 |
35 |
64 |
26 |
43 |
17 |
21 |
8 |
|
40 |
11.11 |
54 |
22 |
43 |
18 |
32 |
13 |
21 |
9 |
10 |
4 |
|
60 |
16.67 |
35 |
14 |
28 |
11 |
21 |
8 |
14 |
5 |
7 |
2 |
|
80 |
22.22 |
27 |
11 |
21 |
9 |
16 |
6 |
10 |
4 |
5 |
2 |
|
100 |
27.78 |
21 |
8 |
17 |
7 |
12 |
5 |
8 |
3 |
4 |
1 |
|
120 |
33.33 |
18 |
7 |
14 |
6 |
10 |
4 |
7 |
3 |
3 |
1 |
|
150 |
41.67 |
14 |
5 |
11 |
4 |
8 |
3 |
5 |
2 |
2 |
1 |
|
200 |
55.56 |
10 |
4 |
8 |
3 |
6 |
2 |
4 |
1 |
2 |
0 |
|
250 |
69.44 |
8 |
3 |
6 |
2 |
5 |
2 |
3 |
1 |
1 |
0 |
In many video-based speed measurement approaches, detection of vehicles by their visual features leads to acceptable tracking and speed estimations. However, seeking the same features of vehicles in sequential frames is a time-consuming process and consequently may be considered inappropriate for embedded systems and realtime applications. To tackle this challenge, the proposed method utilizes motion detection algorithms inside a predefined ROI instead of visual features which takes lower processing time per frame. Although this method offers applicable detection and speed measurement accuracies and prevents massive processing time, it might fail in segmentation and classification of vehicles, especially in detection and tracking steps. That is because vehicles are only recognizable as filled blob objects and no visual feature is presented. Thus, the reason of some low accuracies in detection experiment presented in Table 2 can be summarized as poor camera quality, camera shakes -especially in AAIC_UHT dataset-, high-density traffic and low camera height in which the vehicles are shown as a unique blob, e.g. video2 of AAIC_UHT dataset. Fig.12 shows some of these challenging scenarios that resulted in system failure in vehicle detection, tracking or speed measurement. To reduce the error rate, the system can be equipped with a model for vehicle detection based on dimensions, ratio and some other comparable properties of common vehicle types. The method also could not be applied during nighttime because subtraction of background scene is a challenging issue in low light conditions. Additionally, the speed measurement module in Set01_video01 provided lower error-rates according to Table 3. The main reason for this sensitivity was the advantage of providing normal light and traffic volume conditions. On the other hand, the system could estimate vehicles with slower speed more accurately due to more vehicle appearances inside the ROI according to Table 5. Thus, it can be noted that the system is mainly designed to detect speed violations in urban areas with no traffic occlusion conditions due to the lower speed of vehicles.
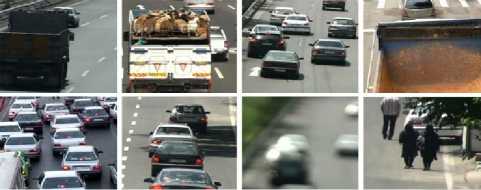
Fig.12. Some challenging scenarios for vehicle detection and speed measurement.
Nowadays, the most established sensing solutions have become available for speed limit enforcement, e.g. millimeter-wave radar and Lidar technologies [10]. Both instruments have the advantage of high accuracy and reliability which makes them appropriate tools for vehicle speed measurement. Nevertheless, since these instruments do not have the ability to provide legal documentation for authorities, they are frequently integrated with some image capturing units like high-resolution cameras [38]. Although it is known as an appropriate solution, synchronization of camera and speed measurement device is a challenging issue. Thus, providing a video-based speed measurement application like the proposed method with appropriate accuracy can be considered as a great alternative due to lower cost and better expandability in comparison with radar and Lidar systems.
-
V. C onclusions
This paper proposes a video-based vehicle speed measurement system for traffic applications as a part of intelligent transportation systems. The suggested approach works on the output videos of road cameras and produces detected vehicle images, their estimated speed, and detection time. This method is based on motion detection algorithms and contains three sequential components, viz. vehicle detection, tracking, and speed measurement. In the detection step, Mixture-of-Gaussian background subtraction method and morphology transforms are utilized. Detected objects are then tracked using blob tracking algorithm and their displacement in comparison with the previous frame. The average displacements inside the region of interest were used for speed measurement. In addition, the proposed method is not dependent on the visual features of vehicles and detects them inside a predefined region by analyzing their motion parameters. To analyze the method, it was tested on two different real datasets and the final results validated the accuracy of more than 94% for vehicle detection and 94.8% for speed measurement.
References Motion-based vehicle speed measurement for intelligent transportation systems
- S.A. Shaheen and R. Finson, “Intelligent Transportation Systems,” Reference Module in Earth Systems and Environmental Sciences, Elsevier Encyclopedia of Energy, 2013.
- A. Auer, S. Feese and S. Lockwood, “History of Intelligent Transportation Systems”, U.S. Department of Transportation, Report No. FHWA-JPO-16-329, 2016. See https://www.its.dot.gov/index.htm. Retrieved 7 June 2018.
- G. Aifadopoulou, E. Mitsakis and P. Iordanopoulos, “Intelligent Transportation Systems in South-East Europe,” South East Europe Intelligent Transportation Systems (SEE-ITS) Project Report, 2014.
- F. Zhu, Z. Li, S. Chen and G. Xiong, “Parallel Transportation Management and Control System and its Applications in Building Smart Cities,” IEEE Transactions on Intelligent Transportation Systems, vol. 17, no. 6, pp. 1576-1585, 2016.
- F.Y. Wang, “Parallel Control and Management for Intelligent Transportation Systems: Concepts, Architectures, and Applications,” IEEE Transactions on Intelligent Transportation Systems, vol. 11, no. 3, pp. 630-638, 2010.
- V. Kastrinaki, M. Zervakis and K. Kalaitzakis, “A Survey of Video Processing Techniques for Traffic Applications,” Image and Vision Computing, vol. 21, pp. 359-381, 2003.
- J. Zhang, F.Y. Wang, K. Wang, W.H. Lin, X. Xu and C. Chen, “Data-Driven Intelligent Transportation Systems: A Survey,” IEEE Transactions on Intelligent Transportation Systems, vol. 12, no. 4, pp. 1624-1639, 2011.
- M. Bommes, A. Fazekas, T. Volkenhoff and M. Oeser, “Video Based Intelligent Transportation Systems – State of the Art and Future Development,” Transportation Research Procedia, vol. 14, pp. 4495-4504, 2016.
- S. Lefèvre, C. Sun, R. Bajcsy and C. Laugier, “Comparison of Parametric and Non-Parametric Approaches for Vehicle Speed Prediction,” American Control Conference, Portland, pp. 3494-3499, 2014.
- M.A. Adnan, N. Sulaiman, N.I. Zainuddin and T.B.H.T. Besar, “Vehicle Speed Measurement Technique using Various Speed Detection Instrumentation,” IEEE Business Engineering and Industrial Applications Colloquium, Langkawi, pp. 668-672, 2013.
- P. Pérez, C. Hue, J. Vermaak and M. Gangnet, “Color-based Probabilistic Tracking,” 7th European Conference on Computer Vision, London, pp. 661-675, 2002.
- Amirkabir Artificial Intelligence Competitions Urban Highway Traffic dataset (AAIC_UHT). See link: http://www.aaic.ir. Retrieved 11 March 2018.
- D. Doria and R.J. Radke, “Filling Large Holes in LiDAR Data by Inpainting Depth Gradients,” IEEE Computer Society Conference on Computer Vision and Pattern Recognition Workshops, Providence, pp. 65-72, 2012.
- Pierre Soille, “Morphological Image Analysis: Principles and Applications,” Springer Science & Business Media, ISBN: 3662039397, 2013.
- L. Xu, J. Jia and Y. Matsushita, “Motion Detail Preserving Optical Flow Estimation,” IEEE Transactions on Pattern Analysis and Machine Intelligence, vol. 34, no. 9, pp. 1744-1757, 2012.
- M. Goldhammer, S. Köhler, K. Doll and B. Sick, “Camera based Pedestrian Path Prediction by Means of Polynomial Least-Squares Approximation and Multilayer Perceptron Neural Networks,” 3rd Science and Information Conference, London, pp. 390-399, 2015.
- H. Eslami, A. Raie and K. Faez, “Precise Vehicle Speed Measurement for Law Enforcement Applications based on Calibrated Camera with Parallel Standard Patterns,” IET Computer Vision, vol. 10, no. 5, pp. 398 –406, 2016.
- S. Sivaraman and M. M. Trivedi, “Looking at Vehicles on the Road: A Survey of Vision-Based Vehicle Detection, Tracking and Behavior Analysis,” IEEE Transactions on Intelligent Transportation Systems, vol. 14, no. 4, pp. 1773-1795, 2013.
- A. Mukhtar, L. Xia and T. B. Tang, “Vehicle Detection Techniques for Collision Avoidance Systems: A Review,” IEEE Transactions on Intelligent Transportation Systems, vol. 16, no. 5, pp. 2318-2338, 2015.
- R.A. Hadi, G. Sulong and L.E. George, “Vehicle Detection and Tracking Techniques: A Concise Review,” International Journal of Signal & Image Processing, vol. 5, no. 1, pp. 1-12, 2014.
- N. Buch, S.A. Velastin and J. Orwell, “A Review of Computer Vision Techniques for the Analysis of Urban Traffic,” IEEE Transactions on Intelligent Transportation Systems, vol. 12, no. 3, pp. 920-939, 2011.
- J. Sochor, “Fully Automated Real-Time Vehicles Detection and Tracking with Lanes Analysis,” 18th Central European Seminar on Computer Graphics, Smolenice, pp. 59-66, 2014.
- M. Nieto, L. Unzueta, J. Barandiaran, A. Cortés, O. Otaegui and P. Sanchez, “Vehicle Tracking and Classification in Challenging Scenarios via Slice Sampling,” The European Association for Signal Processing Journal on Advances in Signal Processing, vol. 11, no. 1, pp. 95-112, 2011.
- Y. Li, M.J. Er and D. Shen, “A Novel Approach for Vehicle Detection using an AND–OR-Graph-Based Multiscale Model,” IEEE Transactions on Intelligent Transportation Systems, vol. 16, no. 4, pp. 2284-2289, 2015.
- Y. Li, B. Li, B. Tian and Q. Yao, “Vehicle Detection based on the AND–OR Graph for Congested Traffic Conditions," IEEE Transactions on Intelligent Transportation Systems, vol. 14, no. 2, pp. 984-993, 2013.
- M. Liang, X. Huang, C.H. Chen, X. Chen and A. Tokuta, “Counting and Classification of Highway Vehicles by Regression Analysis,” IEEE Transactions on Intelligent Transportation Systems, vol. 16, no. 5, pp. 2878-2888, 2015.
- B. Tian, Y. Li, B. Li and D. Wen, “Rear-View Vehicle Detection and Tracking by Combining Multiple Parts for Complex Urban Surveillance,” IEEE Transactions on Intelligent Transportation Systems, vol. 15, no. 2, pp. 597-606, 2014.
- B.F. Wu, C.C. Kao, C.L. Jen, Y.F. Li, Y.H. Chen and J.H. Juang, “A Relative-Discriminative-Histogram-of-Oriented-Gradients based Particle Filter Approach to Vehicle Occlusion Handling and Tracking,” IEEE Transactions on Industrial Electronics, vol. 61, no. 8, pp. 4228-4237, 2014.
- I. Sina, A. Wibisono, A. Nurhadiyatna, B. Hardjono, W. Jatmiko and P. Mursanto, “Vehicle Counting and Speed Measurement using Headlight Detection,” International Conference on Advanced Computer Science and Information Systems, Bali, pp. 149-154, 2013.
- G. Garibotto, P. Castello, E. Del Ninno, P. Pedrazzi and G. Zan, “Speed-Vision: Speed Measurement by License Plate Reading and Tracking,” IEEE Intelligent Transportation Systems Conference, Oakland, pp. 585-590, 2001.
- B. Alefs and D. Schreiber, “Accurate Speed Measurement from Vehicle Trajectories using AdaBoost Detection and Robust Template Tracking,” IEEE Intelligent Transportation Systems Conference, Seattle, pp. 405-412, 2007.
- D.C. Luvizon, B.T. Nassu and R. Minetto, “A Video-Based System for Vehicle Speed Measurement in Urban Roadways,” IEEE Transactions on Intelligent Transportation Systems, vol. 18, no. 6, pp. 1393-1404, 2017.
- D.F. Llorca, C. Salinas, M. Jimenez, I. Parra, A.G. Morcillo, R. Izquierdo, J. Lorenzo and M.A. Sotelo, “Two-camera based Accurate Vehicle Speed Measurement using Average Speed at a Fixed Point,” 19th IEEE International Conference on Intelligent Transportation Systems, Rio de Janeiro, pp. 2533-2538, 2016.
- J. Lan, J. Li, G. Hu, B. Ran and L. Wang, “Vehicle Speed Measurement based on Gray Constraint Optical Flow Algorithm,” International Journal for Light and Electron Optics, vol. 125, no. 1, pp. 289-295, 2014.
- M. Piccardi, “Background Subtraction Techniques: A Review,” IEEE International Conference on Systems, Man and Cybernetics, vol.4, pp. 3099-3104, 2004.
- B. Tian, Q. Yao, Y. Gu, K. Wang and Y. Li, “Video Processing Techniques for Traffic Flow Monitoring: A Survey,” 14th IEEE International Conference on Intelligent Transportation Systems, Washington DC, pp. 1103-1108, 2011.
- P. KaewTraKulPong and R. Bowden, “An Improved Adaptive Background Mixture Model for Real-time Tracking with Shadow Detection,” 2nd European Workshop on Advanced Video-based Surveillance Systems, Genova, 2002.
- A. Nurhadiyatna, B. Hardjono, A. Wibisono, W. Jatmiko and P. Mursanto, "ITS Information Source: Vehicle Speed Measurement Using Camera as Sensor," International Conference on Advanced Computer Science and Information Systems, Depok, pp. 179-184, 2012.
- University of Guilan Business Incubator Website: http://roshd.arshiaweb.ir/. Retrieved 5 July 2018.
- MECS Journal
- Home Latest News & Events Aims and Scope Submit a Paper Author Guidelines Editorial Board Review Process E-Mail Alert Become a Member Indexing Service Publication Charge Recommend to Library Best Paper Awards Terms & Conditions Special Issues Publication Ethics and Malpractice Statement
