MPPT for hybrid wind, solar and thermoelectric power generation systems for off-grid applications

Author: Qasim M.A., Velkin V.I., Alwan N.T., Praveenkumar S.
Journal: Вестник Южно-Уральского государственного университета. Серия: Энергетика @vestnik-susu-power
Section: Электроэнергетика
Article in issue: 2 т.22, 2022.
Free access
Renewable energy resources for electrical generation are normally free but are not continuously available due to their sporadic availability. Thus, hybrid connections of various kinds of energy are made to increase utilization of renew-able energy. This paper involves a design of a hybrid renewable energy system employing maximum power point tracking (MPPT) techniques. The hybrid system consists of solar PV panels, a small-scale wind turbine, and a thermoelectric generator (TEG) module. Four MPPT techniques are examined in this research. They are the incremental conductance (IC) algorithm, fuzzy logic controllers (FLC) using 25 and 35 rules, and an interval type 2 fuzzy logic con-troller (IT2FLC). Each MPPT technique is tested in the system to determine which has the best maximum power tracking, stable operation, and efficiency. All of the studied energy resources are connected to a DC linked bus. The voltage of this bus is supplied to a three-phase inverter. Inverter output voltage is regulated for balanced and unbalanced loads. The generating capacity of the designed hybrid system is 5 kW and the system is simulated using MATLAB Simulink R2017a.
Fuzzy logic, hybrid, thermoelectric, renewable energy
Short address: https://sciup.org/147237785
IDR: 147237785 | UDC: 621.362, | DOI: 10.14529/power220206
Отслеживание точки максимальной мощности для гибридных ветровых, солнечных и термоэлектрических систем выработки электроэнергии для автономных применений
Возобновляемые источники энергии для производства электроэнергии, как правило, бесплатны, но не доступны постоянно из-за их спорадической доступности. Таким образом, для увеличения использования возобновляемых источников энергии используются гибридные соединения различных видов энергии. В этой статье рассматривается проектирование гибридной системы возобновляемых источников энергии, использующей методы отслеживания точки максимальной мощности (MPPT). Гибридная система состоит из солнечных фотоэлектрических панелей, небольшой ветряной турбины и модуля термоэлектрического генератора (ТЭГ). В этом исследовании рассматриваются четыре метода MPPT. Это алгоритм инкрементной проводимости (IC), контроллеры нечеткой логики (FLC), использующие правила 25 и 35, и контроллер нечеткой логики интервального типа 2 (IT2FLC). Каждый метод MPPT тестируется в системе, чтобы определить, какой из них обеспечивает наилучшее отслеживание максимальной мощности, стабильную работу и эффективность. Все исследуемые энергоресурсы подключены к шине постоянного тока. Напряжение этой шины подается на трехфазный инвертор. Выходное напряжение инвертора регулируется для сбалансированных и несбалансированных нагрузок. Генерирующая мощность спроектированной гибридной системы составляет 5 кВт, и система моделируется с использованием MATLAB Simulink R2017a.
Text of the scientific article MPPT for hybrid wind, solar and thermoelectric power generation systems for off-grid applications
of the TEGs to increase the temperature difference between their two surfaces, thus, generating more electrical power. Also, TEGs use the buoyancy effect to increase the wind stream speed, thus enhancing the power generated from the wind turbine. Dufo-Lopez et al. [11] did an optimization of an off-grid electrical supply system using renewable hybrid systems that consisted of photovoltaic, wind, battery, fossil fuel, and TEGs. Additional auxiliary components such as charge controllers and an inverter were employed. The heat source was the exhaust heat of a gas stove used for heating or cooking. The objective of their research was to minimize net cost. Optimization was done using a genetic algorithm. It was conducted in two phases, considering low consumption off-grid households in Cambodia and Norway.
In this paper, the design of a 5-kW hybrid system of PV solar panels, wind turbine, and TEG system was carried out with an investigation of multiple MPPT techniques. Also, a controller for a three-phase inverter was designed to supply the loads in off-grid applications with a constant voltage for balanced or unbalanced loads. The paper is organized as follows. First, an introduction of the proposed hybrid renewable energy system is presented. This is followed by discussion of power electronics circuits for MPPT operation, and maximum power point tracking (MPPT) techniques. Simulation results of the system are given and discussed. Finally, conclusions are presented.
The proposed hybrid renewable energy system
The hybrid system in the current study used three energy sources. They are photovoltaic (PV) panels, a thermoelectric generator (TEG) module, and a smallscale wind turbine. A brief description of each device is presented below. The system is schematically show as a block diagram in Fig. 1.
PV panels
Each PV panel is fabricated of small cells made from semiconductor materials designed to convert solar energy into electricity. Each panel contains many cells connected in series and parallel to reach the designed voltage level, either 12 or 24 V [12]. Cells convert solar energy into electrical energy as described by Equation (1) [13]:
P P v = A P v I s n P v , (1)
where AP the area of the PV cell in m 2 , nP is the P v P v
PV cell efficiency, and Is is the solar irradiation in W/m2. Each panel is manufactured to achieve a desired power level. In order to increase power and voltage, the PV panels are connected in series, parallel, or a combination of both. The environmental conditions that affect PV panel operation are the amount of solar irradiation received and PV panel temperature. With any change in these quantities, the generated voltage and power from the PV panels will vary in proportion to the solar irradiation and inversely to temperature [14–15]. The power and voltage should be measured using a suitable technique or algorithm and regulated using a DC/DC converter to control the flow of electrical energy with the maximum possible energy harvest [16].
TEG module
A thermoelectric generator (TEG) module is normally built from many P-type and N-type semiconductors mounted on opposing surfaces of the TEG. When a temperature difference is applied, charge carriers defuse from the high temperature side ( Th ) to the low temperature side ( Tc ). This results in a flow of
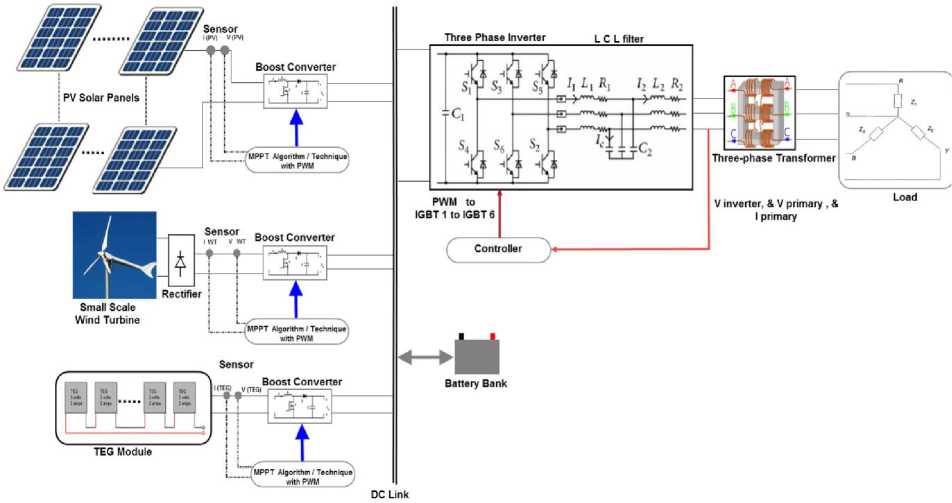
Fig. 1. Hybrid system consisting of solar PV panels, a wind turbine, TEG module with their maximum power point tracking and load AC side requirements
electrical current [17]. The output voltage of a single TEG is estimated using Equation (2):
Voc = аЛ Т , (2) where Voc is the open circuit voltage at the TEG terminals, a is the Seebeck effect coefficient (V/K), and A T is the temperature difference between T h and Tc [18]. The load voltage is determined by:
V teg =аЛ T - R^ I , (3) where R int is the TEG internal resistance and I is load current [19]. In the present study, the TEG module is fabricated using numerous TEGs connected in series or parallel to provide the required voltage and power. It should be taken into consideration that the surface temperatures of the hot and cold sides of the module ensure electrical current flow where one surface is heated while the other is cooled [20].
Small scale wind turbine
A small-scale wind turbine generally consists of several components. The first is a rotor with three to five blades to convert the energy of a wind stream into mechanical power. An electric generator, normally a permanent magnet synchronous generator (PMSG), is employed with protection and control equipment. Electronic components are necessary for power conditioning and feeding the produced electricity into a direct load or DC link [3, 21]. The converted power, from wind into electrical power through a wind turbine, is given by Equation (4) [22]:
P = 1 pn R 2 C p V 3 , (4) where p is the air density (1.225 kg/m3). R represents the radius of the rotor in meters (m), CP is the wind generator power coefficient, and V is the wind speed in m/s. Normally, the electricity generated from this kind of wind turbine has a three-phase voltage of variable frequency and amplitude. This voltage is rectified as a DC voltage and supplied at DC/DC converter terminals. The converter is used for power and voltage regulation as previously discussed.
Power electronics circuits for MPPT operation
Power can be delivered from each source to the load by the two types of power electronic circuits, as discussed below.
DC/DC boost converter
A DC/DC boost converter was used with an output voltage that is higher than its input voltage. It consists of an inductor, a switch that is nominally an IGBT or MOSFET, a diode, and a capacitor at its output terminals. When the switch is ON, the inductor works as an energy saving element to store electrical energy. When the switch is OFF, the inductor releases this energy as a current flowing to the load. Thus, at this state, the output voltage equals the sum of inductor and the input side voltages. The diode maintains forward feed to the load. The role of the capacitor is as a filter of the output DC voltage. For a loss-less system, the output voltage is determined using Equation (5) [23]:
Vo = —— Vi , (5)
1 - D where D represents the duty cycle. The duty cycle is defined as the ratio between the period when the switch is at ON state (TON) to the overall switching period (TON + TOFF). An MPPT technique is used to modify the D value to control the power and voltage that is supplied to the load or DC bus [24].
Inverters
An inverter is a DC/AC converter. If the power of the system is less than 3 kW, a single-phase inverter can be used. For higher power levels, a three-phase inverter should be employed [25]. In the current work, a three-phase inverter is utilized. It has three legs and each leg employs two switches. Thus, there are a total of six switches. The upper switches are used to handle voltages with positive polarity while the lower switches handle those of negative polarity [26]. Each phase should be shifted by 120° from the other phases. The instantaneous phase voltages for ( Y connected load) are determined by:
CO Л\
E4V . (nП \, s sin — sin(ncot);(6)
n=H3nкV
CO
VN = E n = 1
4V . (nnA . (, s sin — sin n I tot
3n n n V 3 JV
CO л Л \Z
E4V • (nnb (,
—=— sin — sin n I tot n=1^ n П V 3 JV
2n\ "3" J ;
4 nA J ,
where n = 1, 7, 13, 19, and so on. Vs is the DC bus voltage. At this stage, the output voltage is quasisquare for each phase. To reduce the harmonics of the output voltage, one of several modulation techniques and filter types should be embedded and make the output AC voltage for each phase more nearly a sine wave [27, 28].
Maximum Power Point Tracking (MPPT) techniques
MPPT techniques are methods to operate renewable energy systems at the maximum power point (MPP) of its power-voltage (PV) curve. The MPP of each source varies according to the environmental and operating conditions. In the current work, four MPPT technique were used and are discussed below.
Incremental Conductance (IC) algorithm
This algorithm is based on the observation that at the maximum power point (MPP), the slope of the curve (AP/A V) is zero. To the right of this point, the MPP slope is negative, while it is positive on the left. From these conditions, the MPP can be determined in terms of the incremental change in the conductance array [29]. In differential form, this is [30]:
dp d (v .i).
— = ——- = i + v— = 0;
dv dvdv
Л i i , x Л i i — = (a), — > - Л v v Л v v
(b), ^i < - (c),(10)
Л vv where (10a) is the condition at the MPP, (10b) is the condition to the left of the MPP, and (10c) is the condition to the right of the MPP. The result of this algorithm is used to modulate a signal to select the required pulse for the IGBT switch of the boost converter.
Fuzzy Logic Controller (FLC) by 25 rules
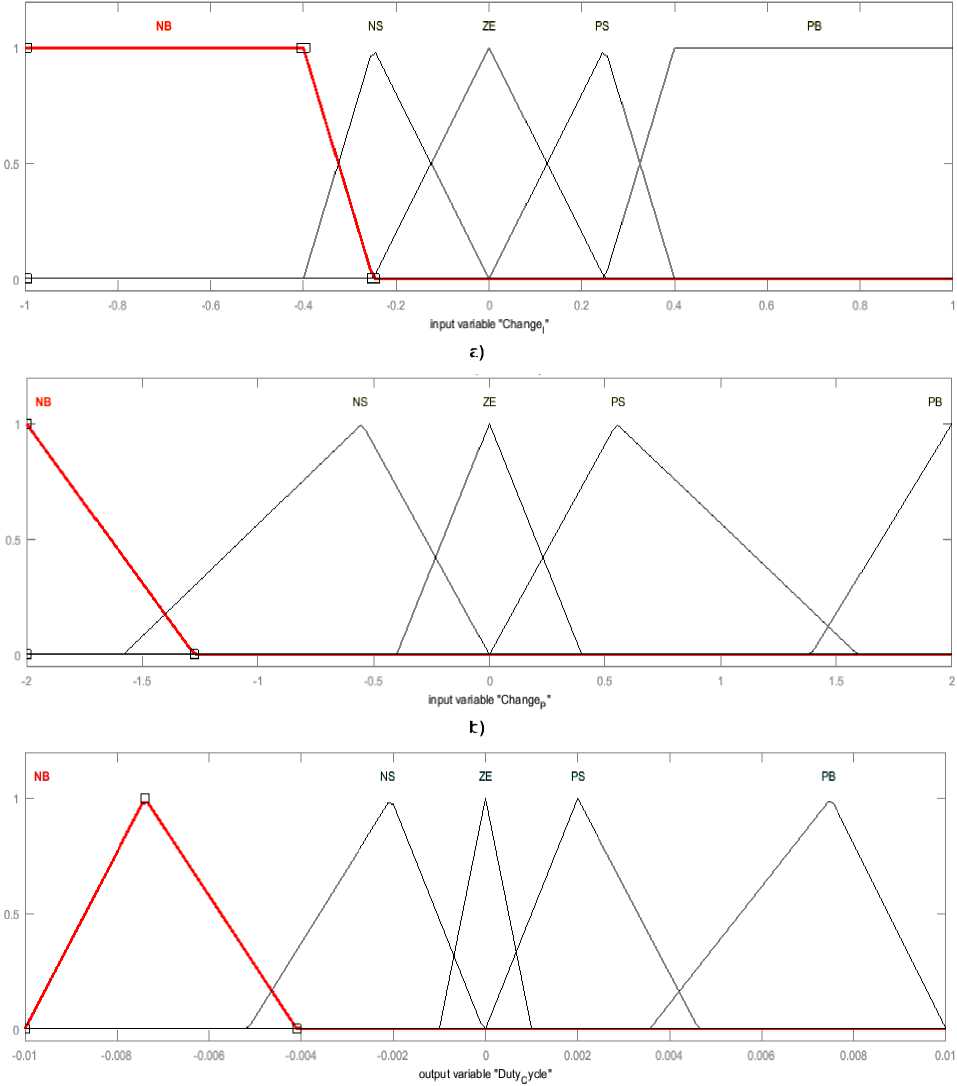
This technique consists of an input side, output side, and a fuzzy inference system (FIS). There are two inputs, a change in current (change_I) and a change in power (change_P). Each input and output has five membership functions (MFs). They are, starting from the left, negative big (NB), negative small (NS), zero (ZE), positive small (PS), and positive big (PB), as shown in Fig. 2. The universe of discourse (UoD) of change_I is made from (–1 to +1). Concurrently, the UoD of change_P is made from (-2 to +2), while the UoD of the output is made from (–0.01 to +0.01). The fuzzy inference system (FIS) is of the Mamdani type [31, 32]. There are 25 rules between inputs and the output, as listed in Table 1.
a)
b)
c)
Fig. 2. FLC: a) input MFs of (change_I); b) input MFs of (change_P); c) output MFs (Duty Cycle)
Table 1
Rules of FLC by 25 rules
|
change_P |
|||||
|
change_I |
NB |
NS |
ZE |
PS |
PB |
|
NB |
PB |
PS |
NS |
NS |
NB |
|
NS |
PB |
PS |
NS |
NS |
NB |
|
ZE |
NB |
NS |
ZE |
PS |
PB |
|
PS |
NB |
NS |
PS |
PS |
PB |
|
PB |
NB |
NS |
PS |
PS |
PB |
Fuzzy Logic Controller (FLC) by 35 rules
The FLC by 35 rules algorithm has the same number of inputs and single output. The UoD of each input and output are the same as well. The FIS is also of the Mamdani type. An expansion in the MFs is made for the input change_P and the output by adding two MFs, a negative medium (NM) and positive medium (PM). The rules for this FLC are listed in Table 2.
Interval Type 2 Fuzzy Logic Controller (IT2FLC)
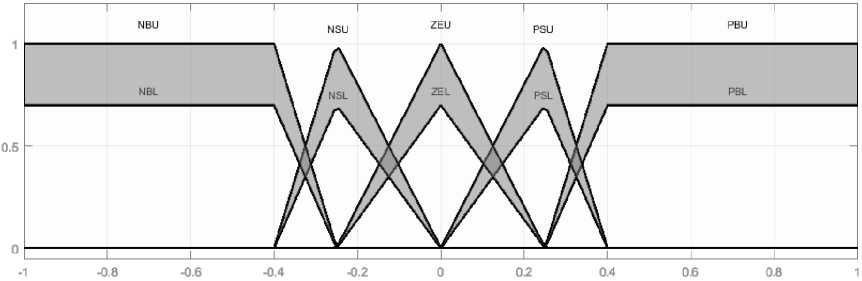
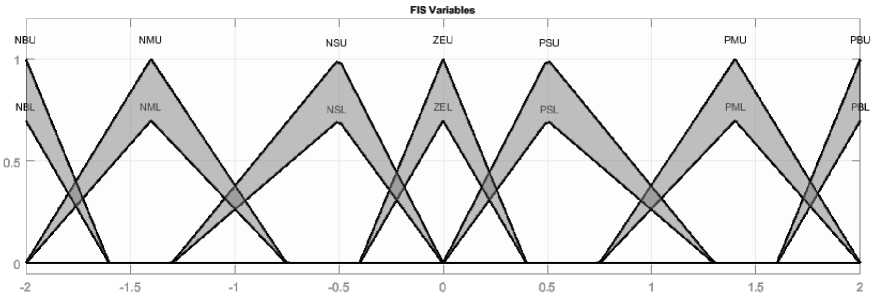
The FLC by 35 rules algorithm is converted to an IT2FLC form. The number of inputs, number of MFs and the UoD of each input remain the same. The number of rules is the same as well. The difference is in the MF structures of the IT2FLC. Each MF consists of two parameters, upper and lower, as shown in Fig. 3. The FIS is of the Sugeno type. The output
Rules of FLC by 35 rules
Table 2
|
change_P |
|||||||
|
change_I |
NB |
NM |
NS |
ZE |
PS |
PM |
PB |
|
NB |
PB |
PB |
PM |
NM |
NM |
NB |
NB |
|
NS |
PB |
PM |
PS |
NS |
NS |
NM |
NB |
|
ZE |
NB |
NM |
NS |
ZE |
PS |
PM |
PB |
|
PS |
NB |
NM |
NS |
PS |
PS |
PM |
PB |
|
PB |
NB |
NB |
NM |
PM |
PM |
PB |
PB |
Table 3
Output FIS variables [20]
|
FIS Variable |
Values (Linear) |
|
NB |
[0 0 –0.0075] |
|
NM |
[0 0 –0.003667] |
|
NS |
[0 0 –0.001667] |
|
ZE |
[0 0 –2.385·10–19] |
|
PS |
[0 0 0.001667] |
|
PM |
[0 0 0.003667] |
|
PB |
[0 0 0.0075] |
FIS Variables
a)
b)
Fig. 3. Inputs of IT2FLC: a) change_I; b) change_P [20]
MFs are identified in linear vectors as listed in the Table 3. Defuzzification is based on the Karnik-Mendel algorithm (KM) [33, 34].
Simulation Results of the System
The proposed renewable energy system of Fig. 1 is simulated using MATLAB Simulink R2017a. The system parameters are shown in Table 4. The IC, FLC by 25 rules, FLC by 35 rules, and IT2FLC by 35 rules algorithms are simulated by applying all of these techniques to each renewable energy source. Fig. 4 shows the start-up results of each source with the corresponding MPPT technique. The load is 60 Ω for each phase and connected at the inverter output side. In this figure, it is notable that the total input power through using IT2FLC has the fastest response with the lowest overshoot, and higher supplied power compared to both FLC types. On the contrary, the IC
MPPT algorithm has the slowest response with a wide overshoot and higher power oscillations. FLC by 35 rules algorithm has a faster response than the FLC by 25 rules, but its steady state power is lower. The lower power of the FLC by 35 rules is due to lower supplied voltage from all sources.
As the system reaches steady state, load switching is done when the simulation time is 1.5 s, as shown in Fig. 5. After load switching, the load resistance is decreased to 34.28 Ω per phase.
After switching it can be seen that the power of the IT2FLC has the fastest response as well, but produces less power than any other of the MPPT techniques. As long as there is a decrease in the power, a decrease of the supplied voltage will result from each source as well. The total power by the IC algorithm has the slowest response and the power value is nearly same as both types of FLC, but it suffers from
Table 4
Parameters and specification of each renewable energy source
|
Renewable Energy Source |
Specifications |
|
|
PV panel (5 in series × 3 in parallel) The specification of a single panel |
Maximum Power |
213.5 W |
|
Open Circuit Voltage |
36.3 V |
|
|
Voltage at MPP |
29 V |
|
|
Short Circuit Current |
7.84 A |
|
|
Rated Solar Irradiation and Temperature |
1000 W/m2 at 25 °C |
|
|
Small Scale PMSG Wind Turbine |
Mechanical Nominal Power |
2000 W |
|
Base Power of the Electric Generator |
2000/0.9 W |
|
|
Number of Phases |
3 |
|
|
Maximum Power at Base Wind Speed (pu of nominal Mechanical Power) |
0.73 pu |
|
|
Pitch Angle |
0 |
|
|
Base Wind Speed |
12 m/s |
|
|
Stator Resistance |
1.95 Ω |
|
|
Armature Inductance |
1.9 mH |
|
|
Voltage Constant (V peak L.L. / Krpm) |
300 |
|
|
Inertia |
0.1 J(kg·m2) |
|
|
Viscous Damping |
0.0024 F(N.m.s) |
|
|
Number of Pole Pairs |
8 |
|
|
Rated Rotor Speed |
400 RPM |
|
|
TEG Module |
Number of TEG Pieces in Series |
204 |
|
Rated Δ T |
60 °C |
|
|
Seebeck Coefficient |
0.04 mV/K |
|
|
Internal Resistance of a Single TEG |
0.323 Ω |
|
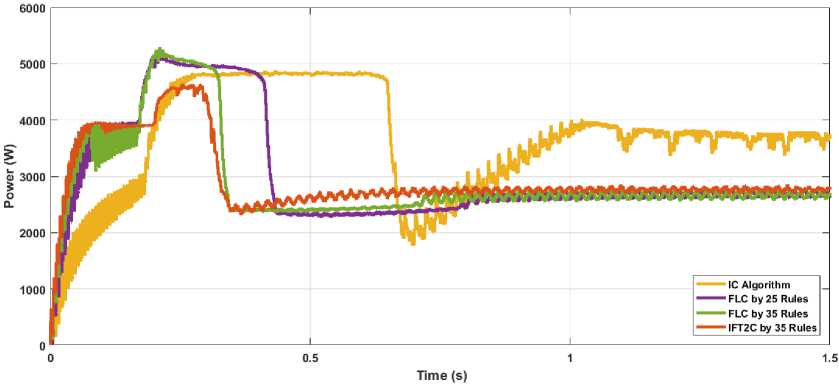
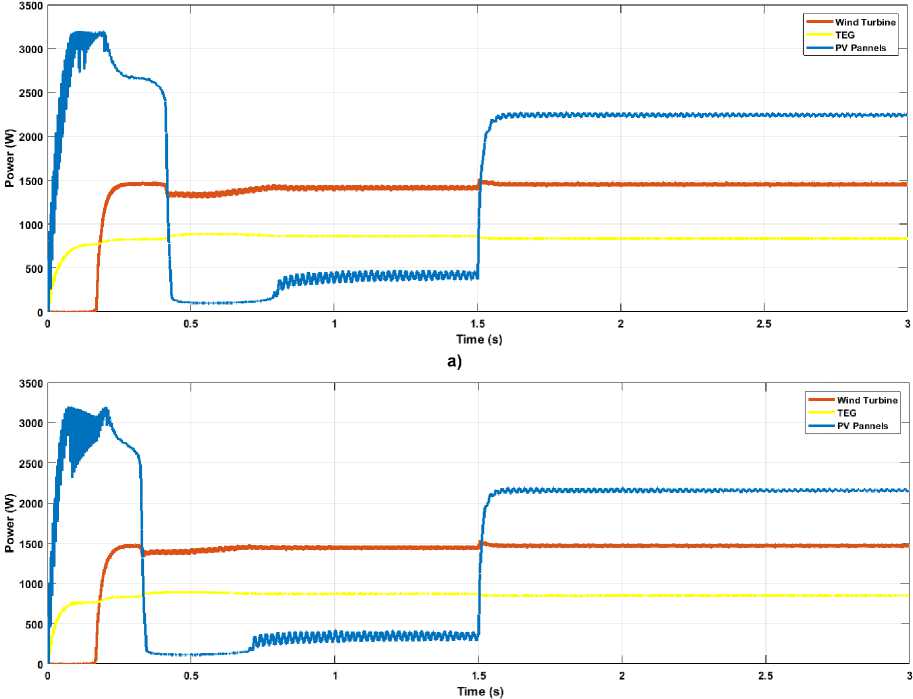
Fig. 4. Power at PCC with an inverter at system startup when the load is 60 Ohms per phase
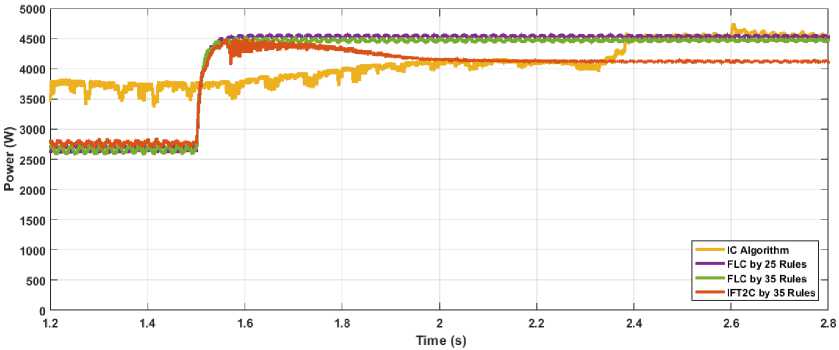
Fig. 5. Power at PCC with an inverter at load switching from 60 to 34.28 Ohms
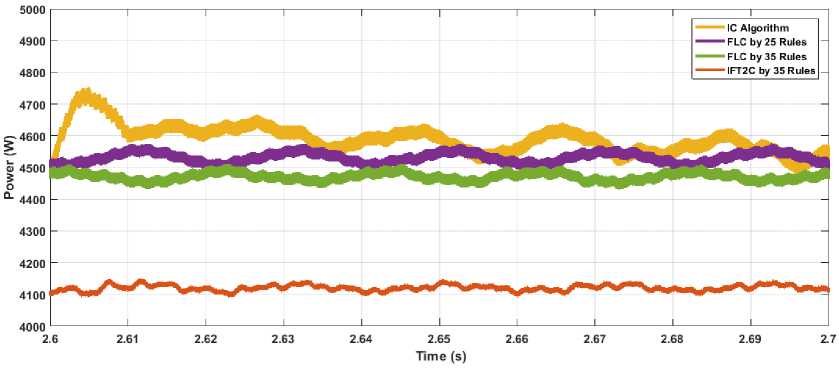
Fig. 6. Power at PCC with inverter at steady state after load switching from 60 to 34.28 Ohms
oscillations. These oscillations are due to the nature of IC algorithm routines. The power from the FLC by 35 rules algorithm has less difference than the power by FLC by 25 rules. Fig. 6 represents an enlarged view of the power of each MPPT technique after load switching. It can be seen that the power varies from
4500 W to 4700 W for the IC algorithm and both FLC types. However, the power is 4100 W when the IT2FLC is applied.
In order to investigate the impact of the MPPT techniques, the simulation is repeated by applying each MPPT technique for all resources at the aforemen- tioned loads (60 Ω per phase and 34.28 Ω per phase). Load switching is done at a simulation time of 1.5 s.
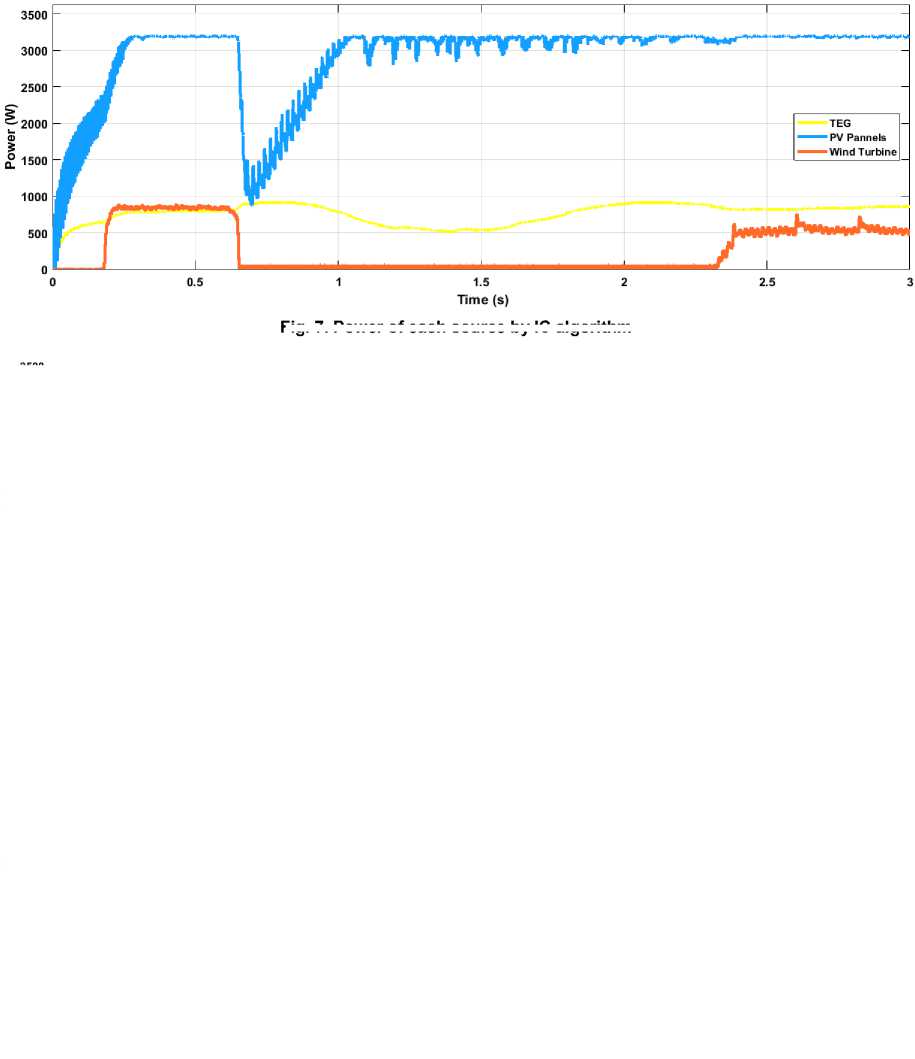
For the IC algorithm, it can be noted from Fig. 7 that when the load is 60 Ω per phase, the power of the PV panels reaches the MPP value for both loads. The TEG power oscillates between 500 W and 800 W. However, the power of the wind turbine presents the worst response at low loads since it value fluctuates by nearly 250 W and reaches 500 W when the load increases after the simulation time exceeds 2.4 s. This figure shows that the IC algorithm works properly only for PV panels.
For the FLC by 25 rules algorithm, Fig. 8a represents the power for each source for both loads. The figure shows stable power for the wind turbine and TEG. For PV panels, the power reaches its MPP value when the load is increased to a level higher than the generating capacity of the PV panels.
In the case of the FLC by 35 rules algorithm, the power response behavior of each source is similar to the state when the FLC by 25 rules algorithm is applied, but the total supplied power is less than if the FLC by 25 algorithm rules is used. The results of the FLC by 35 rules MPPT technique are shown in Fig. 8b.
b)
Fig. 8. Power of each source by the FLC: a) through 25 rules algorithm; b) through 35 rules algorithm
Fig. 7. Power of each source by IC algorithm
When the IT2FLC algorithm is used, the power response at low load is good for PV panels and TEGs where it reaches its MPP for TEGs before load switching. The power response for the wind turbine is worse, as shown in Fig. 9. After switching to the higher load, the PV panel and the wind turbine work at their MPP while the TEG works below its MPP. Also, the total power is less than when the other MPPT techniques are applied.
Table 5 represents the input power, output power, and efficiencies of both loads for each MPPT technique. When the load is 60 Ω per phase, the IC algorithm has the poorest performance, whereas the IT2FLC algorithm has the greatest efficiency. For a load of 34.28 Ω per phase, the IT2FLC algorithm has the lowest efficiency whereas the FLC by 25 rules has the highest. In comparison of all MPPT techniques in the current work, the FLC by 25 rules algorithm is more effective than the other MPPT techniques for various loads.
In the present study, all simulations are made with a three-phase inverter connected at the load side. A three-phase transformer is used to reach the required voltage levels since most of the resources are connected in parallel to a DC bus. All of them supply low voltage levels, which is undesirable in practical applications. In the previous figures of this section, the load is a balanced three-phase load. It is necessary to consider when the load is unbalanced. In the current
MPPT for hybrid wind, solar and thermoelectric power generation systems for off-grid applications work, a three-phase inverter is considered a voltage source inverter. This means that the output voltage should be kept constant at the desired level and changes are only made in the load current according to loading conditions. At the inverter terminals, there is an LCL filter to overcome the unwanted harmonics and produce pure sine waves for the output voltage and current. The modulation frequency is 10 kHz using the sinusoidal PWM (SPWM) modulation technique. A suitable controller should be used to maintain the output voltage at the desired level and frequency, as depicted in the functional block diagram in Fig. 1.
The inductor current, I_abc, of the LCL filer, the load voltage, V_abc, and the current of the transformer primary I prim._abc are sensed. The voltage controller is automatically activated to regulate the load voltage according to the voltage of the transformer primary side set point [35]. Furthermore, the waveforms of the load current and the load voltage are distorted with the conventional strategy under a nonlinear local load. Each of the sensed electrical quantities are converted to the d-q axis frame [36]. The reference voltages, Vd_ref and Vq_ref, are compared with the measured d-q axis voltages. The result of this comparison is the error that will be fed to a proportional integral (PI) controller. At this stage, the Vq_ref is set to be zero and only the Vd_ref is set at 160 V. This value represents the peak voltage or
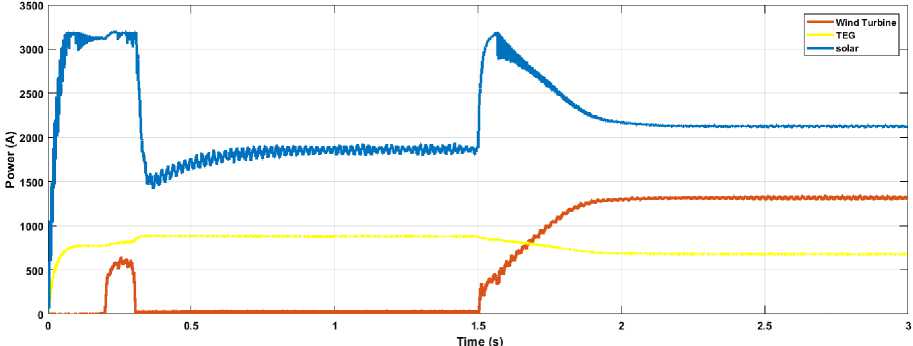
Fig. 9. Power of each source by IT2FLC through 35 rules algorithm
Table 5
Input power, output power, and efficiency for each MPPT techniques for various loads
|
MPPT Technique |
Load is 60 Ω per phase |
Load is 34.28 Ω per phase |
||||
|
Input Power (W) |
Output Power (W) |
Efficiency (%) |
Input Power (W) |
Output Power (W) |
Efficiency (%) |
|
|
IC Algorithm |
3760 |
2426 |
64.5 |
4635 |
4185 |
90.2 |
|
FLC by 25 Rules |
2687 |
2435 |
90.6 |
4540 |
4135 |
91 |
|
FLC by 35 Rules |
2700 |
2445 |
90.5 |
4665 |
4193 |
89.8 |
|
IT2FLC by 35 Rules |
2762 |
2524 |
91.3 |
4127 |
3312 |
80.2 |
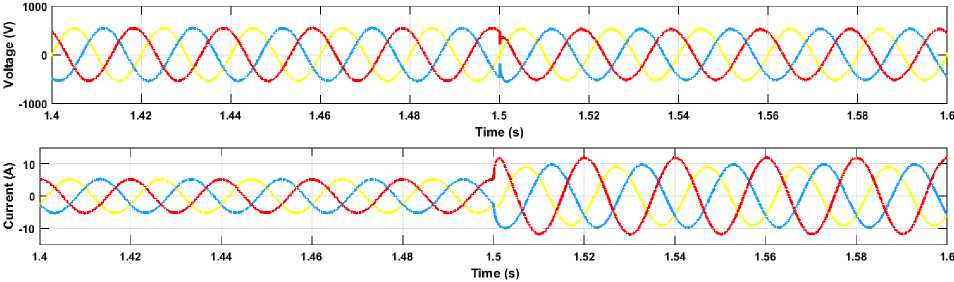
Fig. 10. AC voltage and current for balanced and unbalanced loads
DC voltage quantity at the transformer primary side. The transformer output side is maintained at 400 V line to line. The load current quantities, I prim._d, I prim._q, are added to the resultant signal from the PI voltage controller. Then, the resulting signal is added to the cross d-q quantities of the capacitance voltage, where ω o represents the fundamental angular frequency and C is the filter capacitance per phase. The d-q quantities of the inductor current are compared with the resulting signal. The generated error at this stage is fed to a PI current controller. The resulting signal is compared with the cross d-q quantitates of inductor current, where L represents the filter inductor value per phase. The resulting signal is finally converted from the d-q frame to the abc frame and used as a reference signal in the SPWM modulation technique. This is used to generate the required pulses for each inverter’s IGBT switch. Fig. 10 represents the load voltage and current in two states, where the simulation time is earlier than 1.5 s and the load is balanced at 60 Ω per phase. After 1.5 s, the load becomes unbalanced and the new loads become (20, 34.28, 37.5) Ω per phase.
Conclusions
In this paper, the design of a hybrid renewable energy system is focused on a small-scale wind turbine, TEG, and PV panels. The MPPT techniques are the IC, FLC by 25 and 35 rules, and IT2FLC based on 35 rules algorithms. Each technique is examined with all resources using a DC/DC boost converter. The load derives its AC voltage through a regulated three-phase inverter. The results show that the MPPT by FLC by 25 and 35 rules have better performance in cases of DC bus voltage, supplied power, system stability, sharing load among various sources, and efficiency. Also, the FLC by 25 rules algorithm is better than the FLC by 35 rules, since the power provided by the former is greater, about 4600 W. Since the DC bus voltage is normally less than the required AC load voltage, a suitable three-phase transformer should be connected at the inverter output terminals after the filter, in order to reach the desired voltage for the load. The designed hybrid system is suitable for domestic and off-grid applications.
References MPPT for hybrid wind, solar and thermoelectric power generation systems for off-grid applications
- Podder S., Khan R.S., Mohon S.M.A.A. The Technical and Economic Study of Solar-Wind Hybrid Energy System in Coastal Area of Chittagong, Bangladesh. Journal of Renewable Energy. 2015;(15):1-10. DOI: 10.1155/2015/482543
- Kaldellis J.K. (Ed.) Stand-Alone and Hybrid Wind Energy Systems: Technology. Energy Storage and Applications. Elsevier, formerly Woodhead Publishing, Cambridge, 1st Edition, England; 2010.
- Chávez-Urbiola E.A., Vorobiev Y.N., Bulat L.P. Solar hybrid systems with thermoelectric generators. Journal of Solar Energy. 2012;86:369-378. DOI: 10.1016/J.SOLENER.2011.10.020
- Doumbia M.L., Agbossou K. Experimental investigation of a grid-connected photovoltaic/wind energy system. In: 2009 IEEE Electrical Power & Energy Conference (EPEC); 2009. P. 356-362. DOI: 10.1109/EPEC.2009.5420810
- Syahputra R., Soesanti I. Performance Improvement for Small-Scale Wind Turbine System Based on Maximum Power Point Tracking Control. Energies. 2019;12(3938):1-18. DOI: 10.3390/en12203938
- Urbiola E., Vorobiev Y. Investigation of Solar Hybrid Electric/Thermal System with Radiation Concentrator and Thermoelectric Generator. International Journal of Photoenergy. 2013; Article ID 704087:1-7. DOI: 10.1155/2013/704087
- Madaci B, Chenni R., Kurt E., Hemsas K.E. Design and control of a stand-alone hybrid power system. International Journal of Hydrogen Energy. 2016;41(29):12485-12496. DOI: 10.1016/J.IJHYDENE.2016.01.117
- Kuchroo P., Bhatia H., Sidhu E. Floating TEG Integrated Solar Panel Hybrid Energy Harvesting System, International Research Journal of Engineering and Technology (IRJET). Mar 2017;4(3):1250-1254.
- Malik M.S., Ali F., Hammed M., Aman H., Bin Muzaffar O. Hybrid System for Electricity Generation using Waste Heat & Wind from Exhaust Duct of Generator. International Journal of Engineering Works, Kambohwell Publisher Enterprises. 2017;4(5):101-107.
