Multi Attribute Trust Aware Routing for Adversary Detection in Wireless Sensor Networks

Author: Akshatha Hari Bhat, Balachandra Achar H.V., Anil Mehta
Journal: International Journal of Computer Network and Information Security @ijcnis
Article in issue: 5 vol.16, 2024.
Free access
Security attacks has become major obstacles in Wireless Sensor Networks (WSN) and Trust Aware Routing is second line of defense. With an aim to improve on the existing routing mechanisms, in this paper, we propose Interactive, Onlooker and Capability Trust Aware Routing (IOC-TAR), a multi-trust attribute framework for trust management in WSNs. IOC-TAR employs three trust features to establish a trustworthy relationship between sensor nodes for their cooperation. Interactive trust uses communication interactions, onlooker trust uses neighbor node’s opinions and capability trust uses stability and fault tolerance for trust assessment. For, each node, one composite trust factor is formulated and decides its trustworthiness. Extensive simulation experiments are conducted to evaluate the effectiveness and efficiency of proposed IOC-TAR in the identification of malicious nodes and the provision of attack resilience. The results declare that the IOC-TAR enhances the attack resilience by improving Malicious Detection rate and reducing False Positive Rate.
WSN, Security, Stability, Fault Tolerance, Onlooker, Interactions and Malicious Detection Rate
Short address: https://sciup.org/15019471
IDR: 15019471 | DOI: 10.5815/ijcnis.2024.05.03
Text of the scientific article Multi Attribute Trust Aware Routing for Adversary Detection in Wireless Sensor Networks
In recent years, Wireless Senor Networks (WSNs) have gained remarkable importance in different aspects of human lives because of their connectivity with the technology. The long distance communication through wireless channels introduces so many issues due to the unreliable communication. Among these issues, Security is found as one of prominent issues in which the SNs get compromised by the attackers and performs malicious activities like packet dropping, not supporting for information forwarding, fake information propagation etc. As the communication paradigm in WSNs is open in nature, the SNs are more prone to several security attacks.
In multi-hop routing if any node is compromised, then the entire path becomes obsolete. So, before choosing a node for data forwarding, its trustworthiness needs to be checked in different orientations. This kind of mechanism is called as trust aware routing where each node initially checks the trustworthiness of all of its neighbor nodes and chooses one trustworthy node as a next hop node. Most trust aware routing mechanism proposed earlier, have considered only few and common features. Most of the methods employed communication interactions as the main feature for the determination of malicious nodes. However, there may exists some malicious interactions resulting in the less detection performance.
To sort out these problems, in this paper, we propose a new routing mechanism called as an Interactive, Onlooker, Capability Trust Aware Routing (IOC-TAR) to provide resilience for WSNs to different security attacks. The proposed IOC-TAR considers three features such as communication interactions, recommendations and capability of nodes to assess the trustworthiness. A new factor called as Composite Trust Factor (CTF) is formulated by combining three features. Based on the CTF, the node is declared as malicious or not. If it found as malicious, then that node is isolated from network and the corresponding information is propagated throughout the network.
2. Related Works
Several methods are proposed in the past for the malicious node’s identification in WSNs. In all of these methods, the node which was attacked through any kind of attack is called as malicious and such kind of node is identified when the source node wants to route the data to base station. The malicious node identification is done based on its behavior. Since there exists too much deviation between normal node’s behavior and malicious node’s behavior, keeping a continuous monitoring can make it possible to identify it. At the time of detection, the sender node compares the node’s behavior with its past behavior as well as with its neighbor node’s behavior. If the sender node found the difference between the behaviors, then it declares the corresponding node as malicious. At the detection process, the behavior is assessed through several features and the major research is done at this phase only.
-
Z. Zhang et al. [1] employed three trust features namely Data Trust (DT), Honesty Trust (HT) and Interactive Trust (IT) for the identification of malicious nodes in hierarchical WSNs. Initially, the clustered entire network into different clusters and on cluster is selected for every cluster. Next, they accomplished the three trust features for the trust assessment of both cluster members and cluster heads. Further, they also employed a new mechanism for the determination of a dynamic and adaptive threshold beyond which the node is declared as malicious. But, they didn’t consider the recommendations of neighbor nodes during trust assessment.
-
F. Shang et al. [2] considered two trust features namely majority rule and link quality for the malicious node identification that was attacked by sinkhole attack and DoS attack. They applied a cumulative summation after the calculation of two trust features. But they didn’t consider the basic communication interactions which is most important features as it resolves a greater number of attacks. For example, the black hole attack, wormhole attack and selective forwarding attack can be identified based on the communication interactions only.
-
G. R. kumar and K. R. Valluvan [3] considered two trust features for the identification of adversary nodes. They are Successful packet deliveries and Kalman filter. For an entire route, they compute the trust and based on the obtained value, an acknowledgment is introduced for the packet’s selection. This kind of selection lessens the control overhead at the node. However, only the successful interactions based trust awareness in not sufficient for the detection of some serious attacks like Sybil, tampering etc. Moreover, the DoS kind of attacks can be traced by the analysis of total number of non-successful interactions.
-
G. Umashankar et al. [4] focused on the security attacks at physical layer and malicious nodes are detected based on the deviation of their behavior at physical layer properties. They called the method as “Physical Layer Based Intrusion Detection System (PL-IDS)” as their main concentration is on physical layer. Mainly, they used energy as a reference features as it depletes quickly in the physical layer attacks like jamming and DoS attacks. Further, they added two more layers (MAC and Network) to PL-IDS and redefined it as “Protocol Layer Trust Based IDS (LB-IDS)” [5]. For physical layer, they calculated trust based on total received messages count and energy. Next, for calculation at network layer, they used hop count and at MAC layer, they used back off time and successful transmissions count. By combining all these features, an integrated trust feature is developed and it is used to identify several attacks like backoff manipulation attack, sink-hole attack, and jamming attack. However, this method is not resilient to false positives as the nodes sometimes break downs due to hardware failures and the evaluator node may assume it is due to the malicious activity.
-
K. V. S. Reddy and L. N. Devi [6] proposed a secure and composite routing strategy for WSN. Initially, they clustered the entire network into several clusters and for eh cluster one cluster head s chosen based on resources availability. Next, they employed two trust features namely data trust and social trust for trust assessment. The entire trusts assessment is accomplished cluster head such that the computational burden at node is reduced. However, they didn’t focus on the recommendation trust and capability trust which are more important in WSNs.
-
N. Venkatram and G. Sowmya [7] considered two trust factors namely energy, and communication to establish a secure and energy efficient route between sensor node and sink node. Further, this approach also employed a hop count factor to find an optimal path which has less hops as well less distances. Due to the consideration of both energy and trust factor, this approach has gained an optimal performance in both resource consumption as well as malicious node detection. However, this approach viewed the trust in the point of communication interactions only which is not sufficient for the detection of multiple attacks.
-
A. N. Rao et al. [8] proposed a “Trust and Packet loss Aware Routing (TPLAR)” to identify malicious nodes in WSNs. TPLAR considered two independent trust features such as residual energy metric and buffer capacity to assess the true packet loss. Since the packet loss is a common issue and the sender mode may assume it is due to malicious nature, the TPLAR considers basic properties for packet loss analysis. Along with these features, they considered Packet Forwarding Probability for trust evaluation.
-
Y. Han et al. [9] formulated node’s comprehensive trust based on their direct and indirect trust values. The direct trust is computed based on volatilization and adaptive penalty factors and indirect trust is measured through filtering strategy. Further, they developed an adaptive threshold function based on residual energy to choose the optimal cluster heads. Finally, the optimization is modeled through genetic algorithm by modelling a fitness function through trust
values.
T. Kalidoss et al. [10] considered three trust features; they are direct, indirect and overall trust scores to assess the trustworthiness of senor nodes in WSNs. In addition, they applied a cluster based secure routing in which the cluster head selection is done based on the trust and QoS metrics. Finally, the optimal path is selected based on the path trust, hop count and energy. However, they considered basic communication interactions as trust features which are not sufficient.
3. Proposed Approach
3.1. Overview3.2. Trust Assessment
Here, the proposed trust management mechanism offers each node a set of trustworthy nodes to forward their information to base station in a secure way. The proposed framework formulates a Composite Trust Factor (CTF) based on which the next hop node is selected for information transmission. The CTF is composed of three trusts; they are Interactive trust (IT), Onlooker trust (OT) and Capability trust (CT). The Interactive Trust (IT) is measured based on the past direct experiences, Onlooker trust is measured is based on past indirect experiences and the Capability trust is measured based on node’s stability and fault tolerance. All these three trusts are measured individually and then combined into a new trust factor called as CTF. The Final CTF declares the final trustworthiness of a node and based on the obtained value, it is decided to select as next hop forwarding node or not. CTF is evaluated between every two nodes before data transmission between them. For a given evaluator node, it assesses the CTF of all of its neighbor nodes and based on the obtained values, only one node is selected for data forwarding. Figure.1 depicts the overall block schematic of proposed mechanism.
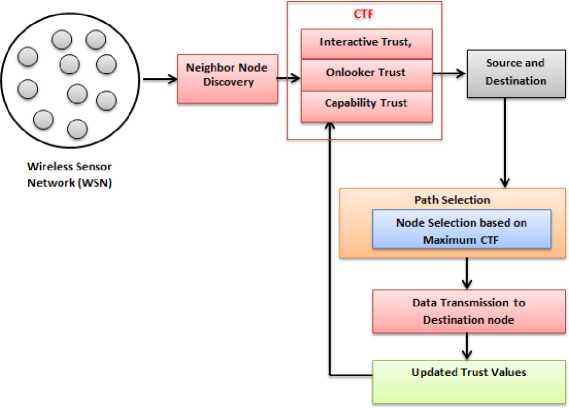
Fig.1. Block schematic of proposed mechanism.
In general, the trust is defined as a belief of somebody on some other people. Here, the belief reveals one SN’s readiness to communicate with other SNs. The belief is assessed through several metrics like SN’s earlier experience, interaction of observation. For example, upon the completion of an interaction of one node with some other node, then it is said to be in the state its belief or opinion can be decided. This opinion is purely based on its functioning during the interaction with partners. So, from this perspective, a belief can be stated as an aggregated form of past historical opinions given by nodes those were interacted in the past. Moreover, the belief can also be assessed based on its working behavior; i.e., whether it was successfully executed the task or not. This kind of assessment is purely based on the node characteristics such as stability and hardware failures. In this work, the belief or trust is the composite of IT, OT and CT. The first two trusts are purely dependent on node’s communication or interaction history while the third trust is dependent on node’s capacity or internal attributes. At every communication interaction between two nodes (let A and B), A gain an experience and based on that experience, A can give an opinion about the interacted node B. In case of no direct communication interaction between nodes, the evaluator node seeks the onlooker trust about the target node from its most trustworthy neighbor nodes. Next the capability trust of target node is dependent on its past performance with respect to fault tolerance and stability. The details of three trust factors are demonstrated clearly in the following sub-sections.
-
A. Interactive Trust
Interactive Trust is measured based on the past opinions which represent a historical view about a node. To obtain an opinion about a node, there must be at least one communication interaction. In case of no communication interaction between nodes, the evaluator node measures the initial trust with the help of opinions of nodes those resembles the target node. Hence, the IT can be measured with the help of past opinions and primary opinions regarding the resembles of target SN. Consider two SNs ni and nj they are communicated for n times in earlier. At every interaction, one opinion is produced and let it is denoted as ot(nj)(ot(nj) ∈ [0 1]) . This opinion is generated by node ni based on the behavior of node nj during the interaction. Next, assumes there exists Q number of resembling node of node nj and they have already interacted with node ni . Then the opinion of node ni to the resembling nodes of node nj is ot (ni)(res(nj)) , where res(nj ) is the resembling node of nj . In this case, the node nj is assumed to have no communication interactions with node ni and nj is treated as stranger node. Based on these statistics, the interactive trust between two nodes ni and nj are referred as;
I T (n i ,nj') =
I
ZL O r (nl,res(n j )') a x —------— м fx^ ^fUl , n
, If n = 0
If n ^ 0
The above Eq.(1) provides a belief about node nj to the node щ based on average of opinions of resembling nodes in the starting phase, i.e., no communication interaction (n=0). After the communication interaction is started between nodes, the IT is measured as an average of earlier opinions given by node щ, as given in Eq.(1) for n ^ 0. Next, a and fl are called as impact factors at n=0 and n ^ 0 respectively. The range of a varies from 0 to 1 and it signifies the effect on the primary belief of the resembling nodes of target node. On the other hand, f signifies the impact of past opinions and it is measured based on past communication interactions between nodes. Among the total past opinions, there exists some malicious opinions, let n be total past opinions and p be the malicious opinions, then the impact factor f is calculated as f=(^
(—) n-pf
The malicious opinions provided in Equation (2) leads to the reduction of interactive trust. With the rise in the malicious opinions count, the IT reduces drastically. This is in resemblance with human behavior where the people generally execute a greater number of interactions to maintain their trustworthiness. But, upon an occurrence even one malicious action, the entire trust will get collapsed in human society.
-
B. Onlooker Trust
In WSNs, there exist some situations where every node is not possible directly with all other SNs in WSNs. In such kind of environment, the SNs seek the help of other nodes to assess the trustworthiness of target node. The evaluator node can receive creditable reviews about the target node from its trusty neighbor nodes. These opinions help to analyze the trustworthiness of target node to which it should be trusted. This kind of trust is called as onlooker trust. Hence, the onlooker trust implies a recommended trust from third party nodes which are more trustable common neighbor nodes. However, the selection of trusted neighbor nodes is important. For this purpose, we measure a trust threshold based on the obtained opinions at evaluator node.
Consider an evaluator node ni has no direct communication interaction with target node n j . Further, consider nbk be the neighbor nodes of node ni which already has a direct communication interaction with target node n j and let it is represented as o nb ( nb i k , n j ) . The range of o nb ( nb i k , n j ) is kept in between 0 and 1, i.e., o nb ( nb i k , n j ) ∈ [01] . Based on these statistics, the onlooker trust between two nodes ni and n j is measured as
От^Ч) =
S f(:)onb ( ni,nbDxon:b ( n b t‘,nj ) Zfa O nb (n i ,nb f )
where f (.) is a trust function that was used to find out the trustworthy nodes based on trust threshold. Mathematically, the trust function is modeled as
Ю = onb(n t ,nb f ) > (P
where p is the trust threshold based on which the common neighbor nodes are selected. The neighbor nodes are declared and selected for opinion sharing if they satisfy the condition shown in Eq.(4). The nodes those satisfied this condition is only allowed to provide their opinion regarding trustworthiness of rtj to nt. Since we focused only on the common neighbor nodes, there exists an opinion between target node and neighbor nodes and it can be represented as °nb(nb*,nj'). According to Eq.(3), the evaluator node щ initially chooses the third party neighbor nodes based in trust threshold ^. Then they collect the opinions from nbi and aggregates according to the weighted average method as shown in Eq.(3), О^п^щ). The main advantage of this calculation is the reduction of heavy computational costs. Moreover, the recommended trust is from most trustable neighbor node’s direct opinions and it is not obtainable from lengthy paths those have high probability of security hazards. A sample demonstration about От(п1,П]') was shown in Fig.2 and the onlooker trust is shown in below equation.
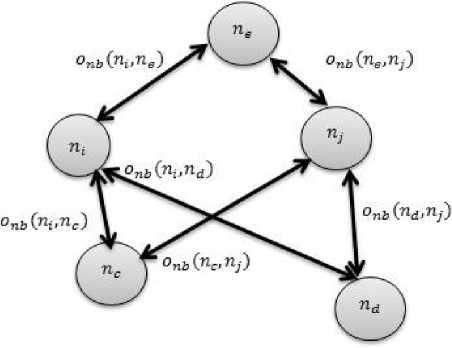
Fig.2. An example of onlooker trust computation.
О т (п 1 ,п , ) =
(^ nb (n i ,n e )^O nb (n e ,n j )) + (o nb (n i ,ncyxonb(.nc,n j )) + (on b (n i ,nd)xon b (nd,n ft)
O nb ( пьП е )+оп ь (n i Vft+O nb (n i ,n ft
An example of onlooker trust computation is demonstrated here; Consider node A as evaluator node which have five neighbor nodes nbk : B, C, D, E and F with opinion scores 0.7, 0.9, 0.5, 0.6, and 0.7 respectively. To get the trust value of a stranger node G, then the node A can enquire its neighbors. Consider that the opinion scores of neighbor nodes with G are 0.8, 0.8, 0.7, 0.6 and 0.9. Consider the threshold ϕ is fixed as 0.6. Then the Onlooker trust between nodes A and G, Or ( A , G ) is calculated as
(0.7X0.8) + (0.9X0.8) + (0.6X0.6) + (0.7X0.9)
О (^, fa)
' (0.7+0.9+0.6+0.7)
Q rAQ\= (0.56) + (0.72) + (0.36) + (0.63) _ Q yg
T^ ’ ' (2.9) — .
-
C. Capability Trust
In WSNs, the sensor nodes have an important role as it can make the node to work properly. On the other hand, the node capacity can also become evidence that can manifest a sensor node’s trustworthiness. Moreover, it can also help in correct identification of malicious nodes. Since there exists some misinterpretations due to depletion of node’s basic resources, the capacity of a node needs to be analyzed at trust assessment. For example, if a packet drop occurred at any node due to overflow of its buffer capacity, then the sender node may assume that the receiver node has become malicious; however, it is not a correct assumption. To solve such kind of misinterpretations, about nodes in network, their capability also needs to be addressed during their trustworthiness assessment. In this work, the capability trust of a node s assessed through two trusts, they are fault tolerance trust and stability trust.
-
a. Fault-tolerance Trust (FTT)
In WSNs, the key elements such as sensor nodes are tiny devices that may break down easily and may get start malfunctioning. Since there exists a simple electric / electronic circuitry in sensor nodes, the recovery is easy and quick. However, some nodes may not be able to recover easily and quickly. As they didn’t recover, they won’t resume to their normal functionality. So, a SN that has a frequent break downs is treated as a not reliable and not creditable SN. Hence, we evaluate FTT for SNs that signifies the performance against the fault of other SNs. The FTT is computed with the help three rates; they are fault rate, success rate and recovery rate. Among these three rate, the larger value of success rate and recovery rate and smaller value of fault rate implies a great FTT. All these rates can be calculated from the past working experiences. Due to the availability of these rates ate very node, the computational cost incurred to aggregate is not that much high.
Consider the evaluator node as ni and target node is n j , past success rate of n j is S ( ni ), failure rate of n j is F ( n j ), and recovery rate of n j is R ( ni ) , the its fault tolerance trust is measured as
Fт(n^,n]) = (S(nf) (1-F (l^' ) x (И(щ)р1(п^} (5)
As much as more F r ( n i , n j ) , the node is said to be more reliable and creditable. Even at the assessment of onlooker trust, the common neighbor nodes those are more reliable are only considered for opinion score sharing.
-
b. Stability Trust (ST)
In WSNs, due to open communication, the sensor nodes are flexible to leave and join the network at every time. This kind of process makes the network to be dynamic. Obviously, the node with frequent departures is considered as not reliable and vice versa. Hence, the more stable node will gain more trust as it ensures more advantages for WSNs. In this work, we consider two time attributes for the computation of stability trust; they are operating time and existing time. The existing time signifies the total lifecycle of node while the operating time signifies the total time which the node is under working mode. Hence, the stability trust of a node is defined as the ratio of working time to the exiting time.
Consider two nodes ni and n j as evaluator and target nodes, respectively, the stability trust of node n j is calculated as
Р т (п1>п ] ) =
I
Tw(nj ) т E(n j ) ’
Tw ( n j )
T E (n j )
X Ш,
if n = 0
if пФ 0
where Tw(nf) is the working time, TE(nj) is existing time and ш is an arbitrary constant which ranges from 0 to 1. ш is calculated based on the advance parameter fl and n number of instances the node has been departed, as ш = f1 n+1
Simply, ® can be called as penalty function and it is more for the nodes which has a greater number of departures. Since there exists a record of previous working and existing times, the additional computational cost incurred to acquire is less. Consider a SN A has gained the stability performance of another SN B as follows; B has existing time of 1000 hours and kept 600 hours under working condition. Let node B has departed for 10 times and consider в = 0.6 . Based on these values, the stability trust is calculated as
Бт(щ,п) = ^o(0.^ 11
$ т (пьп^ = 0.3771
Finally, the capability trust of node is calculated by joining the FTT and ST. The final capability trust mathematically expressed as
С т (пьп ] ) = ^т (Щ>п ]) + $ т (п 1 >п ] )) (8)
D. Composite Trust Factor
4. Simulation Experiments4.1. Experimental Set Up
Based on these three individual trusts such an IT, OT and CT, the CTF is formulated by assigning one weight for each trust. Mathematically, the CTF is expressed as
CTF(nbn j ) = (w i x 1 т (пьп)) + fa x О т (п1,П ] )') + (w 3 x С т (п1,П ] )) (9)
where w 1 , w 2 and w3 are the weights of Interactive trust, onlooker trust and capability trust respectively. These weights signify the importance of corresponding trusts and they are assigned in such a way they have to satisfy w 1 + w2 + w3 = 1 . For a given set of neighbor nodes, the evaluator node checks CTFs of all nodes. Among those nodes, the final node is selected for data transmission which has maximum CTF value.
Here, we demonstrate the particulars of simulation experiments conducted to validate the developed model. Under the simulation experiments, the proposed model is validated through numerous experiments by varying network parameters. Herein this section, initially we discuss the details of experimental setup, next the performance metrics and finally the obtained results.
Table 1 shows the details of experimental setup. Under the experimental setup, we consider a random network with several nodes. Consider N is the total node count and the area is considered as MXN , where N is width and M is the length of the network. Figure.3 shows the simple network with 30 nodes and figure.4 shows the nodes with virtually connected links. All the SNs are expected to static means they are not moving in nature. For each SN, the range of communication is defined as 1/4th of total network area, means the nodes those falls within the communication range are considered as neighbor nodes. to realize the random deployment concept, the position of SNs is changed in every simulation. For robustness checking, the simulation is executed by varying malicious node count in the network and they are changed based on total node count. For example, consider 100 be total node count and malicious portion is 20%, then the total number of malicious nodes are 20. Among these 20 nodes, if our model is able to identify entire nodes as malicious, then it is considered as efficient.
Table 1. Experimental setup
|
Parameter |
Value |
|
Node count |
100 |
|
Network area |
MXN |
|
% of Malicious behavior |
10%, 20%, 30%, 40% and 50% of node count |
|
Communication range |
20% of M or N |
|
Deployment of nodes |
Random |
|
ϕ |
Average of Trust Values |
|
and |
[0 1] |
|
Total number of interactions (n) |
200, 400, 6000, 800, 1000 |
|
Malicious interactions (p) |
10-20% of n |
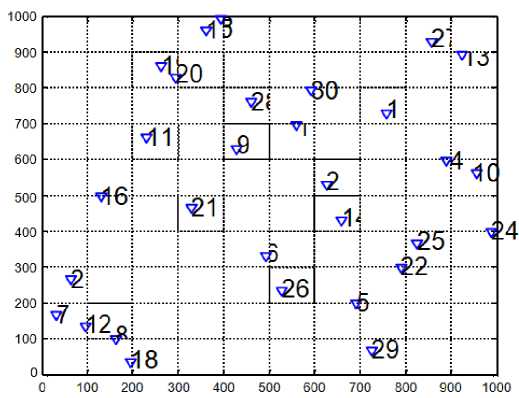
Fig.3. Network with 30 randomly deployed nodes.
-
4.2. Performance Metrics
Malicious Detection Rate (MDR): It is defined as the ratio of True Positives to the summation of True Positives (TPs) and False Negatives (FNs). If the node is malicious and the IOC-TAR also declared as malicious, then it is counted as TP otherwise False Negative. Mathematically, MDR is expressed as
TP
MDR = —TP— (10)
TP+FN v 7
The range of MDR lies in between 0 and 1, where o denotes worst performance ad 1 denotes excellent performance. False Negative Rate (FNR): It is defined as the ratio of FNs to the summation of TPs and FNs. Mathematically,
MDR isexpressed as
FNR =
FN
TP+FN
The range of FNR lies in between 0 and 1, where 0 denotes best performance ad 1 denotes worst performance.
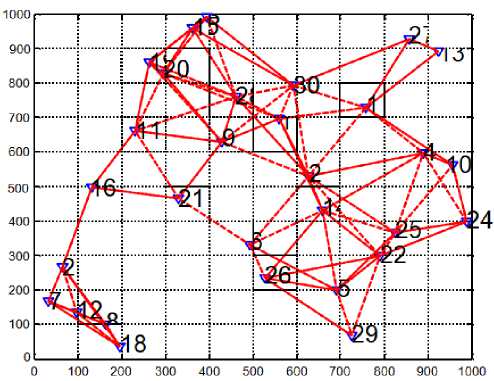
Fig.4. Network with virtually connected links between neighbor nodes.
False Positive Rate (FPR): It is defined as the ratio of False Positives (FPs) to the summation of TPs and FPs. Here the FP is defined if the node is not malicious but the method is declared as malicious. Mathematically, MDR is expressed as
FPR =
FP
TP+FP
The range of FPR lies in between 0 and 1, where 0 denotes best performance ad 1 denotes worst performance.
-
4.3. Results
At the experimental validation, to assess the performance of proposed IOC-TAR, we varied the total number of communication interactions along with %of malicious behavior. The total number of communication interactions is varied as 200, 400, 600, 800and 1000 while the % of malicious behavior is varied as 10%, 20%, 30%.40% and 50%. At each simulation case study, we compute the MDR, FNR and FPR based on the detection results. They are demonstrated in the following figures.
Communication Interactions
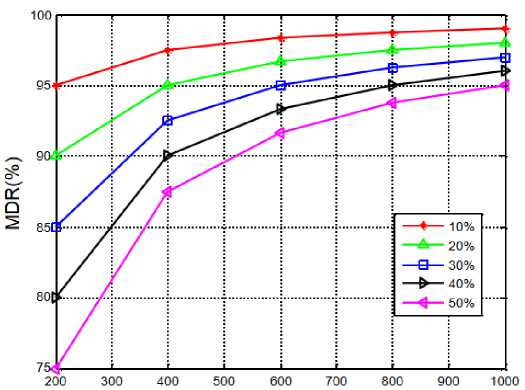
Fig.5. MDR vs. number of interactions for varying malicious portion.
In general, the sensor nodes maintain more communication interactions to ensure more trustworthy relationship with other nodes. This nature is exactly similar with the social behavior of human beings where the people try to interact rigorously to maintain a healthy and trustworthy relationship with other people in society. Even though they main a continuous interaction, if any negative interaction has incurred, then the entire society blames and propagates a false information about him/her. With this inspiration, here we simulated our model with varying communication interactions and the obtained MDR is shown in Figure.5. From the results we can see that with an increase in the number of communication interactions, the MDR increases. Further, we can also notice that the MDR declines with an incline in the portion of malicious behavior. For example, consider 20% of malicious behavior, the MDR at interactions of 200, 400, 600, 800, and 1000 are observed as 0.9, 0.94, 0.96, 0.97, and 0.98 respectively. Based on these values, we can see that for constant malicious nodes, the more in communication interactions results in more MDR. On the other hand, consider constant communication interactions (ex.200), the MDR at different malicious behavior such as 10%, 20%, 30%, 40%, and 50% is observed as 0.9512, 0.9042, 0.8547, 0.8033, and 0.7589 respectively. From this observation, for constant communication interactions, we can see that the MDR decreases with an increase in the malicious behavior. The Main reason is the penalty factor which we have introduced in Eq.(2) has a direct relation with interactive trust. With an increase in the malicious interactions, the SNs lost their trustworthiness with other nodes thereby results in less MDR. Moreover, there exists differ security attacks and based on the type of attack, the interactions will change and creates confusion to sensor nodes.
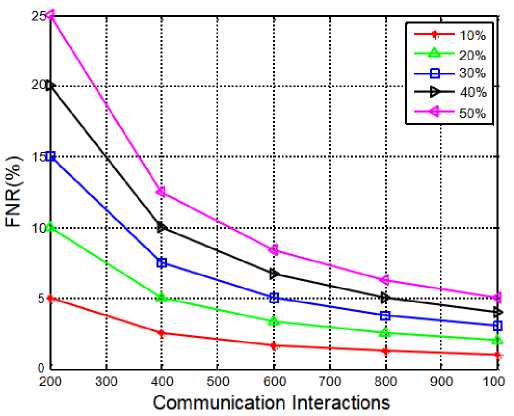
Fig.6. FNR vs. number of interactions for varying malicious portion.
The assessment of NFR with varying communication interactions is demonstrated in Figure.4. FNR is inversely related to MDR, for the rise in MDR, the FNR decrease and vice versa. Figure.6 shows the FNR versus number of communication interactions at different malicious behaviors. From the results, we can see that the FNR follows decreasing characteristics for the increasing interactions. As much as high the interactions, the nodes trustworthiness increases and if they were attacked by any attack, the detection is easy and accurate. On the other hand, the FNR is observed to be increasing with the increase in the malicious behavior. With the rise of malicious nature in Network, there is a chance of different attacks to get launched on the nodes and the detection of all such attacks becomes tough. In such case, if the malicious nodes are missed and they are declared as non-malicious, then the false negatives count increase and results in a higher FNR. Consider the constant malicious portion of 50%, the FNR at 200, 400 and 600 is observed as 0.25, 0.12 and 0.07 respectively.
Figure.7 shows the variations of MDR for varying malicious behavior. As it can be seen, the MDR decreases with the rise of malicious node count in the network. As the compromised SNs count is more or number of attacks is more, the network is considered to have more malicious behavior. In such situations, the identification of adversary SNs is very tough because the attacks are different and they have different compromising properties. So, some malicious nodes are not detected and results in less MDR. In the comparison part, the proposed IOC-TAR is perceived to have more MDR than the traditional methods. Among the existing methods, the PL-TAR [27] considered the features those reflect the packet loss. However, they are not sufficient for malicious nodes identification. Next, the MC-TAR [25] considered communication trust (both direct and indirect) and energy trust for trust calculation. However, they observed a drastic deterioration in MDR at larger malicious nodes count. The SC-TAR [24] used data trust as an addition feature along with communication trust. The data trust is introduced based on the data correlation assumption, i.e., the correlation between data of sensor node sin a cluster is high. SC-TAR had shown better detection performance, especially at data tampering attacks. However, they didn’t consider capability and fault tolerance of nodes in the trust assessment. In summary, the proposed IOC-TAR had shown superior performance in the identification of malicious nodes because it considered multiple attributes each from different view point. On an Average, the MDR of IOC-TAR is observed as 94.6252% while for PL-TAR, MC-TAR and SC-TAR is observed as 93.4120%, 90.8012% and 85.6330% respectively.
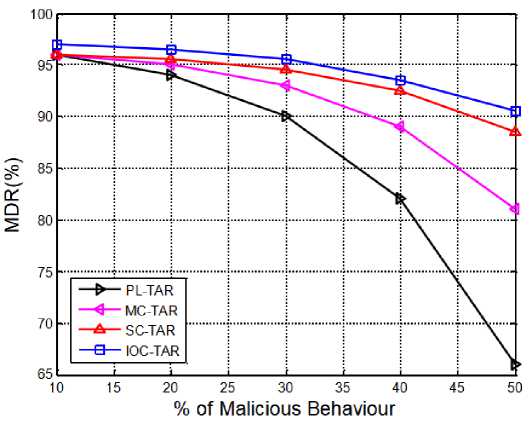
Fig.7. MDR for varying malicious behavior.
10 15 20 25 30 35 40 45 50
% of Malicious Behaviour
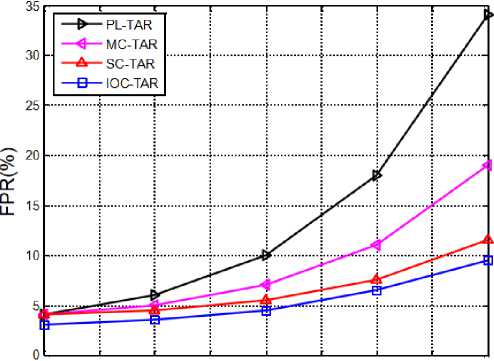
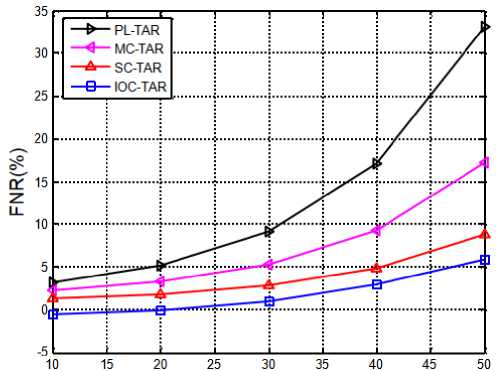
Fig.8. FPR for varying malicious behavior.
% of Malicious Behaviour
Fig.9. FNR for varying malicious behavior.
As the number of malicious node count increases in the WSNs, the SNs are assumed to be conceded with larger number of serious attacks. As the attacks are more and diverse in nature, the detection is very tough because the nodes need to analyze the other nodes in multiple orientations which are not possible. In such case, even though the node is compromised with attack, it is declared as innocent and results in higher false negatives. Similarly, the innocent nodes may be declared as malicious and results in higher false positives. Figure.8 and Figure.9 shows the variation of FPR and FNR for varying malicious behaviors respectively. From these results, the proposed method is observed to have less FPR and FNR, as it included three trust features such as IT, OT and CT. The first two trust features signify the real attack properties and hence the IOC_TAR can identify the attacks accurately. Next, third feature analyzes the node basic properties and reduces the false positive count, i.e., innocent nodes won’t get declared as malicious. The average FPR of IOC-TAR is perceived as 5.4201% while for PL-TAR, MC-TAR and SC-TAR is observed as 6.6632%, 9.0214% and 14.4785% respectively. Similarly, the average FNR of IOC-TAR is perceived as 4.5175% while for PLTAR, MC-TAR and SC-TAR is observed as 7.4578%, 102241% and 16.9645% respectively.
5. Conclusions
This paper focused on the development of an adaptive malicious node identification method that detects the adversary nodes even at the run time. The proposed IOC-TAR is a combination of multiple trust attributes with different meanings. The interactive trust and onlooker trust provides resilience against attacks like DoS, sink-hole, selective forwarding etc. The capability trust resolves the confusion about the node malicious nature and helps in the correct detection such that the innocent nodes won’t get punished. Simulation experiments are accompanied on the IOC-TAR with varying malicious behavior and number of interactions. The obtained results show that the proposed approach is better than the existing methods.
|
TECHNIQUES |
AVERAGE MDR |
AVERAGE FPR |
AVERAGE FNR |
|
PL-TAR |
85.6330 |
6.6632 |
7.4578 |
|
MC-TAR |
90.80 |
9.0214 |
10.2241 |
|
SC-TAR |
93.412 |
14.4785 |
16.9645 |
|
IOC-TAR |
94.625 |
5.4201 |
4.5175 |
References Multi Attribute Trust Aware Routing for Adversary Detection in Wireless Sensor Networks
- Z. Zhang, H. Zhu, S. Luo, Y. Xin, and X. Liu, “Intrusion Detection Based on State Context and Hierarchical Trust in Wireless Sensor Networks”, IEEE Access, Vol. 5, pp. 12088- 12102, 2017.
- F. Shang, D. Zhou, C. Li, H. Ye, and Y. Zhao, “Research on intrusion detection model based on improved cumulative summation and evidence theory for wireless sensor networks”, Photon Newton communication, Vol. 37, No.4, pp.212-223, 2019.
- G. Rajesh kumar, and K. R. Valluvan, “An Energy Aware Trust Based Intrusion Detection System with Adaptive Acknowledgement for Wireless Sensor Network”, Wireless Personal Communications, Vol. 94, No.5, pp.1993–2007, 2017.
- U. Ghugar, J. Pradhan, S. K. Bhoi, R. R. Sahoo, and S. K. Panda, “PL-IDS: physical layer trust based intrusion detection system for wireless sensor networks”, International Journal of Information Technology, Vol. 10, No. 4, pp. 489–494, 2018.
- U. Ghugar, J. Pradhan, S. K. Bhoi, and R.R. Saho, “LB-IDS: Securing Wireless Sensor Network Using Protocol Layer Trust-Based Intrusion Detection System”, Hindawi Journal of Computer Networks and Communications Vol. 2019, Article ID 2054298, pp.1-13, 2019.
- K. V. S. REDDY AND L. N. DEVI, “Secure and Composite Routing Strategy Through Clustering In Wsn”, 2nd International Conference On Innovations In Electronics, Signal Processing And Communication (Iesc), Shillong, India, 2019.
- Sowmya. G., and Venkatram. N., “Multi-Context Trust Aware Routing for Internet of Things”, International Journal of Intelligent Engineering and Systems, Vol.12, No.1, 2019, pp.189-200.
- A. N. Rao, B. Rajendra Naik, L. Nirmala Devi and K. Venkata Subbareddy, "Trust and Packet Loss Aware Routing (TPLAR) for Intrusion Detection in WSNs," 2020 12th International Conference on Computational Intelligence and Communication Networks (CICN), 2020, pp. 386-391.
- Youjia Han, Huangshui Hu, And Yuxin Guo, “Energy-Aware and Trust-Based Secure Routing Protocol for Wireless Sensor Networks Using Adaptive Genetic Algorithm”, IEEE Access, Vol.10, 2022, pp.11538-11550.
- T. Kalidoss, L. Rajasekaran, K. Kanagasabai, G. Sannasi, A. Kannan, “QoS Aware Trust Based Routing Algorithm for Wireless Sensor Networks”, Wireless Personal (2020) 110:1637–1658.
