Multi band spectral subtraction for speech enhancement with different frequency spacing methods and their effect on objective quality measures

Author: P.Sunitha, K.Satya Prasad
Journal: International Journal of Image, Graphics and Signal Processing @ijigsp
Article in issue: 5 vol.11, 2019.
Free access
This paper mainly studies Multi Band Spectral Subtraction (MBSS) for speech enhancement based on the spectrum representation in the frequency domain with three different scales(linear, log, mel) and their effect on performance measures in presence of additive non-stationary noise at different ranges of input SNR. Since speech is non-stationary signal, noise distribution is non-uniform i.e few frequency components are affected severely than others. A common method to restore the original speech in presence of noise is speech enhancement by suppressing the back ground noise. Multi Band Spectral Subtraction is one among the speech enhancement techniques which performs spectral subtraction by dividing noisy speech spectrum into uniformly spaced non over lapping frequency bands and spectral over subtraction is performed in each band separately. The performance of this method is evaluated in terms of objective measures such as Cepstrum distance, Log Likelihood Ratio, Weighted Spectral Slope distance, segmental SNR and Perceptual Evaluation of Speech Quality.
Speech enhancement, Multi Band Spectral Subtraction, Frequency Spacing Methods, Linear, mel, logarithmic, Objective Quality Measures
Short address: https://sciup.org/15016055
IDR: 15016055 | DOI: 10.5815/ijigsp.2019.05.06
Text of the scientific article Multi band spectral subtraction for speech enhancement with different frequency spacing methods and their effect on objective quality measures
Published Online May 2019 in MECS DOI: 10.5815/ijigsp.2019.05.06
To communicate ideas from one person to another in human communication is speech [1-3]. Real-world, environment is always surrounded by back ground noise which severely distorts the speech signal and it should be eliminated for further processing, One of the challenging task is Speech Enhancement which always have a scope for further improvement [2]. Speech enhancement plays a crucial step in important applications like voice command systems, Speech Recognition, Speaker identification, hands free systems and speech coding [3]. Based on the idea used, speech enhancement techniques are of different types. Based on the number of microphones used for speech acquition, speech enhancement techniques are of Single channel in which one microphone is used and the other is dual channel or Multi channel in which two micro phones are used. Based on domain of processing, Time domain and Frequency domain Speech enhancement techniques anddepending on the type of algorithm used adaptive and non-adaptive speech enhancement algorithms. Single Channel Frequency Domain Speech enhancement techniques are of more popular for personal communication because of its ease of implementation which involves forward and inverse transform.In the past, number of researchers proposed different speech enhancement methods. Most of them are based on Spectral Subtraction (SS), Statistical Model based, Sub space algorithms and Transform based methods. One of the popular noise reduction method which is computationally efficient and less complexity for single channel speech enhancement is Spectral subtraction proposed by Boll S.F for both Magnitude and Power Spectral Subtraction which itself creates a biproduct named as synthetic noise[1]. A significant improvement to spectral subtraction with over subtraction factor and spectral floor parameter to reduce the musical noise given by Berouti [2] is Non –Linear Spectral subtraction. Ephraim and Malah proposed spectral subtraction with MMSE using a gain function based on priori and posteriori SNRs [3]. Spectral subtraction based on perceptual masking properties of human auditory system proposed by Virag [4]. Another method in spectral subtraction with Wiener filter to estimate the noise spectrum is extended spectral subtraction by Sovka [5]. Spectral Subtraction algorithm based on two-band is Selective spectral subtraction described by He, C. and Zweig, G. [6]. Spectral subtraction with Adaptive Gain
Averaging to reduce the overall processing delay is given by Gustafsson [7]. A frequency dependent spectral subtraction is non-linear spectral subtraction (NSS) method conferred by Lockwood and Boudy [8] Multi Band Spectral Subtraction (MBSS) proposed by S.D. Kamath with multiple subtraction factors in nonoverlapping frequency bands [9]. This paper explores the Multi Band Spectral Subtraction proposed in [9] for different frequency spacing methods suggested in [10, 11].
The structure of the paper as follows, section II gives Multi Band Spectral Subtraction for Speech enhancement, Section III gives different frequency spacing methods for spectrum representation and Section IV gives objective quality measures finally results and conclusion are presented in section.
-
II. Multi Band Spectral Subtraction for Speech Enhancement
In real-world, noise is mostly colored, which affects the speech signal differently throughout the spectrum [9]. Few frequencies are affected more adversely than others, depending on the spectral characteristics of the noise. This section gives the details of the proposed method for speech enhancement with minimized residual noise. The degraded speech signal in presence of back ground noise is named as noisy speech which can be modeled as additive noise model with the basic assumption that both speech and noise signal are uncorrelated [1, 2]. The noisy signal can be modeled as the sum of the clean speech signal and the noise [1] as
y(n) = x(n) + v(n),n e (0,N - 1) (1)
Speech and other audio signals are time-varying signals. If we take the spectrum over the whole signal, then we get the average spectrum, but cannot see the individual phones or changes in fundamental frequencies.In real-time applications we also need to split up the signal in to segments such that we do not have to wait for the wholesentence to be finished before we can start processing. If we take the spectrum from small segments (windows) close to each other, we can then observe the spectral evolution of the signal. Such a representation is known as the spectrogram of a signal. When the spectrogram is calculated using windowing and the discrete Fourier transform it is called the short-time Fourier transform (STFT). Now STFT of the noisy signal is represented by
Y(K) = X(K) + V(K) (2)
Multi Band Spectral Subtraction, involves different stages. In the first stage, the signal is windowed and the magnitude spectrum is estimated using the FFT. Secondly, the noise and speech spectra are split into different frequency bands and calculate the over-subtraction factor for each band. The third stage includes subtraction in individual frequency bands by readjusting the over subtraction factor. Lastly, the modified frequency bands are merged and the time domain signal is reconstructed with the aid of the overlap-add method and taking the IFFT. The advantage of pre-processing in this method is to decrease the variance of the spectral estimate and subsequently to reduce the residual noise. This algorithm re-adjusts the over-subtraction factor in each band. Therefore, the estimate of the clean speech spectrum in the jth Band is obtained by f ^СК)|2-^^(Ю|2,
|Г/К)| 2 = hf|XJ(K)| 2 >0- |y ;- (K)| 2 else (3)
[ 0 -№1 2
K j < к < Ky+1
The beginning and end frequency bins of the jth frequency band are given by K j and K j+1 , the band specific over subtraction factor is given by « as a function of the segmental SNR of corresponding band. The segmental SNR of jth Band can be computed as
, . (^K=K^J (K)\ \
SNRjCdb) = 10fo5io ----- j y^/j(K)|2y
The O j can be calculated as « j
a
max,ifSNR
j
«— + (S«R , - S « Rmi„ ) ( s;™^
«min , IfSNRj > SNRmax, SNRmin < SNRm,x if
{
Here « min =1, « max =5, SNR min = -10dB, SNR max = 10 dB. The S j is additional band subtraction factors that provide an additional degree of control within each band. The value of used in each band is empirically calculated as most of the speech energy is concentrated below 1 kHz [9],[14].
r 1 f j < 1kHz
-
5. = J 2.5 1kHz < f j < у - 2 kHz (6)
-
I 1.5 f>--2 kHz
j 2
The negative values of the estimated spectrum are floored using spectral floor parameter β .To achieve minimum speech distortion in low frequency regions smaller values of 5 j is preferable and higher values of 5 j in high frequency regions. By reducing the variance of the frequency content of the speech,residual noise can be reduced in the enhanced speech. Hence, instead of using the power spectra of the signal, a smoothed version of the power spectra can be used. Average value of magnitude helps to help improve speech quality of the processed speech [9].
-
III. Proposed Method
Fig.1 shows the block diagram of proposed method. In proposed method the spectrum of noisy speech signal can be divided into non over lapping bands in different frequency spacing methods using linear, mel and log .Spectra of speech signal provides many of the useful characteristics which are visible for analysis, based on that most of the speech enhancement techniques are implemented in spectral domain. The spectrum of a speech signal can be represented in three different ways by considering the power spectrum along a linear frequency scale, cepstrum using logarithm of a power spectrum represented along a logarithmic frequency scale and mel frequency scale. In case of colored noise, noise power spectral density changes according to the frequency which effects differently at various frequency bands. S.Kamath [9] proposed speech enhancement method for colored noise with linear spacing. The proposed method uses three different ways of spectrum representation along linear, logarithm and mel frequency scales and then spectral subtraction is performed by dividing the spectrum into non-overlapping frequency bands generally 1-8.In [9] Kamath suggested that markable improvements can be observed when the bands are increased from 1-4 and smaller changes in performance measures from 5-8 bands. In the proposed method number of bands are selected as 4 along three different Frequency scales of a spectrum.
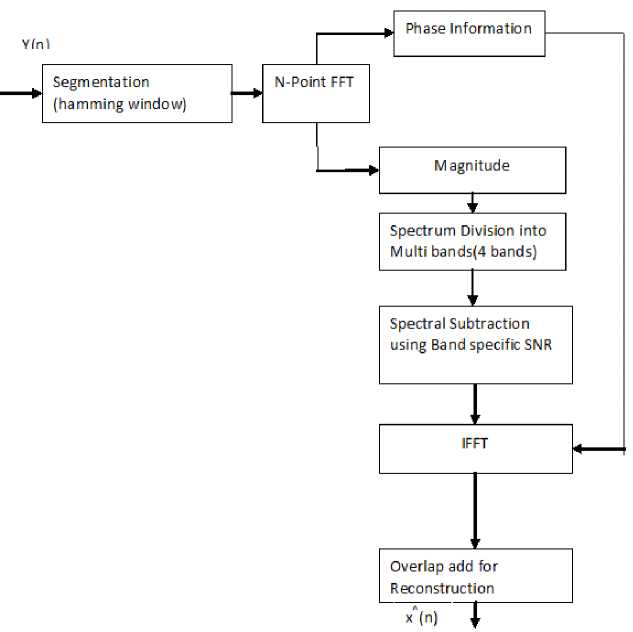
Fig.1, Block Diagram of Proposed Method
-
A. Linear Frequency spacing:
In linear frequency spacing, the spectrum of a timesignal x ( n ) can be obtained with the discrete Fourier transform. The Fourier transform is usually implemented with the Fast Fourier Transform (FFT) to reduce the number of additions and multiplications. The FFT of the signal x ( n ) is given by
X(K) = T^x(n)e-wnK (7)
In speech enhancement applications, magnitude spectrum |X (K) |is more important to perception than phase, as phase information does not perceived by the human ear. To see the energy or power of the signal, we take the square of the absolute magnitude value|X (K) |2.
This is known as the power spectrum. Experiments shown that human auditory system has better resolution at low frequencies than at high frequencies [12].For example it is easy to distinguish between 100Hz and 110 Hz but extremely at 1KHz and 1.01 KHz. Due to this audio devices like audio equalizers requires very high resolution at low frequencies than at high frequencies. Logarithmic frequency scale is a good approximation for this assuming that frequency specifications are viewed as uniform [12].
-
B. Logarithmic Frequency Spacing:
The logarithmic spectrum is a good domain in the sense that it roughly corresponds to the sensitivity of perception. However, the overall shape of the logarithmic power spectra is often a smooth shape. Logarithmic frequency representation plays an important role in many audio and acoustic signal processing applications. Frequency specifications on a log scale are given in fixed multiplicative increments .one standard unit of such increment is an octave[12]. A k-octave specification is the one whose frequency response is given on the set of frequencies f0,2k f0, 22k f0 etc. An auditory system is one which can perceive over a dynamic range from pin to aero plane. The most suitable method to represent this range of loudness is in decibels (dB) ,defined as 20 log10(X(K)). dB is also called as standard scale to represent the changes in magnitude in frequency response .Loudness is also perceived on a dB scale, for instance increasing the signal level from 20dB to 30 dB, doubles the perceived loudness. In addition to the fundamental frequency, the log-spectrum contains other useful information also. In logarithmic frequency spacing, the Centre frequencies are distributed logarithmically over the speech bandwidth. Logarithmic spacing is widely used in cepstrum analysis of speech signal[13].
Table.1 The centre frequencies for the corresponding frequency spacing methods
|
No.of Bands |
Center Frequencies (kHz) |
||
|
Linear Spacing |
Logarithmic Spacing |
Mel Spacing |
|
|
1 |
2 |
2.0005 |
2.5798 |
|
2 |
1,3 |
0.0321, 2.0316 |
1.2476, 2.9208 |
|
3 |
0.6667,2.0, 3.3334 |
0.0084,0.1339, 2.1260 |
0.8058,1.7133, 3.1335 |
|
4 |
0.5, 1.5, 2.5, 3.5 |
0.0045,0.0356, 0.2831,2.2515 |
0.5915,1.1911, 2.0492,3.2772 |
|
5 |
0.4, 1.2, 2.0, 2.8, 3.6 |
0.0031,0.0164, 0.0863,0.4532, 2.3807 |
0.4661,0.9066, 1.5006,2.3012, 3.3804 |
|
6 |
0.3333,1.0, 1.6667,2.3333, 3.0,3.6667 |
0.0025,0.0099, 0.0396,0.1576, 0.6280,2.5020 |
0.3841,0.7295, 1.1757,1.7520, 2.4964,3.4580 |
|
7 |
0.2857,0.8571, 1.4286,2.0, 2.5714,3.1429, 3.7143 |
0.0021,0.0070, 0.0228,0.0747, 0.2442,0.7986, 2.6116 |
0.3264,0.6092, 0.9630,1.4056, 1.9592,2.6519, 3.5184 |
|
8 |
0.25,0.75, 1.25,1.75, 2.25,2.75, 3.25,3.75 |
0.0019,0.0054, 0.0152,0.0428, 0.1208,0.3407, 0.9607, 2.7092 |
0.2838,0.5225, 0.8138,1.1693, 1.6031,2.1325, 2.7785, 3.5668 |
-
C. Mel Frequency Spacing:
The mel scale is a perceptual scale of pitches judged by listeners to be equal in distance from one another.The reference point between this scale and normal frequency measurement is defined by assigning a perceptual pitch of 1000 mels to a 1000Hz tone, 40dB above the listener’s threshold. Above about 500Hz, increasingly large intervals are judged by listeners to produce equal pitch increments. As a result, four octaves on the hertz scale above 500Hz are judged to comprise about two octaves on the mel scale. The name mel comes from the word melody to indicate that the scale is based on pitchcomparisons. In frequency domain the subjective perception of speech is non-linear for this mel –frequency spacing can be used. A mel-scale is a non –linear scale by dividing the frequency range into 31 bands as proposed in [10].The mel is a psychoacoustic unit of measure for the perceived pitch by the human ear. The mapping between the mel scale and the real frequencies is non-linear human ear.
A popular formula to convert f hertz into m mel is
m = 2595 logw(1 + ^) (8)
The centre frequencies [9] for the corresponding frequency spacing methods are given in Table 1.
-
IV. Results And Conclusions
This section gives the performance evaluation of the proposed method with three different frequency spacing methods (linear, mel, log), by using four number of bands. Simulations were performed in the MATLAB environment. NOIZEUS is used as a speech corpus which is available at [16] and used by the most of the researchers, containing 30 sentences of six different speakers, three are male and other three are female speakers originally sampled at 25 KHz and down sampled to 8 KHz with 16 bits resolution quantization. Clean Speech is distorted by eight different real-world noises (babble, airport, station, street, exhibition, restaurant, car and train) at three distinct ranges of input SNR (0dB, 5dB, 10dB). In this algorithm speech sample is taken from a male speaker, English sentence is ”we can find joy in the simplest things”. In Simulation, the speech signal is divided into frames of 20 ms duration using Hamming window with 50% overlapping. An accurate method to evaluate speech quality in presence of Noise is through Subjective Listening tests but it is more time consuming. Subjective listening tests can be conducted according to ITU-T [16]. To predict speech quality of speech enhancement techniques in presence of noise several objective quality measures are available in the literature. Comparison of original clean speechand enhanced speech signals by a group of listeners on a predetermined scale is known as subjective quality evaluation [18]. One can use objective evaluation to quantify the quality between the original clean and enhanced speech signals using mathematical equations [19]. This paper presents the performance evaluation based on different quality measures which are Cepstrum Distance [17], Log Likelihood Ratio [19], Weighted Spectral Slope Distance (WSSD) [19], segmental-SNR [20] and Perceptual Evaluation of Speech Quality (PESQ) [16],[24] measures.
-
A. Cepstrum Distance(CD)
Log Spectral distance between two spectra based on cepstrum coefficients. A measure based on cepstrum coefficients can be calculated as [17]
CD(cx,cx) = l2XPk=i(Cx(k) - Cs(k))2 (9)
lOylU x
Cepstrum Coefficients of the clean and enhanced signals are given by C x (K) and Cx(K)and the cepstrum values were limited in the range of [0,10].
-
B. Log Likelihood Ratio(LLR)
LLR(a^, a^ = log (^Nl) (10)
v x , x axRxa j
&x , cl X are the LPC coefficients of the Clean and enhanced signals. Rx is the autocorrelation matrix of the Clean signal .In LLR denominator term is always lower than numerator therefore LLR is always positive [19]and the LLR values are in the range of (0-2).
-
C. Weighted Spectral Slope Distance(WSSD)
This measure can be evaluated as the weighted difference between the spectral slopes in each band can be computed using first order difference operation[19].Spectral slopes in each band of clean and enhanced signals are given by
PESQ=4.754-0.186D ind -0.008 A ind (13)
WSSD = ^ZM=0
Z f =1 w (],m) (Xx (],m) -xx (J,m))2
T^wum)
-
D. Segmental SNR (seg-SNR)
To improve the correlation between clean and processed speech signals summation can be performed over each frame of the signal [20] this results in segmental SNR and this leads better results when compared to global SNR. The segmental Signal-to-Noise Ratio (seg-SNR) in the time domain can be expressed as
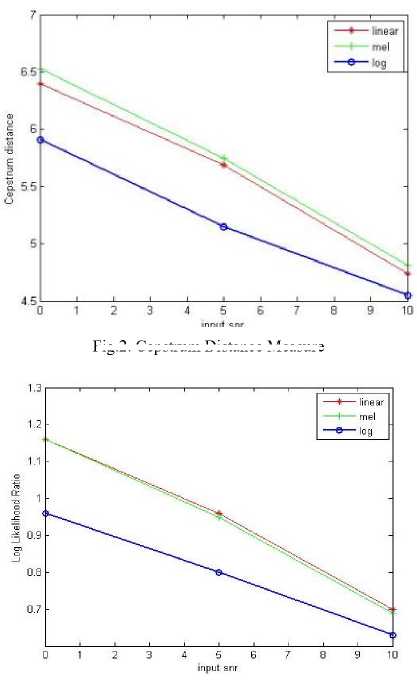
Fig.2. Cepstrum Distance Measure
Nm+N-1 2
CMP — iryM-1 ^ n=NM __ x (n)
S N Rseg = M ^=0 log i 0 INmN +N-i (x(n)- $ (n)) 2 (12)
Here x(n)represents the original clean speech signal. x(n)is the enhanced signal, frame length is given by N and the number of frames is given by M.The geometric mean of all frames of the speech signal is seg-SNR [19], seg-SNR was limited in the range of [-10, 35dB] .
-
E. Perceptual Evaluation Of Speech Quality (PESQ)
One among the objective quality measures which provides an accurate speech quality recommended by ITU_T [16], [24] which involves more complexity in computation. A linear combination of average asymmetrical disturbance A ind and average disturbance D ind is given by PESQ.
Fig.3. Log Likelihood Measure
40_________________i_________________i_________________i_________________i_________________i_________________i_________________i_________________i_________________i_________________
0 1 23456789 10
input snr
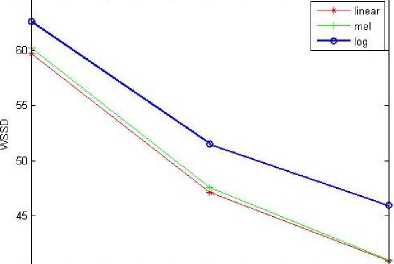
Fig.4. WSSD Measure
segmental SNR
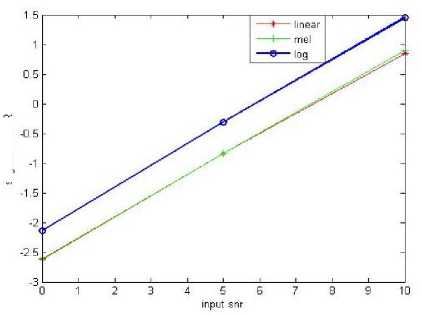
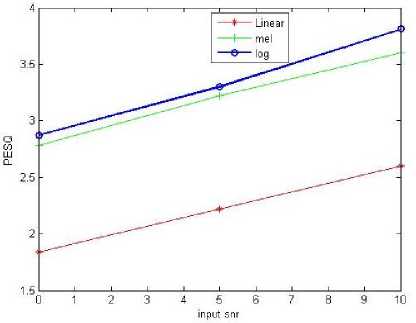
Fig.6. PESQ Measure
Fig.5. Segmental SNR Measure
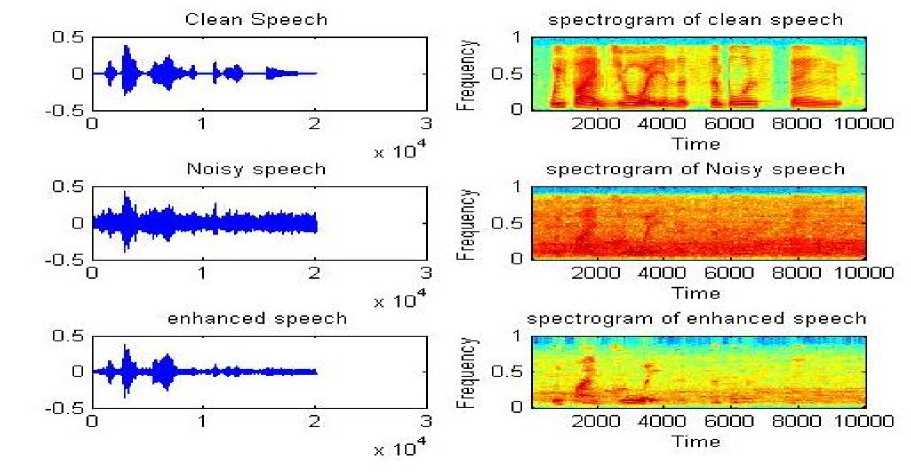
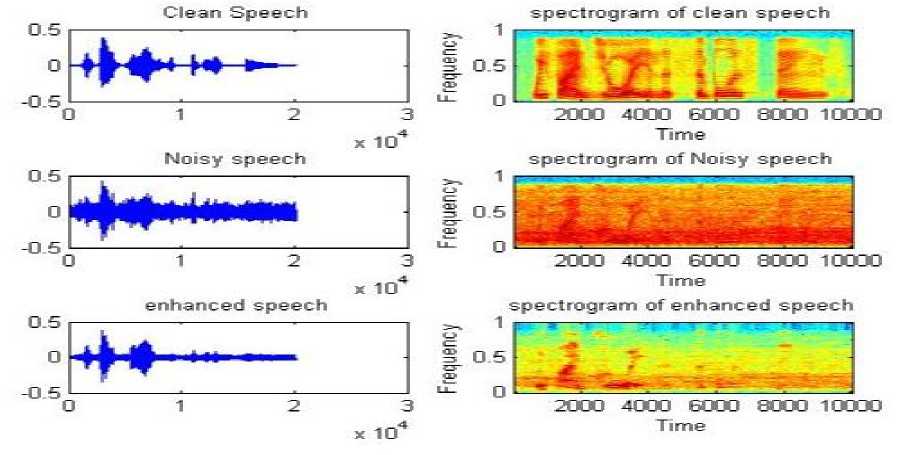
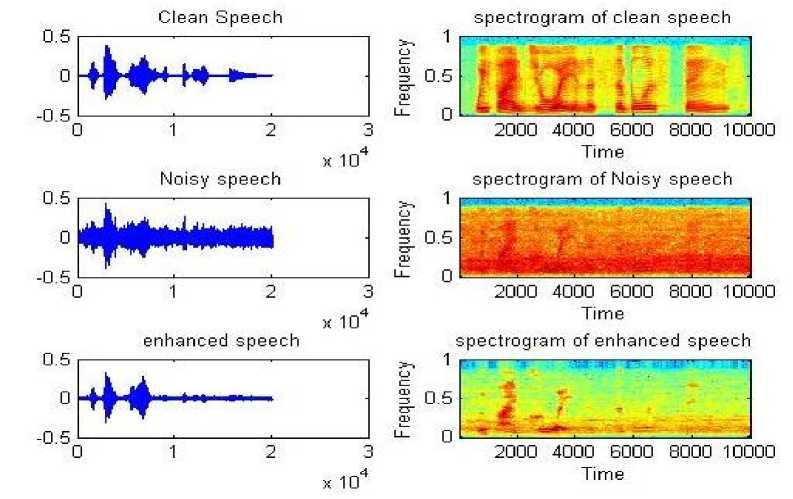
Fig.7. Time domain and spectrogram representation of Clean ,Noisyand enhanced speech signals for linear,mel and logarithmic frequency spacing
Table.2 Performance measures of proposed method with three different frequency spacing methods using Four bands
|
Type Noise |
SNR (dB) |
CD |
LLR |
WSSD |
Segmental SNR |
PESQ |
||||||||||
|
Linear |
mel |
log |
Linear |
mel |
log |
Linear |
Mel |
Log |
Linear |
Mel |
Log |
Linear |
mel |
log |
||
|
Airport Noise |
0dB |
6.65 |
6.86 |
6.03 |
1.15 |
1.17 |
0.90 |
57.0 |
58.6 |
59.5 |
-2.18 |
-2.20 |
-1.75 |
1.86 |
1.84 |
1.98 |
|
5dB |
5.01 |
5.07 |
4.93 |
0.74 |
0.75 |
0.68 |
52.8 |
52.3 |
57.2 |
-1.12 |
-1.14 |
-0.80 |
2.44 |
2.44 |
2.52 |
|
|
10dB |
4.75 |
4.76 |
4.67 |
0.79 |
0.72 |
0.65 |
45.7 |
44.8 |
54.6 |
1.18 |
1.26 |
1.70 |
2.55 |
2.56 |
2.55 |
|
|
Babble Noise |
0dB |
6.47 |
6.59 |
6.14 |
1.18 |
1.18 |
1.01 |
61.0 |
61.3 |
64.2 |
-2.60 |
-2.60 |
-2.17 |
1.82 |
1.82 |
1.87 |
|
5dB |
5.77 |
5.81 |
4.61 |
0.98 |
0.99 |
0.87 |
46.2 |
47.0 |
49.3 |
-0.54 |
-0.55 |
-0.23 |
2.23 |
2.22 |
2.23 |
|
|
10dB |
4.59 |
4.62 |
4.51 |
0.66 |
0.68 |
0.61 |
39.8 |
39.8 |
46.1 |
0.58 |
0.57 |
1.28 |
2.71 |
2.72 |
2.72 |
|
|
Car Noise |
0dB |
6.45 |
6.65 |
5.6 |
1.21 |
1.19 |
0.88 |
49.7 |
50.2 |
48.4 |
-2.45 |
-2.48 |
-1.96 |
1.75 |
1.75 |
1.95 |
|
5dB |
5.76 |
5.99 |
5.01 |
1.02 |
1.02 |
0.74 |
40.6 |
40.6 |
41.4 |
-0.04 |
-0.07 |
0.45 |
2.20 |
2.18 |
2.38 |
|
|
10dB |
4.89 |
5.04 |
4.42 |
0.76 |
0.77 |
0.58 |
34.7 |
35.3 |
37.5 |
1.57 |
1.53 |
2.24 |
2.62 |
2.61 |
2.74 |
|
|
Exhibit ion Noise |
0dB |
6.49 |
6.5 |
5.49 |
1.28 |
1.23 |
0.95 |
50.0 |
51.3 |
52.2 |
-2.16 |
-2.16 |
-1.40 |
1.65 |
1.64 |
1.88 |
|
5dB |
5.73 |
5.89 |
5.04 |
1.01 |
1.01 |
0.77 |
42.8 |
44.6 |
47.5 |
-0.28 |
-0.31 |
1.74 |
2.21 |
2.21 |
2.27 |
|
|
10dB |
4.98 |
5.07 |
4.49 |
0.78 |
0.79 |
0.63 |
44.1 |
44.7 |
47.1 |
0.93 |
0.89 |
1.62 |
2.48 |
2.49 |
2.42 |
|
|
Restaur ant Noise |
0dB |
5.82 |
5.96 |
5.68 |
0.95 |
0.97 |
0.88 |
67.0 |
66.4 |
70.6 |
-3.29 |
-3.27 |
-2.69 |
2.01 |
2.01 |
2.03 |
|
5dB |
6.05 |
6.07 |
5.98 |
0.93 |
0.95 |
0.91 |
59.1 |
59.9 |
68.5 |
-2.18 |
-2.18 |
-1.87 |
2.18 |
2.19 |
2.11 |
|
|
10dB |
4.64 |
4.71 |
4.59 |
0.63 |
0.67 |
0.63 |
48.6 |
47.9 |
59.0 |
-0.01 |
-0.01 |
0.25 |
2.65 |
2.67 |
2.67 |
|
|
Station Noise |
0dB |
6.39 |
6.44 |
6.46 |
1.12 |
1.12 |
1.14 |
78.0 |
77.7 |
85.8 |
-3.51 |
-3.57 |
-3.19 |
1.75 |
1.75 |
1.77 |
|
5dB |
5.81 |
5.87 |
5.03 |
1.04 |
1.03 |
0.75 |
44.3 |
43.5 |
45.7 |
-0.54 |
-0.55 |
-0.32 |
2.16 |
2.17 |
2.42 |
|
|
10dB |
5.17 |
5.38 |
4.83 |
0.78 |
0.83 |
0.66 |
42.5 |
43.5 |
47.2 |
1.50 |
1.95 |
2.96 |
2.69 |
2.66 |
2.70 |
|
|
Street Noise |
0dB |
6.52 |
6.71 |
5.99 |
1.22 |
1.20 |
0.99 |
55.4 |
56.1 |
60.8 |
-2.75 |
-2.76 |
-2.23 |
1.76 |
1.70 |
1.86 |
|
5dB |
5.69 |
5.61 |
5.39 |
0.93 |
0.90 |
0.85 |
49.3 |
48.8 |
56.9 |
-1.95 |
-1.93 |
-1.61 |
2.14 |
2.14 |
2.14 |
|
|
10dB |
4.01 |
3.97 |
3.96 |
0.59 |
0.57 |
0.58 |
34.6 |
33.9 |
35.5 |
-0.15 |
-0.19 |
-0.26 |
2.59 |
2.60 |
2.60 |
|
|
Train Noise |
0dB |
6.32 |
6.26 |
5.97 |
1.17 |
1.14 |
1.01 |
53.7 |
54.0 |
59.7 |
-1.96 |
-2.02 |
-1.73 |
2.09 |
1.73 |
1.64 |
|
5dB |
5.66 |
5.65 |
5.18 |
1.01 |
0.97 |
0.82 |
41.9 |
43.6 |
45.6 |
0.01 |
0.01 |
0.13 |
2.13 |
2.14 |
2.29 |
|
|
10dB |
4.9 |
4.9 |
4.75 |
0.72 |
0.71 |
0.66 |
37.4 |
38.1 |
40.6 |
1.16 |
1.16 |
1.83 |
2.51 |
2.51 |
2.47 |
|
is closer to clean speech for logarithmic and mel frequency spacings.
References Multi band spectral subtraction for speech enhancement with different frequency spacing methods and their effect on objective quality measures
- Boll, S.F,” Suppression of acoustic noise in speech using spectral subtraction”. IEEE Transactions on Acoustics Speech and Signal Processing, 1979, 27(2), 113–120.
- Berouti, M.,Schwartz, R.,Makhoul, J., "Enhancement of Speech Corrupted by Acoustic Noise”, Proc ICASSP 1979, pp.208-211.
- Emphraim,Y. and Malah,D. ‘Speech enhancement using a minimum mean square error short time spectral amplitude estimator, IEEE Trans. Acoustics, Speech and Signal Processing, 1984 ,32(6)1109-1121.
- Virag,.N, “Single channel speech enhancement based on masking properties of the human auditory system”, IEEE Trans. Speech Audio Processing, 1997, 126-137.
- Sovka,P., Pollak,P., and Kybic,J., “Extended spectral subtraction, proceedings on European conference on Signal Processing Communication, 1996, Trieste, Italy, pp. 963-966.
- He,C. and Zweig,G., “Adaptive two–band spectral subtraction with multi window spectral subtraction”, proceedings on IEEE Conference on Acoustics, Speech and Signal Processing, 1999, Phoenix, AZ, pp.793-796.
- Gustafsson,H., Nordholm,S. and Claesson,I., “Spectral Subtraction using Reduced delay convolution and adaptive averaging”, 2001, IEEE Trans. Speech Audio Processing, 9(8), 799-807.
- Lockwood,P. and Boudy,.J, ”Experiments with a non-linear spectral subtractor (NSS), Hidden Markov Models and the projections, for roboust recognition in cars, Speech Communication 11 (2-3), 215-228.
- Kamath S., Loizou P., “A multiband spectral subtraction method for enhancing speech corrupted by colored noise”, Proc. IEEE Intl. Conf. Acoustics, Speech, Signal Processing, 2002.
- Stevens, Stanly Smith, Violmann, John & Newman, and Edwin,B.,” A Scale for the measurement of the psychological Magnitude pitch”, Journal of the Acoustical Society of America. 8(3):185-190. 1937.
- Stevens,S. & Volkmann,J. “The relation of pitch to frequency: A revised Scale “,American Journal of Psychology.53(3), 329-353, 1940.
- T.J.Moir and J.F.Barret, “A Kepstrum Approach to filtering, smoothing and prediction with application to speech enhancement, Proc. Royal Society, 459,2957-2976,2003.
- Philipos, C.Loizou, “Speech Enhancement”: Theory and Practice, 2ndedition, CRC Press, 2013.
- Navneet Upadhyay, Abhigit Kumar, “Single-Channel Speech Enhancement Using Critical –Band Rate Scale Based Improved Multi-Band Spectral Subtraction” Journal of Signal and Information Processing, 2013, 4, 314-326.
- ITU_T Rec, “Perceptual evaluation of speech quality(PESQ), An objective method for end to end speech quality assessment of narrowband telephone networks and speech codecs”. International Telecommunications Union, Geneva Switzerland, February 2001.
- A Noisy Speech Corpus for Assessment of Speech Enhancement Algorithms. https:// ecs. utdallas. edu/ Loizou /speech/ noizeous
- Yi,.Hu and LoizouP.C., "Evaluation of Objective Quality Measures for Speech Enhancement," IEEE Transactions on Audio, Speech and Language Processing, vol.16,no.1,pp.229-238,Jan.2008.
- Quackenbush.S, Barnwell.T and Clements.M, Objectives measures of Speech quality, Englewood liffs, NJ: Prentice Hall.
- Klatt,D. (1982), Prediction of perceived phonetic distance from Critical band spectra, proceedings of the IEEE International Conference on Acoustics, Speech and Signal Processing, vol.7, pp.1278-1281.
- Mermelstein,.P (1979) Evaluation of segmental SNR measure as an indicator of the quality of ADPCM coded speech, J.Acoust. Soc. Am., 66(6), 1664-1667.
- Jianfen Ma, Yi Hu and Philipos C.Loizou, “Objective Measures for Predicting Speech Intelligibility in Noisy Conditions Based on New Band-important functions”, Journal of Acoustical Society America, Vol. 125, No. 5, pp. 3387-3405, May 2009.
- Y.Hu and P.Loizou, “Evaluation of objective quality measures for Speech enhancement,” in Proc. Inter speech, 2006, PP.1447-1450.
- “Application Guide for Objective quality measurement based on recommendations P.862, P.862.1 and P.862.2”, ITU_T rec. P.862.3, 2005.
