Multi-Metric Based Face Identification with Multi Configuration LBP Descriptor

Author: Djeddou Mustapha, Rabai Mohammed, Temmani Khadidja
Journal: International Journal of Image, Graphics and Signal Processing(IJIGSP) @ijigsp
Article in issue: 1 vol.4, 2012.
Free access
This paper deals with the performance improvement of a mono modal face identification. A statistical study of various structures of the LBPs (Local Binary Patterns) features associated to two metrics is performed to find out those committing errors on different subjects. Then, during the identification stage, these optimal variants are used, and a simple score level fusion is adopted. The score fusion is done after min-max normalization. The main contribution of this paper consists in the association of multiple LBP schemes with different metrics using simple fusion operation. The overall identification rating up to 99% using AT&T database is achieved.
Face identification, Local Binary Pattern, Chi-squared metric, Log-likelihood metric, scores level fusion.
Short address: https://sciup.org/15012214
IDR: 15012214
Text of the scientific article Multi-Metric Based Face Identification with Multi Configuration LBP Descriptor
Published Online February 2012 in MECS
In the late 90s, face recognition has blossomed with the development of new algorithms allowing the transition from research to commercialization [1-3]. To increase the identification rate and to avoid the limited performance of mono modal recognition approaches; many recognition systems emerged using fusion of different multimodal recognition, multiple algorithms, etc. Many systems are proposed in the literature fusing face and other modalities. In [4-5] the authors have suggested hybrid biometric person identification based on acoustic and visual features. The fusing of the two modalities is done after a normalizing step. In [6], to deal with the non reliability of face recognition, the authors associated the face and the fingerprints for an automatic personal identification. In [7], the authors proposed a probabilistic combination of face and gait cues for identification. Other authors combined face and ear images [8]. More homogenous modalities are proposed in [9] where face and iris biometrics are combined for identity verification. To alleviate some of the drawbacks of individual matchers by providing multiple evidence of the same identity, the fusion of more than two modalities can be found in the literature. In [10], the authors address the problem of information fusion on combining three biometric modalities: face, fingerprint and hand geometry. In [11], a multimodal biometric system using face, voice and lip is presented. One of the challenges, in fusing many classifiers, is the choice of fusion strategy. If this latter is inefficient, the combined results will not give the desirable result and may fall in between the best and the poor fusing classifiers. In addition to the question of how to fuse, another question raises here: how many classifiers to fuse? In many practical cases, the combinations lead to prohibitive computational load increase limiting their use in many multimedia supports. Furthermore, this involves the use of expensive equipment for each modality augmenting thus, the cost of the system. To overcome the high complexity and costs of multimodal systems, one should use an efficient algorithm for feature extraction and use a simple fusion strategy within the same algorithmic background.
Among these algorithms, LBP (Local Binary Patterns) approach is known to improve the performance and speed of identification. In fact, the extracted features are integers better suited for implementation in different digital media.
In this paper, a fusion approach based only on merging various configurations applying two metrics is presented. This has the advantage to use the same algorithmic background to achieve a high identification with reduced computational load.
In this work, the identification is ensured by measuring the distance between histograms obtained by applying LBP operator. Two metrics, the statistical Loglikelihood and the Chi-squared, are considered. To improve the identification performance, a score level fusion of different configurations of the LBP features is realized. This paper is organized as follows: in section II, the face-recognition framework is introduced; a description of used features and modeling is given. In section III, an overview of the data set used for conducting experiments is described. The fusion strategy in section IV is presented. In section V, some preliminary results are shown. At last, concluding remarks are drawn in section VI.
-
II. Face recognition framework
-
A. Local Binary Patterns descriptor
In any recognition system, the extracted parameters play a decisive role in the performance of the classifiers. Hence, it is important to derive representative features with tolerance against class intra variability while keeping high discrimination in between different classes. Another important issue is the simplicity of extraction from the raw images. Furthermore, it is desirable for the extracted features to laying in low-dimensional space.
The LBP descriptor was mentioned for the first time in [12] to measure the local contrast of an image. Ojala et al.[13] popularized it three years later for analysis and classification of textures.
The main reasons for the success of these parameters are the high discriminative power, thanks to capturing different textures, tolerance against illumination changes and a low computational load. The extraction principle consists in comparing the pixel luminance against its neighbor levels. This reflects information on regular patterns in the image that is a texture. Depending on the scale of the used neighborhood, this descriptor detects some areas of interest such as corners or edges. The basic LBP operator assigns a label to each pixel of the image by applying a threshold to the 3 × 3 local neighbors from the central pixel. The result is a binary number [14-15]. Figure. 1 depicts the procedure for calculating a label by the basic LBP method [16].
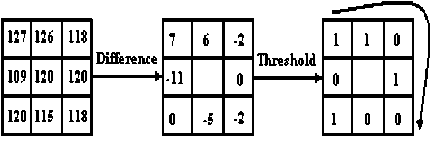
Figure. 1 LBP Pattern construction (11010010) 2 =210 using basic LBP descriptor
Ojala et al. [14] extends the LBP operator by taking local neighbors located on a circle of radius R . This variant method, noted LBP ( P, R ) , is used to better distinguish between gray levels.
The following formula gives the coordinates of each neighboring pixel [17]:
I
2nn x = xc + Rcos (—^~) 2
у = yc + R s ЬЦ—))
central pixel C of coordinates (xc,yc), and its P -neighbors.
Figure. 2 shows the neighboring pixels used by the operator by varying the number P and radius R .
Referring to the equation (1), possibility for some details not to be located on a single pixel is to consider. In this case, a bilinear interpolation of intensity values of neighboring pixels should be done [17].
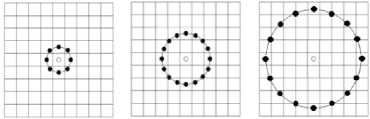
Figure. 2 (8, 1), (16, 2) and (16, 4) LBP configurations.
Another extension of the LBP descriptor is the uniform LBP. A uniform pattern is defined as a pattern with two transitions at 01 or 10 [16]. Only ((P — 1) P + 2) out of 2p are uniform LBP patterns but it is found experimentally that 90% of motifs found in the images are uniform. Experience showed that not considering the non uniform patterns do not affect the descriptor performance [17].
The LBP operator is applied to each pixel instead of describing the image by the LBP patterns; the data will be reduced by constructing a histogram.
-
B. Histogram modeling and metrics
We cut the image in a regular grid (as in figure. 3) and calculate a histogram on each cell. Therefore, all the histograms are concatenated to describe the image. This operation is repeated for every person in the database. The size of sub blocks forming the grid depends on the image resolution.
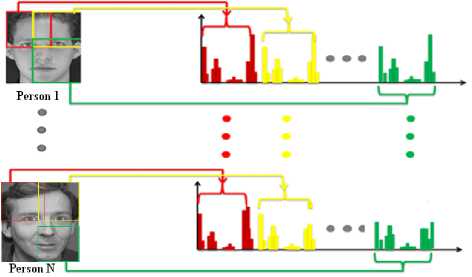
Figure. 3 Sub blocks histogram concatenation for every person in the data base.
Identification is done by measuring the distance between test image histogram and all database models. Two metrics are considered, the statistical Loglikelihood metric (equation (2)) and the Chi-squared one (equation (3)).
Where P is the number of pixel neighbors included in the comparison, and R is the distance between the
к * к Р(Р- 1)+з
L (5,М) = ^(-^
7=11=1
к * к Р(-1 1)+3
X2 (5,М) = ^(^
7=11=1
StjlogM^
(S ij — МцУ (S tj +M tjy
Where S is the test sample vector and M is a vector model.
-
III. database and identification framework
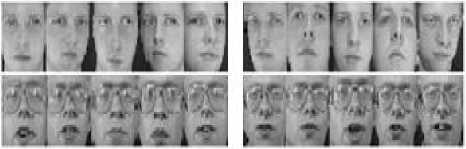
Figure. 4 Image example used for enrollment (right) and test image (left).
To evaluate the identification performance of a system, the computation of the identification rate is needed. For this, each person's enrollment images is modeled by calculating their histogram patterns (LBP application). The same calculations to test images are applied. Afterwards, we calculate the distance between the histogram of a given test image and that of all models using the metrics. Figure. 5 sketches the identification framework using the measure of distance between histograms.
First, there is a need to find out the number of blocks to consider. For this, a study is conducted by calculating the rate of identification of each configuration by varying the number of considered regions using the two metrics separately. The remaining experiments are carried out by taking the best-obtained number of regions.
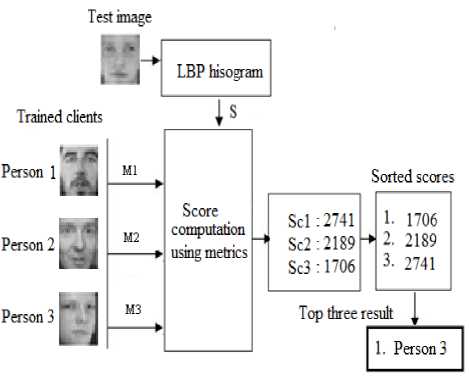
Figure. 5 Identification framework
Figure. 6 sketches histogram's models of three subjects using only one block (left side) and 16 blocks (right side). Clearly, using one block the histogram loses its discriminatory power as all the three histograms are merely identical. This is not the case when using more blocks.
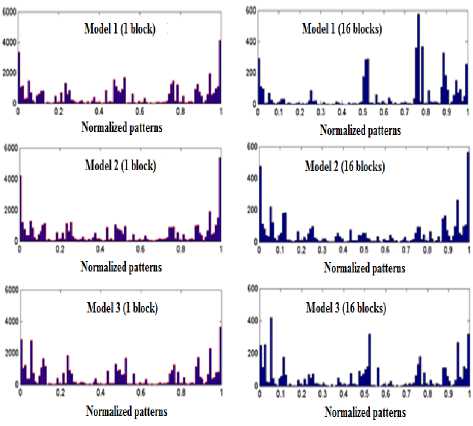
Figure. 6 LPB patterns histograms for three subjects using one block (right) and 16 blocks (left).
-
IV. Fusion strategy
To control the configurations to merge, a statistical study of clients falsely identified by each configuration must be made. Then, the configurations giving errors on different subjects of database are merged. A normalization step of the two vectors distance (distance of each test pattern over 200 enrollment models) is necessary to ensure they belong to the same range of variations, see [19-20] for more details on fusion issue. The standard min-max normalization is the adopted technique [21]. The principle is based on applying equation (4).
By scores {5c k }, к = 1,2, .„, n , we get the normalized scores by:
Sc - min{Sck } max{Sck} -min{Sck}
Then the two normalized vectors are summed, and the identification rate according to the new vectors is calculated. For the case of fusing the two different metrics, the following procedure is adopted:
-
• Apply the best configuration scheme of the LBP descriptor to the test image for the two considered metric ;
-
• Compute the scores for both metrics for all data set subjects ;
-
• Normalize the sorted scores using equation (4);
-
• Fuse the metric results giving scores for subjects that are marked as different ;
-
• Sort the normalized scores;
-
• Identify the unknown person.
Figure. 7 reports this procedure taking the case of three subject's model image and a test image.
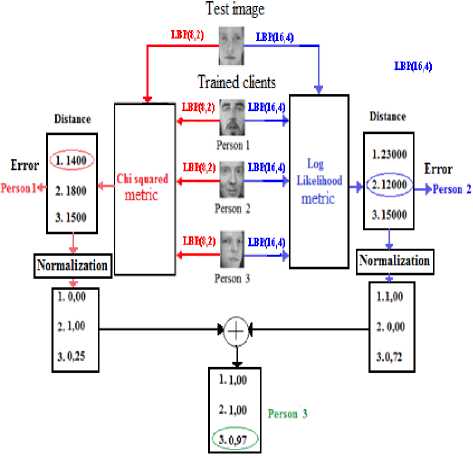
Figure. 7 Example of two configurations fusion combined with two different metrics.
-
V. Preliminary results and discussion
An identification performance study based on the number of regions considered to describe LBP pattern is first conducted. The satisfactory number of regions is the one giving the highest identification rate for each LBP pattern variant. In table. 1, only the adequate number of blocks and the corresponding identification rate that achieves the higher rate for the considered metric is reported. Furthermore, the persons giving the erroneous identification are reported in the same table. The data set persons numbering is noted s n/i , where n stands for the index of the person and i the index of the person erroneously identified.
In the upcoming performance study, the optimal number of blocks leading to the higher identification rate is used. We first merge the LBP configurations two by two using the statistical Log-likelihood metric for measuring distance between histograms. We report the results in table. 2.
The same operation using the Chi-squared metric is performed, and the results are presented in table. 3. Tables 2 and 3 show that the fusing of two variants with different LBP radii increases the identification rate. These reflect the fact that information extracted by configuration variants is uncorrelated, and therefore, are complementary. Same remark applies to configurations not considering the same number of neighbors. We notice that we can achieve a high identification rate for many two by two configurations especially using the statistical Log-likelihood metric. Of course, the scores are merged using the arithmetic fusion procedure.
At the end, the fusion of LBP combined variants using a statistical Log-likelihood metric in one hand with those obtained using a Chi-squared metric is realized.
We also exclusively use the metric results giving scores for subjects that are marked as different. Only interesting results are drawn in table. 4.
According to the obtained results in tables 2, 3 and 4, there are a choice for adopting the final identification strategy.
Indeed, an identification rate of 99% by two ways is achieved: the first using fusion of two different configurations but with the same metric and the second way by fusing two configurations using different metrics and different configurations. In both cases, the same algorithmic background is used.
-
VI. Conclusion
In this paper, we deal with face identification based on extracting LBP features. A decision by considering two metrics the statistical Log-likelihood and the Chi-squared is made.
Table. 1 Optimal number of blocks and identification rate for considered configurations.
|
Log-likelihood metric |
Chi-squared metric |
||||
|
Configuration |
Optimal |
Identification |
Erroneous identification |
Identification |
Erroneous identification |
|
number of |
rate |
rate |
|||
|
regions |
|||||
|
LBPg ,4 |
(4×4) |
96.5% |
s3/07; s3/08; s5/10; s9/07 ; s17/10; s28/08 ; |
96.5% |
s3/07; s3/08; s5/10; s9/07; s17/10; s28/08; |
|
s40/09 |
s40/09 |
||||
|
LBPg , 2 |
(6×6) |
96% |
s3/08; s3/07 ; s4/06; s9/07 ; s17/10; s35/06 ; s40/07; s40/09 |
97% |
s1/08; s9/07; s10/09; s17/06; s28/8; s40/09 |
|
LBPg , 3 |
(4×4) |
95.5% |
s4/06; s5/10; s17/06; s17/07 ; s17/09; s17/10 ; s26/07; s36/10; s40/09 |
97% |
s5/10; s9/07; s10/10 ;;. s17/6 ; s17/10 ; s40/09 |
|
LBPg ,4 |
(4×4) |
97.5% |
s5/10 ; s9/07 ; s10/10 ; s28/08 ; s40/09 |
97.5% |
s5/10 ; s9/07 ; s10/10 ; s28/08 ; s40/09 |
|
LBP1 6 ,4 |
(3×3) |
96.5% |
s3/07 ; s4/06 ; s9/07 ; s17/10 ; s28/08 ; s31/07 ; |
96.5% |
s3/07 ; s4/06 ; s9/07 ; s17/10 ; s28/08 ; s31/07 ; |
|
s40/09 |
s40/09 |
||||
|
LBP, 6,2 |
(2×2) |
96% |
s3/07 ; s4/06 ; s5/08; s5/10 ; s16/10 ; s21/08 ; |
96% |
s3/07 ; s4/06 ; s5/08; s5/10 ; s16/10 ; s21/08 ; |
|
s35/06; s40/06 |
s35/06; s40/09 |
||||
|
LBP1 6,3 |
(3×3) |
98% |
s17/06 ; s17/07 ; s17/10; s40/09 |
98% |
s17/06 ; s17/07 ; s17/10; s40/09 |
|
LBP1 6,4 |
(2×2) |
98.5% |
s5/10 ; s21/08 ; s40/9; |
98.5% |
s5/10 ; s21/08 ; s40/9; |
Table. 2 Identification rate after fusion between different configurations using Log-likelihood metric
|
Log-likelihood metric |
||
|
LBPg ,2 LBPgi3 LBP4 ,4 LBP6 6,4 LBP6 6,2 LBP6 6,3 LBP6 6,4 |
||
|
Q nS О О Л ьо о н-1 |
LBPg , 4 |
96.5% 97.5% 97% 97% 97% 97% 98% |
|
L В Рд, 2 |
97% 98.5% 96.5% 96% 97% 99% |
|
|
LBPg ,3 |
97% 97% 99% 97.5% 99% |
|
|
LBPg ,4 |
98% 99% 99% 98% |
|
|
LBP, 6,4 |
96.5% 96% 98.5% |
|
|
LBP, 6,2 |
98% 99% |
|
|
LBP, 6,3 |
98% |
|
Table. 3 Identification rate after fusion between different configurations using Chi-squared metric
|
Chi-squared metric |
||
|
LBP3,2 LBP ,3 LBP ,4 LBPL6,1 LBPL6,2 LBPL6,3 LBPL6,T1 |
||
|
.о е 45 р cd 1 о |
LBP8 ,1 |
96.5% 97.5% 97.5% 96.5% 96.5% 97% 98% |
|
LBP8 ,2 |
97.5% 98.5% 97.5% 98% 98% 98.5% |
|
|
LBP$ ,3 |
96.5% 97.5% 97.5% 97.5% 98.5% |
|
|
LBP$ ,4 |
97.5% 97.5% 98.5% 99% |
|
|
LBP16 ,1 |
95% 97.5% 98.5% |
|
|
LBP 16 ,2 |
98% 98.5% |
|
|
LBP 16 ,3 |
98.5% |
|
Table.4 Identification rate after metric fusion between different configurations
|
Log-likelihood metric |
|||||||||
|
LBP (8,1) 96.5% |
LBP (8,2) 96% |
LBP (8,3) 95.5% |
LBP (8,4) 97.5% |
LBP (16,1) 96.5% |
LBP (16,2) 96% |
LBP (16,3) 98% |
LBP (16,4) 98.5% |
||
|
LBP (8,1) 96.5% |
96.5% |
95% |
97.5% |
97% |
97% |
97% |
97% |
98% |
|
|
0 E "0 0 5 u* и 0 |
LBP (8,2) 97% |
97% |
97.5% |
98% |
98% |
97.5% |
98% |
98% |
98.5% |
|
LBP (8,3) 97% |
97.5% |
98% |
97% |
97% |
97.5% |
97.5% |
97% |
99% |
|
|
LBP (8,4) 97.5% |
97.5% |
99% |
97.5% |
97% |
98% |
98.5% |
98.5% |
99% |
|
|
LBP (16,1) 96% |
97% |
96% |
96.5% |
97.5% |
96% |
95.5% |
96% |
98.5% |
|
|
LBP (16,2) 98% |
97% |
98.5% |
97.5% |
98.5% |
97.5% |
98.5% |
98% |
99% |
|
|
LBP (16,3) 98.5% |
97.5% |
99% |
98% |
98.5% |
97.5% |
98% |
98% |
98% |
|
Acknowledgment
The authors would like to thank the anonymous reviewers for their valuable comments.
References Multi-Metric Based Face Identification with Multi Configuration LBP Descriptor
- R. Gross, S. Baker, I. Matthews, T. Kanade, Face Recognition Across Pose and Illumination, Handbook of Face Recognition, Stan Z. Li and Anil K. Jain, ed., Springer-Verlag, June, 2004.
- Z. Riaz,, A. Gilgiti, S. M. Mirza, Face recognition: a review and comparison of HMM, PCA, ICA and neural networks. ETech 2004 41-46, 2004.
- W. Zhao, R. Chellappa, A. Rosenfeld, P.J. Phillips, Face Recognition: A Literature Survey, ACM Computing Surveys, 2003, pp. 399-458
- R. Brunelli and D. Falavigna, “Person identification using multiple cues,” IEEE Transactions on Pattern Analysis andMachine Intelligence, 1995.
- N. Poh and J. Korczak, “Hybrid biometric person authentication using face and voice features,” in In Proc. AVBPA, 2001, pp. 348–353.
- L. Hong and A. Jain, “Integrating faces and fingerprints for personal identification,” IEEE transactions on pattern analysis and machine intelligence, vol. 20, pp. 1295–1307, 1998.
- G. Shakhnarovich and T. Darrell, “On probabilistic combination of face and gait cues for identification,” in Proc. of the Int. Conf. on Automatic Face and Gesture Recognition, 2002, pp. 169–174.
- K. Chang, K. W. Bowyer, S. Sarkar, and B. Victor, “Comparison and combination of ear and face images in appearance-based biometrics,” IEEE Trans. Pattern Analysis and Machine Intelligence, vol. 25, pp. 1160–1165, 2003.
- Y. Wang, T. Tan, and A. K. Jain, “Combining face and iris biometrics for identity verification,” in AVBPA, 2003, pp. 805–813.
- A. Ross, A. K. Jain, and J. Qian, “Information fusion in biometrics,” Department of Computer Science, Michigan State University, East Lansing, Michigan, Tech. Rep. MSU-CSE-01-18, May 2001.
- R. Frischholz and U. Dieckmann, “Bioid: A multimodal biometric identification system,” vol. 21, no. 2, pp. 64–68, February 2000.
- D. Harwood, T. Ojala, M. Pietikäinen, S. Kelman, S. Davis Texture classification by center-symmetric auto-correlation, using Kullback discrimination of distributions. Technical report, Computer Vision Laboratory, Center for Automation Research, University of Maryland, College Park, Maryland. CAR-TR-678. 1993.
- T. Ojala, M. Pietikäinen, D. Harwood A comparative study of texture measures with classification based on feature distributions. Pattern Recognition 29: 51–59, 1996.
- T. Ojala, M. Pietikäinen, and T. Mäenpää, “Multiresolution Grayscale and Rotation Invariant Texture Classification with Local Binary Patterns,” IEEE Transactions on Pattern Analysis and Machine Intelligence, vol. 24, no. 7, 2002, pp. 971:987.
- T. Ahonen, A. Hadid, and M. Pietikainen, Face Recognition with Local Binary Patterns, In: T. Pajdla et J. Matas (Eds.): ECCV 2004, LNCS 3021, pp. 469–481, Springer, Heidelberg, 2004.
- T. Ahonen, A. Hadid, and M. Pietikainen, “Face Description with Local Binary Patterns: Application to Face Recognition,” IEEE Transactions on Pattern Analysis and Machine Intelligence, vol. 28, no. 12, 2006, pp. 2037:2041.
- A. Ganesh, Evaluation of Appearance Based Methods for Facial Expression Recognition, master thesis, Technische Universiteit Eindhoven, 2008
- http://www.cl.cam.ac.uk/research/dtg/attarchive/ facedatabase.html
- A. Jain, K. Nandakumar, A. Ross Score normalization in multimodal biometric systems. Pattern Recognition 38, 2270-2285, 2005.
- Mingxing He, Shi-Jinn Horng, Pingzhi Fan, Ray-Shine Run, Rong-Jian Chen, Jui-Lin Lai, Muhammad Khurram Khan, and Kevin Octavius Sentosa. Performance evaluation of score level fusion in multimodal biometric systems. Pattern Recogn. 43, 5 2010, 1789-1800.
- Y. N. Singh, and P. Gupta, Quantitative Evaluation of Normalization Techniques of Matching Scores in Multimodal Biometric Systems, S.-W. Lee and S.Z. Li (Eds.): ICB 2007 LNCS 4642, pp. 574–583, Advances in Biometrics, Springer, 2007.
