Multi-spectral image processing for the measurement of a spatial temperature distribution on the surface of a laser-heated microscopic object

Author: Bulatov Kamil M., Mantrova Yuliya V., Bykov Alexey A., Machikhin Alexander S., Gaponov Maxim I., Zinin Pavel V., Troyan Ivan A., Batshev Vladislav I., Kutuza Igor B.
Journal: Компьютерная оптика @computer-optics
Section: Дифракционная оптика, оптические технологии
Article in issue: 6 т.41, 2017.
Free access
In this paper, we demonstrate that combining a laser heating (LH) system with a tandem acousto-optical tunable filter (TAOTF) allows us to measure the temperature distribution (TD) across a laser-heated microscopic specimen. Spectral image processing is based on one-dimensional (1D) non-linear least squares fitting of the Planck radiation function. It is applied for determining the temperature T at each point ( x, y ) of the specimen surface. It is shown that spectral image processing using the 1D non-linear least squares fitting allows measurement of the TD of the laser-heated microscopic specimen with higher precision and stability than those of the conventional linear least-squares fitting of the Wien approximation of Planck’s law.
Laser heating, diamond anvil cell, temperature measurement, acousto-optical tunable filter, spectral imaging
Short address: https://sciup.org/140228682
IDR: 140228682 | DOI: 10.18287/2412-6179-2017-41-6-864-868
Text of the scientific article Multi-spectral image processing for the measurement of a spatial temperature distribution on the surface of a laser-heated microscopic object
In laser-machining applications, a laser beam is used as a heat source. This allows a rapid increase in temperature, which causes melting and evaporation of the substrate material [1]. LH is one of the main tools in the study of minerals and synthesis of new materials under high pressure and high temperature in a diamond anvil cell (DAC) [2].
If a regular spectrometer is used to measure radiation emitted from a heated material, it is only possible to estimate the temperature of the heated spot averaged over its area. This works perfectly only for a uniform TD, however, the temperature under a laser has significant non-uniformity. For many applications, such as experiments on measuring acoustical wave velocities under high temperatures [3, 4] and studying phase transitions under high pressure and high temperatures of carbon materials [5, 6], it is important to know the TD on the surface of a solid heated by a laser. Recently the twodimensional (2D) distribution of the surface temperature of a millimeter-sized object was measured using TAOTF [7]. A set of spectral images (up to a few hundred) was taken by the TAOTF imaging system in order to fit the measured spectral curves in each pixel to the Planck radiation function and to determine the temperature. In these experiments, the TD of a tungsten filament heated by a constant current from a stabilized current source was measured. In [7], TD was measured from a relatively large area of 2.5×2.5 mm2. However, it is a challenge to measure the 2D TD inside a spot with a size of several microns heated by a laser beam. Collected thermal radia- tion of the lamp is much higher compared to that of the LH, where the area is around 15×15 µm2. In this paper, we developed (a) a microscopic setup that combines LH and a TAOTF imaging system, and (b) an algorithm for fast multispectral image processing to demonstrate that the TAOTF imaging technique is an effective tool for measuring the 2D TD on the surface of solids heated by a powerful laser.
Method
An experimental LH-TAOTF setup operating in the reflection mode is shown in Fig. 1.
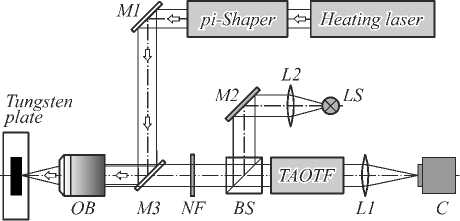
Fig. 1. The sketch of the LH-TAOTF system
The sample (tungsten plate) is fixed on a remotely controlled motorized xyz-stage (Standa 8MVT40-13). The wide-band image of the specimen is obtained by an optical system based on a long working distance infinity-corrected objective ×10 OB, beam splitter BS, mirror M2 and a LED-based light source LS. A 100 W fiber laser (1064 nm, IPG Photonics) is coupled with a π-shaper to allow precise control of the LH spot shape (e.g., gauss, flat-top, donut [8]). To align the laser beam, mirrors M1 and M3 are uti- lized. A 1064 nm notch filter (NF) is used to cut off light from the reflected laser beam from the camera sensor. The beam of the heating laser is focused on the sample by a long working distance objective OB. Irradiation from the specimen passes through the TAOTF and is then focused by a long focal distance (f =400 mm) lens L1 on the camera sensor C (Allied Vision Mako G-030B).
A detailed description of the TAOTF operation can be found elsewhere [7, 9, 10]. Briefly, the main component of the system is an imaging TAOTF synchronized with a video camera. A set of TAOTF spectroscopic images (up to a few hundred) is taken by the TAOTF imaging system in order to fit the measured spectral curves in each pixel to the Planck radiation function and to determine the temperature and emissivity of the sample using the gray body approximation. A single AOTF has already been used for one-point temperature measurements [11]. Strong chromatic drift and spatial aberrations of the spectral images caused by a conventional single-AOTF imaging system complicate accurate spectral measurements in each pixel [12]. To overcome this problem, we used the TAOTF. [13] shows that the TAOTF system combines reliable spectral imaging with several important features: absence of spatial distortions and chromatic drift; high spectral contrast; and increased signal-to-noise ratio. In the TAOTF imaging system, the image captured by the camera represents a distribution of the intensity irradiated by a specimen at a given wavelength λ controlled by the TAOTF [7].
The temperature of a heated specimen can be determined by measuring the radiation emitted by a material as a function of wavelength and fitting the experimental data to the Planck’s blackbody equation (see [14, 15] for details):
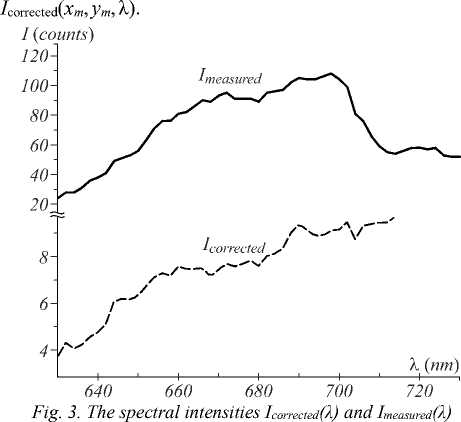
A tungsten ribbon-filament lamp is used as a known source of spectral radiance I standard (λ). Radiometric calibration is based on the registration of the illumination of the certified lamp operating at a temperature of 1720 K. The lamp is placed at the position normally occupied by the sample so that the spectral intensity I optics (λ) of the lamp and the specimen I measured (λ) is acquired through the same optical pathways. To determine the spectral radiance of the heated specimen I corrected (λ), the following equation is used:
I corrected (λ) = I measured (λ) × I standard (λ) / I optics (λ).
Image processing
I ( % , e , T ) = e g ( % , T ) , g ( % , T ) = ^
%
c 1
exp( cr) "1
, (1)
where I is the spectral intensity, e is the sample emissivity, c 1 and c 2 are physical constants ( c 1 = 2π c 2 , c 2 = hc / k = 0.01432 m - K), c is the velocity of light, h is the Planck’s constant, and k is the Boltzman constant . For temperatures lower than 4000K eq. (1) can be simplified without a loss of accuracy [16]. It was shown that a leastsquares fit of the spectrum at four wavelengths (600 nm, 650 nm, 700 nm, and 750 nm) yielded a temperature estimate that is accurate to within 5 % for temperature less than 7000 K.
The number of the TAOTF images I measured ( x i , y i , λ j , j = 1.. N ) is N =75. Exposure time for a single image is 83 µs. The collected array I M ( x i , y j , λ k ) is used to determine a segment of the Planck’s law I correct-ed (λ k ) in the range 610-760 nm at each pixel ( x i , y j ). Fig. 3 shows a collected spectrum, I measured ( x m , y m , λ), at the point ( x m , y m ) taken at a point near the maximal temperature and
I ( % , e , T )
e c 1
.
% 5 exp —
I % T
Eq. (2) is called the Wien’s law. Defining a normalized intensity J= ln( I % 5/ c i ), Wien’s law can be expressed as a linear equation in 1/ T
c
J ( % , e , T ) = ln e- -^.
% T
Images at different wavelengths (from 610 nm to 760 nm with constant spectral step 2 nm) are collected by the camera C to determine temperature intensity of the thermal radiation at the each pixel ( x i , y i ) of the camera. An image taken at 635 nm is shown in Fig. 2.
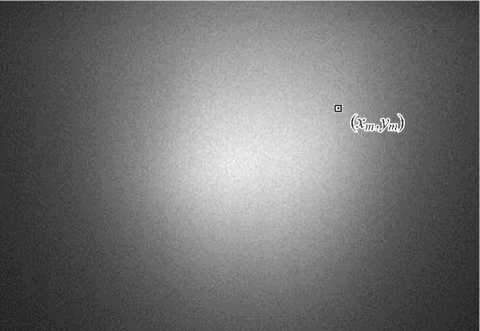
Fig. 2. TAOTF spectral image (635 nm) of the tungsten plate in vacuum under LH. Laser power is 8 W
Fitting experimental results using Wien’s law (3) may give a systematic error of temperature determination because of the fact that the least-square method is applied to the logarithm of the experimental data. To get an unbiased estimation of the temperature, it should be determined by fitting corrected spectral experimental data (4). The proper method of determining T from the experimentally determined I corrected (λ k ) data is to find such values of T and £ at which the function
N
S ( £ , T ) = Д I ( % i ) -£ g ( % i , T ) ] , (5) i = 1
has a minimum (2D non-linear least square fitting). For temperatures lower than 4000 K, the Wien approximation is widely used to derive TW( x i , y j ) at a single pixel ( x i , y j ) where TW is the temperature determined using Wien approximation. The linear least-square fitting at the point ( x m , y m ) is demonstrated in Fig. 4. Position of the point ( x m , y m ) is shown in Fig. 2.
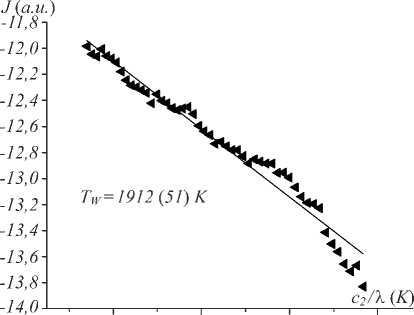
Fig. 4. Fitting of the experimental data using Wien’s law at the point (x m , y m ). Laser power is 8 W.
Number in brackets is standard deviation
Processing of I corrected ( x m , y m , λ) data revealed that the Wien’s approximation gives reasonable results in the center of the heated spot where temperature is high. In the area outside of the heated spot, the low signal-to-noise ratio leads to significant error in temperature determination (see Fig. 4). To decrease the effect of statistical error on the temperature determination, we introduce a more stable least-squares fitting procedure. It is based on the fact that emissivity £ in (1) is a linear parameter. We know that if the function S ( T , £ ) has a minimum at T 0 and £ 0, then the following conditions should be satisfied: 1) d S/ d£ | e = e 0 , T = t 0 =0 ; 2) d S/ d T | e _ e 0 , T = t 0 =0 . The first equation gives the value of £ 0:
N
Я I ( % i ) g ( % i , T ) ]
£ o = ^------------ . (6)
g 2 ( % i , T i = 1
The second equation can be written as
Ц =- ? c/i г [ i ( % i ) g ( % i , t ) -£ o ]= 0. (7)
V T T i = 1 % i
Equation (5) has a root when the function S T has a minimum:
e _ I N 1 Г I ( % i ) g ( % i , T )
ST = 1^ X"
- 1
.
£ o
i = 1
Therefore, the procedure described above reduces the problem of 2D non-linear least square fitting, eq. (5), to 1D non-linear least square fitting, eq. (8). Fig. 5 shows the behavior of the sum S T at the point ( x m , y m ) as a function of temperature T .
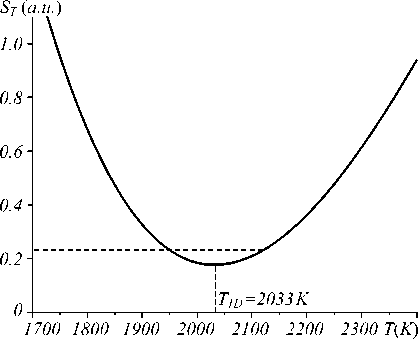
Fig. 5. St as a function of temperature (Tid = 2033 ± 49 K)
The ST has a sharp minimum at T1D = 2033 K where T1D denotes the temperature determined using the 1D nonlinear least square fitting. To determine a confidence interval of the temperature T1D we use a standard technique for non-linear regression described in [17]. For this, we plot S as a function of temperature around point T1D. A confidence interval is defined by taking S(T) = constant, where the constant is determined by S(T) = S(T0)[1+p/(n– p)xF(n,p, a)], where p is the number of parameters, n is the number of experiments, F(n,p, a) is the Fisher parameter, and a is the confidential probability. This gives ± 105 K for the confidence interval for the temperature in Fig. 5 with a 0.95 level of confidence. The confidence interval for the Wien’s fitting can be determined using standard deviation (51 K) and Student’s coefficient 1.99 for 75 measurements 51*1.99/ 75 = 14 K. It is ten times smaller than that obtained by 1D minimization. Nevertheless, we consider the latter to be the correct and effective method to determine the TD under LH of a microscopic specimen for two reasons. First, finding a minimum of eq. (8) is the correct way to determine temperature using Planck’s law, whereas the use of Wien’s law for fitting experimental data assumes logarithm transformation of the original data. Secondly, the 1D fitting gave similar results to those obtained using Wien’s fitting only inside the area with a high temperature (hot spot). Near the edge of the heated area and away from the heated spot, the Wien’s fitting often gives a temperature higher than that in the center. In contrast, the 1D fitting gives reasonable values for the temperature. Fig. 6 shows the result of 1D fitting applied to the whole set of spectral images obtained during LH of the tungsten plate. Calculated TD over the heated surface is significantly non-uniform. It has a maximum at 2100 K and minimum at around 1650 K.
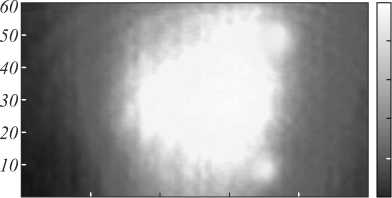
Fig. 6. The 2D TD on the surface of the tungsten plate heated by a laser. Power of the laser is 8 W
It is possible to compare results of the temperature measurements based on the thermal radiation with those determined on resistivity measurements. For this, we conducted experiments where the heating of the lamp was induced by an electrical current, and temperature of the tungsten lamp can be estimated using measurement of its resistivity, R . We call the temperature obtained by this method as T R . The resistivity of the lamp increases as the temperature rises, R = R o (1 + α T R ), where R o is the resistivity at 273 K, and α is the thermal resistivity coefficient of tungsten (taken from a table of the physical constants). Therefore, the expression for the temperature of the lamp as a function of resistivity has a simple form: T R =( R – R o )/ α R o . Resistivity R o and R can be determined by measuring the voltage, V , and the current, i , of the lamp during the experiment at the room temperature and during the heating: R = V / i . Fig. 7 illustrates the behavior of the T 1D , T W, and T R as a function ofelectrical current.
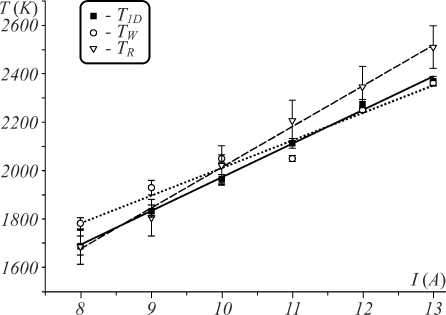
Fig. 7. Behavior of the T1d (filled squares), Tw (open circles) , and Tr (open triangle) as a function of the electrical current I
As it is seen from Fig. 7, the T W is higher than the T 1D at low currents, and therefore at low temperatures. The higher the temperature, the closer T W is to T 1D . T R is in a good coincidence with T 1D at a lower temperature and becomes higher at high temperatures.
Conclusion
It is demonstrated that spectral image processing using 1D minimization of function (8) allows TD measurement of the microscopic specimen under LH with better precision and stability than conventional least-square method (5) applied to the logarithm function (3). In addition, the 1D fitting gave similar results to those obtained using Wien’s fitting only inside the area with a high temperature (hot spot). Near the edge of the heated area and away from the heated spot, the Wien’s fitting often gives a temperature higher than that in the center. In contrast, the 1D fitting gives reasonable values for the temperature. Experiments with a homogenous tungsten plate heating demonstrate that TD T(x, y) over the heated surface is significantly non-uniform and reaches a maximum at 2100 K and a minimum around 1650 K. In this study, we assume that the variation of the specimen’s emissivity is small over the spectral tuning range 610–760 nm and measured temperature range.
In this study, we did not address emissivity measurements which require additional calibrations and verifications that are currently under development.
References Multi-spectral image processing for the measurement of a spatial temperature distribution on the surface of a laser-heated microscopic object
- Magunov AN. Spectral pyrometry (Review). Instruments and Experimental Techniques 2009; 52(4): 451-472.
- Bassett WA. The birth and development of laser heating in diamond anvil cells. Rev Sci Instrum 2001; 72(2): 1270-1272 DOI: 10.1063/1.1343861
- Zinin PV, Prakapenka VB, Burgess K, Odake S, Chigarev N, Sharma SK. Combined laser ultrasonics, laser heating, and Raman scattering in diamond anvil cell system. Rev Sci Instrum 2016; 87(12): 123908 DOI: 10.1063/1.4972588
- Burgess K, Prakapenka V, Hellebrand E, Zinin PV. Elastic characterization of platinum/rhodium alloy at high temperature by combined laser heating and laser ultrasonic techniques. Ultrasonics 2014; 54(4): 963-966 DOI: 10.1016/j.ultras.2014.01.011
- Zinin PV, Kudryashov I, Konishi N, Ming LC, Solozhenko VL, Sharma SK. Identification of the diamond-like B-C phases by confocal Raman spectroscopy. Spectrochim Acta A Mol Biomol Spectrosc 2005; 61(10): 2386-2389 DOI: 10.1016/j.saa.2005.02.017
- Zinin PV, Ming LC, Ishii HA, Jia R, Acosta T, Hellebrand E. Phase transition in BCx system under high-pressure and high-temperature: Synthesis of cubic dense BC3 nanostructured phase. J Appl Phys 2012; 111(11): 114905 DOI: 10.1063/1.4723275
- Machikhin AS, Zinin PV, Shurygin AV, Khokhlov DD. Imaging system based on a tandem acousto-optical tunable filter for in-situ measurements of the high temperature distribution. Opt Lett 2016; 41(5): 901-904 DOI: 10.1364/OL.41.000901
- Prakapenka VB, Kubo A, Kuznetsov A, Laskin A, Shkurikhin A, Dera P, Rivers ML, Sutton SR. Advanced flat top laser heating system for high pressure research at GSECARS: application to the melting behavior of germanium. High Press Res 2008; 28(3): 225-235 DOI: 10.1080/08957950802050718
- Machikhin AS, Pozhar V, Batshev V. Double-AOTF-Based aberration-free spectral imaging endoscopic system for biomedical applications. J Innov Opt Health Sci 2015; 8(3): 1541009 DOI: 10.1142/S1793545815410096
- Machikhin AS, Shurygin AV, Pozhar VE. Spatial and spectral calibration of an acousto-optical spectrometer. Instrum Exp Tech 2016; 59(5): 692-697 DOI: 10.1134/S0020441216040217
- Kozlova O, Sadouni A, Truong D, Briaudeau S, Himbert M. Tunable transportable spectroradiometer based on an acousto-optical tunable filter: Development and optical performance. Rev Sci Instrum 2016; 87(12): 125101 DOI: 10.1063/1.4968818
- Pozhar V, Machikhin AS. Image aberrations caused by light diffraction via ultrasonic waves in uniaxial crystals. Appl Opt 2012; 51(19): 4513-4519 DOI: 10.1364/AO.51.004513
- Machikhin AS, Pozhar VE. Spatial and spectral image distortions caused by diffraction of an ordinary polarised light beam by an ultrasonic wave. Quantum Electron 2015; 45(2): 161-165 DOI: 10.1070/QE2015v045n02ABEH015385
- Heinz DL, Sweeney JS, Miller P. A laser heating system that stabilizes and controls the temperature: Diamond anvil cell applications. Rev Sci Instrum 1991; 62(6): 1568-1575 DOI: 10.1063/1.1142434
- Ribaud G. Traité de pyrométrie optique: Encyclopédie photométrique. Paris: Ed De La Revue Optique Theorique Et Instrumentale; 1931.
- Heinz DL, Jeanloz R. Temperature measurements in the laser-heated diamond cell. In Book: Manghnani MH, Syono Ya, Eds. High-pressure research in mineral physics: A volume in honor of Syun-iti Akimoto. Washington: American Geophysical Union; 1987: 113-127 DOI: 10.1029/GM039p0113
- Draper NR, Smith H. Applied Regression Analysis. New York: John Wiley & Sons; 1966. ISBN: 0471221708.
