New Algorithm for Fractal Dimension Estimation based on Texture Measurements: Application on Breast Tissue Characterization

Author: Kamila Khemis, Sihem A. Lazzouni, Mahammed Messadi, Salim Loudjedi, Abdelhafid Bessaid
Journal: International Journal of Image, Graphics and Signal Processing(IJIGSP) @ijigsp
Article in issue: 4 vol.8, 2016.
Free access
Fractal analysis is currently in full swing in particular in the medical field because of the fractal nature of natural phenomena (vascular system, nervous system, bones, breast tissue ...). For this, many algorithms for estimating the fractal dimension have emerged. Most of them are based on the principle of box counting. In this work we propose a new method for calculating fractal attributes based on contrast homogeneity and energy that have been extracted from gray level co-occurrence matrix. As application we are investigated in the characterization and classification of mammographic images with SuportVectorMachine classifier. We considered in particular images with tumor masses and architectural disorder to compare with normal ones. We calculate, for comparison the fractal dimension obtained by a reference method (triangular prism) and perform a classification similar to the previous. Results obtained with new algorithm are better than reference method (classification rate is 0.91 vs 0.65). Hence new fractal attributes are relevant.
Fractal, Texture, Gray Level Co occurrence Matrix, Mammography, Classification, Support Vector Machine
Short address: https://sciup.org/15013965
IDR: 15013965
Text of the scientific article New Algorithm for Fractal Dimension Estimation based on Texture Measurements: Application on Breast Tissue Characterization
Published Online April 2016 in MECS DOI: 10.5815/ijigsp.2016.04.02
Following the introduction of fractal geometry by B. Mandelbrot who demonstrated that most of the natural objects have a fractal nature [1], medicine took full advantage of this new concept. Various applications using Fractal Dimension (FD) and fractal attributes (FA) have emerged: segmentation, classification, modeling...
Breast tissue is precisely of fractal nature and it is suitable to analysis it at this point of view in the aim of early detection of breast cancer. In fact, breast cancer continues to rank at the forefront of public health problems. So, early detection of mammographic tissues’ abnormalities is necessary to minimize the stresses due to the heavy support of this pathology. The accuracy of the detection is also relevant in a therapeutic irradiation. Many approaches have to be studied and compared to stop or reduce this pandemy.
Our research project is a part of the diagnostic aid chain. More precisely, we are interested in the characterization of mammographic pathological tissues by the use of new fractal attributes based on texture analysis.
This paper is organized in five sections. After Introduction in section I, we present, in section II, fractals and texture analysis. Section III, include some works based on mammography analysis using texture and fractal dimension. In section IV, the proposed approach is presented. Section V and VI, exposes respectively Results and Discussions; Finally, Section VII concludes the paper.
-
II. Fractales and Texture Analysis
-
A. Fractal Dimension
The first definition of fractal dimension is the Hausdorf dimension. In most practical situations, Hausdorf dimension uses to be complicate or even impossible to calculate. Thus, assuming that any fractal object is intrinsically self-similar, we may derive a simplified version, also called similarity dimension or capacity dimension:
D = - lOg(Nl (1) log( r )
Where N is number of rules with linear length r used to cover the object.
In practice, the above expression may be generalized by considering N as any kind of self-similarity measure and r as any scale parameter. This generalization gives rise to a lot of estimation methods for FD, with a broad application to the analysis of objects which are not real fractals (mathematically defined) but which present some degree of self-similarity in specific intervals [2]. To calculate the approximate FD several approaches are proposed in literature [3, 4, 5, 6]. We can classify them into three main approaches based respectively on the box counting, the area measurements and fractional Brownian motion (statistical approach).
For gray level images include among others the differential box counting, and methods based on a measure of area.
The choosing of method for FD estimation depends on the nature of image. We are interested with gray level textured images because it is the case of many medical images. So texture analysis must be taken into account.
-
B. Texture Analysis
Texture analysis, can be done without addressing the fractal nature of the image. Recall that texture implies the idea of uniformity and repeatability in the image to form the surface or internal structure of the object. And according to Haralick definition "a texture is described by a set of basic primitives (or patterns) and their spatial organization." [7]. Texture classification techniques are grouped up in five main groups in general, namely: structural, statistical, signal processing, model-based stochastic and morphology-based methods. Out of the five groups, statistical and signal processing methods are the most widely used because they can be directly applied onto any type of texture [8]. The Gray Level Coocurrence Matrix (GLCM) method is a way of extracting second order statistical texture features. Haralick defines fourteen textural features measured from the GLCM.
In the case of fractal approach based on texture analysis, there are mainly fractionnary Brownian Movement (FBM) and lacunarity estimation. FBM can be performed in spatial or frequency domain. Spatial approach is based on the use of Hurst parameter while frequency domain approach is based on the Fourier spectral power [9].
Finally, lacunarity is a fractal attribute that measures the distribution of holes in the image and according to some researchers the image texture is sufficiently characterized by the measure of lacunarity as a function of scale. Many methods were proposed, all of them deal with statistical measures [5].
As we have just specified our area of interest is medical imaging. We will evaluate our method on mammography since it was shown that the breast tissue has a similar nature to that fractal clouds. It should be remembered; however its textured nature and therefore the tool we propose should suit his analysis.
-
III. Mammography and Fractals
The analysis of mammographic images was widely investigated because it interest for early diagnosis of breast cancer which continues to rank at the forefront of public health problems. Several research teams have used the FD to identify breast disease. Two main axes were followed: characterization of the contour of lesions [10, 11] and characterization of region [12, 13].
We include here some researchers works based on mammography analysis using texture and fractal dimension. Main applications are for architectural distortion, tumor masses characterization and parenchymal texture analysis.
Guo et al. [14] developed a fractal-based method for texture characterization of mammographic mass lesions and architectural distortion. They used a combination of FBM (fractal Brownian Motion) fractal dimension and lacunarity.
Mavroforakis et al. [15] established a quantitative approach of mammographic masses texture classification, supported by fractal analysis of the dataset of the extracted textural features. A set of textural feature functions was applied on mammograms, in multiple configurations and scales, constructing "signatures" for benign and malignant cases of tumors. Fractal analysis was employed to compare the information content and dimensionality of the textural features datasets with the qualitative information provided through medical diagnosis.
Characterization of architectural disorder has also been the subject of several researches with the single use of fractal dimension or of the fractal dimension and texture analysis.
Tourassi et al. [16] was interested by the characterization of Architectural Distortion (AD). Fractal dimension (FD) of mammographic regions of interest was calculated using the circular average power spectrum technique.
Banik et al. [17] have taken statistics measures of Haralick (contrast, homogeneity, energy and entropy) and FD for characterization of breast tissue in order to detect initial candidates for sites of architectural distortion in prior mammograms of interval-cancer and also normal cases. FD estimation was a frequency domain approach (conversion of 2D Fourier spectrum to 1D signal as a function of distance to zero-frequency) and selected five features sum average, node value, difference variance, contrast.
Characterization was also performed in parenchymal texture analysis which is associated with breast cancer risk [18, 19, 2] and micro calcifications [20, 21].
For all pre-cited works, classification was performed with the main following tools: Suport Vector Machine
(SVM); receiver operating characteristic (ROC) and Neural Network.
In the present work we compute fractal attributes based on three statistical measures of Haralick and compare the results with that obtained with the FD estimation of triangular prism (area approach).
-
IV. Matherial and Methods
To highlight the algorithm that we propose we compared with a reference method for gray level images (triangular prism). In this method gray level is considered as a third dimension and is given in the FD as a function of the prisms surfaces sum [22]. This method does not take account of the texture. In the particular case of breast images, the texture is a parameter that must be developed and most of the researchers are using texture features and add the fractal dimension that is often based on the box counting algorithm.
Our method has the merit of combining texture and fractal dimension. It provides fractal attributes based on texture analysis (Fig.1).
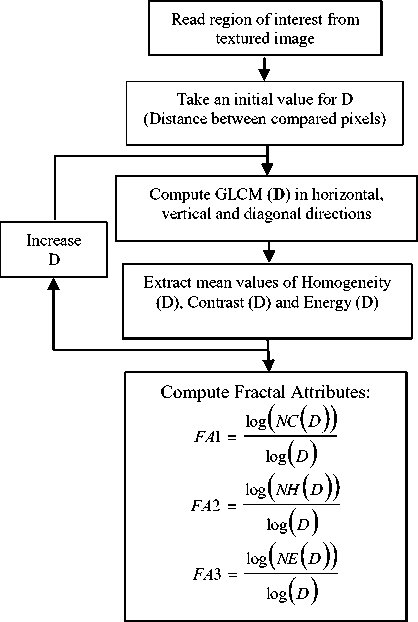
Fig.1. Organization chart of Fractal Dimension Estimations based on variation of distance D between compared pixels of GLCM.
First we take a region of interest in source image, then we extract the horizontal vertical and diagonal GLCM for a given distance D between compared pixels. Then we extract mean values of contrast, homogeneity and energy. Each texture attribute is related to distance D. We increase D and extract the corresponding texture attributes. The process is repeated four times with a step of 2 for D. The fractal attributes are calculated according to formula 1(§ II). For example contrast based fractal attribute is the slop of linear regression log (contrast)/log (D). We explain hereafter the construction principle of the GLCM and the choice of texture features.
-
A. Gray level Co-Matrix
A GLCM is a matrix where the number of rows and columns is equal to the number of gray levels, G, in the image.
The matrix element P (i, j | Δx, Δy) is the relative frequency with which two pixels, separated by a pixel distance (Δx, Δy), occur within a given neighborhood, one with intensity ‘i’ and the other with intensity ‘j’. The matrix element P (i, j | d, ө ) contains the second order statistical probability values for changes between gray levels ‘i’ and ‘j’ at a particular displacement distance d and at a particular angle ( ө ). Using a large number of intensity levels G implies storing a lot of temporary data, i.e. a G × G matrix for each combination of (Δx, Δy) or (d, ө ). Due to their large dimensionality, the GLCM’s are very sensitive to the size of the texture samples on which they are estimated. Thus, the number of gray levels is often reduced [17]. In our case we choose 5 levels.
Fractal analysis on the dimensionality of the textural datasets verified that reduced subsets of optimal feature combinations can describe the original feature space adequately for classification [14]. At the basis of this study we extracted only three statistical features from GLCM: contrast homogeneity and energy.
Contrast quantifies variation in image intensity, providing a measure of gray-level contrast between neighboring pixels over the entire image.
Energy is a measure of texture uniformity of the graylevel spatial distribution.
Homogeneity reflects the heterogeneity of the texture pattern and decreases with contrast [18].
These measurements are given respectively by the formulas:
Contrast = E i - j\ p(i, j)
p ( i , j )
Homogeneity = S---,----г i,j 1 + i- j\
Energy = S. P(i,j )2
i , j
-
B. Data Base
We use the miniMIAS database [23] with 1024x1024 resolution mammograms. This base contains normal mammograms and pathological ones. Normal tissues are classified into three categories: F (Fatty), G (fatty Glandular) and D (Dense glandular). Pathologies cover architectural disorganization, micro calcifications and tumor masses. Tumors are classified into three categories: CIRC (circumscribed well defined masses); SPIC (spiculated masses) and MISC (ill-defined masses).
In our application we took normal tissues, tumor masses and architectural disorganization.
When dealing with normal tissues we considered only one class covering all kinds of tissues.
Fractal attributes were performed on region of interest of normal mammograms, those with tumor masses and those with architectural disorganization. Fig. 2 shows a sample of such images.
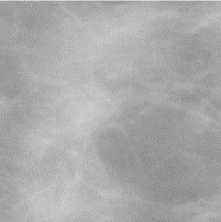
a. Normal tissue
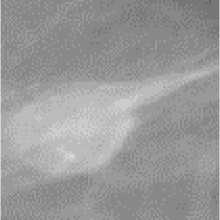
b. Tumor mass
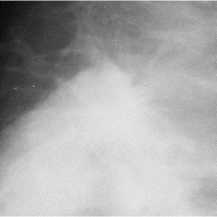
c. Architectural disorder
Fig.2. Region of interest of mammograms
Triangular prism based FD was applied on the same images.
The following step is classification and here we choose Support vector machines tool.
-
C. Classification
Supportvectormachines (SVMs) introduced byVladimirVapniken1995 are supervised learning models with associated learning algorithms that analyze data and recognize patterns used for classification and regression analysis. This technique is the most frequently used for solving the outlined problem of image classification.
SVM performs classification by constructing an N-dimensional hyperplan that optimally separates the data into two categories. The SVM models are closely related to neural networks. The support vector machines are known for their good performance in the processing of big data and also in computer aided diagnosis.
In this application we handle a multiclass task classification, which means a classification task with more than two classes. A OneVsOne method is used to constructs one classifier per pair of classes. At prediction time, the class which received the most votes is selected. Indeed, this method may be advantageous for algorithms such as kernel algorithms which don’t scale well with n samples.
To apply SVM we first devised our data to two classes as follow:
-
- Normal tissues versus tissues with tumor masses,
-
- Normal tissues versus tissues with architectural disorders,
Then we applied SVM with a random partition for 5fold cross-validation, where each partition is divided to 5 subsamples (folds), chosen randomly but with roughly equal size. Note that the number of partitions is reduced in our application because database is not very big. Then we display the Classification Rate (CR) which is the mean value obtained after 5 successive tests.
-
V. Results
We have taken normal breast, tumor masses and architectural disorder images of miniMIAS database. Then we calculated new fractal attributes (based on algorithm of Fig. 1) and FD based on Triangular Prism (area approach).
Table 1 gives a sample of FD and FA obtained for some normal/pathological images of MIAS data base. Images in this table are randomly chosen to give an order of magnitude of FD and FA. We can see that differentiation between classes is not obvious since we have three parameters as output of our algorithm.
Table 1. Fractal Attributes based on Contrast homogeneity and energy (FA Contrast, FA Homogeneity, FA Energy) and Fractal Dimension
(FD) with triangular prism of some MIAS images .(N: Normal; T Tumor; A: Architectural disorder).
|
FA Contrast |
FA Homogeneity |
FA Energy |
FD |
||
|
mdb020 |
N |
-0.69 |
-0.08 |
-0.87 |
2.23 |
|
mdb070 |
N |
-0.73 |
-0.07 |
-0.68 |
2.24 |
|
mdb040 |
N |
-0.84 |
-0.06 |
-0.78 |
2.38 |
|
mdb167 |
A |
-0.60 |
-.009 |
-0.58 |
2.25 |
|
mdb170 |
A |
-0.94 |
-0.05 |
-0.79 |
2.33 |
|
mdb165 |
A |
-0.57 |
-0.10 |
-0.73 |
2.23 |
|
mdb142 |
T |
-0.40 |
-0.80 |
0 |
2.32 |
|
mdb148 |
T |
-0.82 |
-0.06 |
-0.85 |
2.38 |
|
mdb058 |
T |
-0.33 |
-0.14 |
-0.85 |
2.33 |
Figures 3 and 4 shows respectively the fractal dimension obtained with triangular prism and fractal attribute obtained with new algorithm considering two classes: tumors / healthy tissue. For the sake of clarity, we consider in the plot, only the fractal contrast attribute.
It is found that, in visu , the new method allows better discrimination between the two classes.
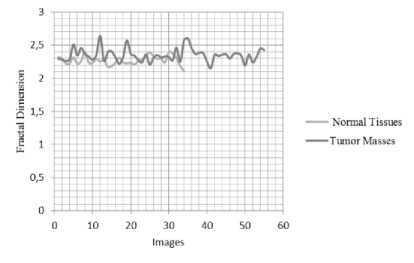
Fig.3. Fractal Dimension (Triangular Prism) for Normal Tissues/Tumor masses.
The next step is classification which permits the differentiation between normal tissues and pathological ones, given the three fractal attributes as input parameters. The classification rate is the output parameter which relates the quality of classification. So we use this parameter to compare our method with the reference one (Triangular Prism).
In this work we chose SVM classifier for its simplicity and robustness. Table 2 summarizes SVM classification rates with the three fractal attributes: contrast based FA, homogeneity based FA and energy based FA in comparison with single FD (Triangular Prism). We considered two binary classes: normal tissues/tumor masses and normal tissues/Architectural disorder.
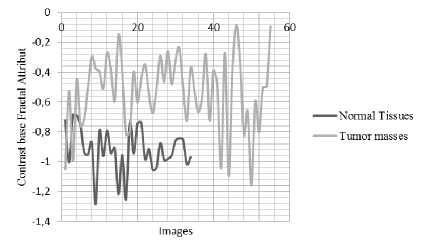
Fig.4. Contrast based Fractal Atribut (New algorithm) for Normal Tissues/Tumor masses.
Similarly, Figures 5 and 6 shows respectively the fractal dimension obtained with triangular prism and contrast based fractal attribute obtained with new algorithm considering two classes: Architectural disorder / Normal tissue.
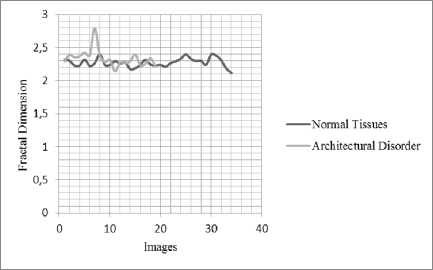
Fig.5. Fractal Dimension (Triangular Prism) for Normal Tissues/Architectural Disorder.
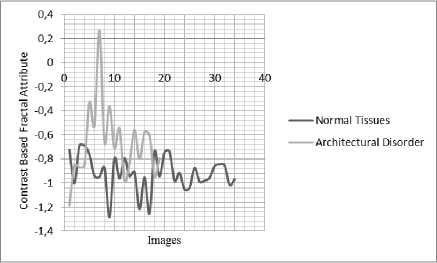
Fig.6. Contrast based Fractal Atribut (New algorithm) for Normal Tissues/Architectural Disorder.
Table 2. Classification rates of Normal/tumor and Normal/ Architectural disorder with the compared algorithms (triangular prism and new method).
|
Algorithm |
Normal/ Tumor |
Normal/ Architectural disorder |
|
Triangular Prism |
0.6510 |
0.6418 |
|
New method (GLCM) |
0.9098 |
0.6673 |
Moreover, we studied the effectiveness of Fractal dimension approach in characterization at a simple point of view: Since our algorithm derives from Haralick statistical measurements the question was did this calculation enhance characterization compared with pure statistical measures (those obtained directly from GLCM) [24]. Of course we consider the same attributes: contrast, homogeneity and energy.
The result is presented in Table 3. We can see that new algorithm gives better classification rates in both previously studied classes: Tumor masses vs Normal tissues and Architectural Disorder vs Normal tissues.
Table 3. Classification rates of Tumor masses/Normal and Architectural disorder/Normal with new algorithm based on Fractal Attributes and pure Haralick Statistical measurements.
|
Classification rates |
Tumor mass /Normal |
Architectural Disorder /Normal |
|
New Algorithm |
0.9 |
0.6 |
|
Haralick Statistical attributes |
0.8 |
0.5 |
In addition to this exposed work, we applied image enhancement before extraction of the several attributes. We noticed that classification rates and in most cases lower when performing this treatment. So in the present work no preprocessing was performed, but this do not mean it uselessness because we just tried a simple algorithm.
-
VI. Discussion
As explained above, we choose characterization of breast tissues as application and we consider in particular tumor masses architectural disorder and normal tissues. We give a sample of FD and FA of these tissues. In regarding the values the difference between normal tissues and pathological ones is not obvious. So we applied SVM classifier. We notice that the separability of tumor masses is good with a classification rate around 0.9 for the proposed algorithm and only with 0.6 for triangular prism witch do not take into account the texture of breast tissue. Moreover we studied effectiveness of fractal attributes and found that they enhance classification rate if compared with pure statistical approach.
Architectural disorder is lowly discriminated from normal tissues, but new algorithm is again more accurate with a classification rate of 0.67 versus 0.64. This low rate can be explained by the fact that this pathology is an early stage state. So, more parameters have to be used to distinguish it. In this case, image preprocessing can be of great interest to enhance differences between architectural disorder and normal tissues [25]. In addition to that point, we didn’t perform any segmentation to extract correctly and precisely the pathological tissue. We just took a region of interest (parameters given by MIAS) and in this region there were a little portion of normal tissue. This is also available for tumor case. So segmentation is a pertinent pre-processing tool for characterization [26].
In all cases more parameters have to be used in addition to that proposed to enhance classification rates as it is the case in literature. We did not try to do so in the present work because it is a difficult task and comparison with results of literature is also difficult because many variables have to be studied (source image, preprocessing, normalization) and other parameters are unknown (not précised by authors). For this reason we performed a single comparison with a reference algorithm that we computed and applied in the same conditions of ours’
Concerning execution time we obtained 0.07 s for Prism method and 0.11 s for new algorithm. This result was expected since we measure three parameters with new algorithm versus one for Prism. This is a little difference which is acceptable since the process is not done in real time.
-
VII. Conclusion
In this work, fractal attributes obtained from GLCM have been investigated to characterize breast tissues through the variation of distance between compared pixels in GLCMs. We choose three texture attributes contrast, homogeneity and energy; and calculate the corresponding fractal attributes. Here, a fractal attribute is the slope of the linear regression of log (texture attribute)/ log (distance). We applied our algorithm on MIAS database considering in particular normal mammograms, those with tumor masses and those with architectural disorder.
Then we used SVM classifier and obtained satisfying classification rates for tumor/normal tissues with the superiority for new proposed algorithm. Less classification rates are obtained for architectural disorder/normal tissues.
However, the choice of attributes could be judiciously changed (from GLCM). In addition to that, we can enhance the differentiation between classes by an automatic segmentation of lesion before extraction of FA.
More accurate results can be obtained by adding more parameters like contour attributes, color attributes (if dealing with colored images), lacunarity…
However, the proposed fractal attributes can be used to characterize any type of gray level textured image (medical or not) such as brain MRI.
Acknowledgment
The authors wish to thank Settouti Nesma for explanations on classification.
References New Algorithm for Fractal Dimension Estimation based on Texture Measurements: Application on Breast Tissue Characterization
- B. Mandelerot, les objets fractals, formes hazard et dimension. Edition Flammarion 1973.
- Joao B. Florindo, Odemir M. Bruno, Texture analysis and characterization using probability fracal descriptors, Instituto de Fisica de Sao Carlos (IFSC) Universidade de Sao Paulo, May 15, 2012.
- Zhou G., Lam, N. S, A Comparison of fractal dimension estimators based on multiple surface generation algorithms, Computers &Geosciences 31, 1260–1269. 2005.
- R. Lopez, Analyses fractale et multifractales en imagerie médicale : outils, validations et applications, thèse de doctorat, université de Lille 1, 2009.
- M. LEHAMEL, Segmentation d'images texturées à partir des attributs fractals, Ph.D. dissertation, Université Mouloud Mammeri de Tizi-Ouzou, 2010.
- R. Lopes R, N. Betrouni . Fractal and multifractal analysis: a review. Med Image Anal. 2009 Aug;13(4):634-49.
- RM. Haralick, Statistical and structural approaches to texture, Proceeding of IEEE, 67(5), pp. 786-804, 1979.
- Jing Yi Tou, Yong Haur Tay,, Phooi Yee Lau. Recent trends in texture classification: a review, Symposium on Progress in Information & Communication Technology 2009.
- Voss R.F. Random fractal forgeries. Earnshow RA (ed) Fundamental algorithms for computer graphics. Springer, Heidelberg, pp 805-83.
- S. Don, Duckwon Chung,K.Revathy,Eunmi Choi,Dugki Min, A Neural Network Approach to Mammogram Image Classification Using Fractal Features IEEE 2009
- S. Abdaheer.M., E. Khan Shaped based classication of breast tumors using fractal analysis, IEEE 2009
- Deepa Sankar, Tessammma Thomas, Analysis of Mammograms using Fractal Features, IEEE 2009.
- Daniela Alexandra CRISAN, Cristina COCULESCU, Justina Lavinia STANICA, Adam Nelu ALTAR SAMUEL, Using fractal techniques to reduce haziness in medical imaging, IEEE 2009.
- Guo Q, Shao J, Ruiz VF. Characterization and classification of tumor lesions using computerized fractal-based texture analysis and support vector machines in digital mammograms. Int J Comput Assist Radiol Surg. 2009 Jan.
- Mavroforakis ME, Georgiou HV, Dimitropoulos N, Cavouras D, Theodoridis S. Mammographic masses characterization based on localized texture and dataset fractal analysis using linear, neural and support vector machine classifiers. Artif Intell Med. 2006 Jun; 37(2):145-62. Epub 2006 May 23.
- Tourassi GD, Delong DM, Floyd CE Jr. A study on the computerized fractal analysis of architectural distortion in screening mammograms. Phys Med Biol. 2006 Mar 7; 51(5):1299-312. Epub 2006 Feb 15.
- Shantanu Banik, Rangaraj M Rangayyan, J. E. Leo Desautels Detection of Architectural Distortion in Prior Mammograms of Interval-cancer Cases with Neural Networks, 31st Annual International Conference of the IEEE EMBS Minneapolis, Minnesota, USA, September 2-6, 2009
- P. Mohanaiah, P. Sathyanarayana, L. GuruKumar . Image Texture Feature Extraction Using GLCM Approach. International Journal of Scientific and Research Publications, Volume 3, Issue 5, May 2013 1 ISSN 2250-3153
- Despina Kontos, Lynda C. Ikejimba, Predrag R. Bakic, Andrea B. Troxel, Emily F. Conant, Andrew D. A. Maidment. Analysis of Parenchymal Texture with Digital Breast Tomosynthesis: Comparison with Digital Mammography and Implications for Cancer Risk Assessment. Radiology. Oct 2011; 261(1): 80–91.
- Grazia Raguso, Antonietta Ancona, Loredana Chiepp1, Samuela L'Abbate, Maria Luisa Pepe,Fabio Mangieri, Miriam De Palo, Rangaraj M. Rangayyan. Application of Fractal Analysis to Mammography. 32nd Annual International Conference of the IEEE EMBS 2010.
- Syed Abdaheer.M and Ekram Khan. Shape based classification of breast tumors using fractal analysis. Multimedia, Signal Processing and Communication 2009.
- Keith C. Clarke, Computation of fractal dimension of topographic surfaces using the triangular prism surface area method, Computer & Geoscience Vol. 12 N°. 5 pp. 713-722, 1986
- J Suckling et al, The Mammographic Image Analysis Society Digital Mammogram Database" Exerpta Medica. International Congress Series 1069 pp375-378. 1994
- R. Obula Konda Reddy, B. Eswara Reddy, E. Keshava Reddy. Classifying Similarity and Defect Fabric Textures based on GLCM and Binary Pattern Schemes. I.J. Information Engineering and Electronic Business, 2013, 5, 25-33.
- R. Ramani, N.Suthanthira Vanitha, S. Valarmathy. The Pre-Processing Techniques for Breast Cancer Detection in Mammography Images. I.J. Image, Graphics and Signal Processing, 2013, 5, 47-54
- A. Feroui, M. Messadi, A. Bessaid. Improvement of the Hard Exudates Detection Method Used For Computer- Aided Diagnosis of Diabetic Retinopathy. I.J. Image Graphics and Signal Processing, 2012, Vol 4 N°4, pp 19-27.
