New approach to medical diagnosis using artificial neural network and decision tree algorithm: application to dental diseases

Author: Ayedh abdulaziz Mohsen, Muneer Alsurori, Buthiena Aldobai, Gamil Abdulaziz Mohsen
Journal: International Journal of Information Engineering and Electronic Business @ijieeb
Article in issue: 4 vol.11, 2019.
Free access
In this article some modern techniques have been used to diagnose the oral and dental diseases. The symptoms and causes of such disease has been studied that may cases many other serious diseases .Many cases have been reviewed through patients' records, and investigation on such causes of oral and dental disease have been carried out to help design a system that helps diagnose oral and classify them, and that system was made according to the decision tree, (Id3 and J48) and artificial neural network techniques. Sample of oral and dental diseases were collected with their symptoms to become a data base so as to help construct a diagnostic system. The graphical interface were formed in C# to facilitate the use's diagnosis process where the patient chooses the symptoms through the interface which he suffered from ,and they are analyzed using the classification techniques and then re diagnosed the disease for the user.
Decision Tree, Diseases, Application, Dental, Neural network, Symptoms, Diagnosis
Short address: https://sciup.org/15016184
IDR: 15016184 | DOI: 10.5815/ijieeb.2019.04.06
Text of the scientific article New approach to medical diagnosis using artificial neural network and decision tree algorithm: application to dental diseases
Published Online July 2019 in MECS
Oral and dental health means safety from oral and facial diseases, gum, decay and loss of tooth and disorders that may affect mouth and gum, like, cancer of the mouth, throat, mouth ulcers and birth defects such as, upper lip follicle, palate and other diseases. Body health and oral health are related to the existence of bacteria in the mouth. Normally, normal body defenses and good oral hygiene such as brushing and flossing daily make these bacteria under control. However, harmful bacteria can sometimes grow out of control and cause Oral infections such as tooth decay and gum disease in addition to the use of some drugs that reduce the flow of saliva, which disturb the natural balance of bacteria in the mouth and make it easy for bacteria to enter the bloodstream. Gingivitis and tooth decay are the main cause of tooth loss. Dental decay occurs due to the breakdown of sugar in the various foods we eat, which produces a type of acid that erodes the outer layer of teeth (enamel) causing tooth decay.
According to the World Health Organization (WHO) report in 2003, oral and dental problems are the fourth most expensive diseases in industrialized countries.The problem for older people is due to dry mouth caused by some medications [1]. There are also common factors between oral diseases and major chronic diseases such as cardiovascular disease, cancer, chronic respiratory diseases and diabetes. These include an unhealthy diet, tobacco or alcohol abuse, and poor oral and dental hygiene.
To diagnose the diseases of the mouth and teeth first, take the general condition (healthy - diabetic - pressure patient - pregnant) and age (baby - child - young - adult) in mind and then begin to study the symptoms faced by the patient and identify the place of pain and disease and begin the treatment [2]. It is worth mentioning that oral diseases can develop to a serious condition before symptoms appear in the mouth or teeth. It is therefore necessary to check the oral and dental care clinic for the necessary health checks. It should be remembered that oral and dental health is associated with overall human health. For example, diabetes and rheumatism affect oral and dental health, and vice versa. The female should tell the dentist or the dental hygiene technician if she is pregnant, the medications she is taking and the diseases she suffers from, if any.
The medical field is strongly related to the development of technology and today we find that there are many deaths in the world due to the wrong diagnosis. We have studied the construction and design of a system that helps diagnosing the diseases, especially oral and dental diseases using the techniques of mining (neural networks, decision trees, WEKA program, and C#). When dealing with a large amount of data, some techniques of mining and diagnosis are used, such as, cluster analysis, genetic algorithms, machine learning, neural networks, decision trees, natural language processors, predictive modeling, time series.
In this article, techniques similar to the mentioned techniques have been used. There are more than 24 multiple pathological symptoms. This is what has been relied upon in the analysis and construction of the oral and dental diagnosis system. A group of symptoms that helps diagnosing the disease through the patient's symptoms, adopted in the technique of data mining, which is finding a logical relationship to classify diseases in an understandable and useful way. The electronic diagnostic systems are accurate systems that use accurate techniques and dispense with the traditional use. These systems solve many problems that occur during diagnosis, including errors occurring in diagnosing, and thus, may lead to the patient’s suffering and may lead to his death. The aim of this study is to present an exploration on the classification and diagnosis of oral and dental diseases and to predict the disease using data mining tools. The symptoms that have been relied upon to diagnose the disease are as follows:
-
1. Stomatitis or dentalgia
-
2. Severe Stomatitis or dentalgia
-
3. Gingivalgia
-
4. Oral or dental tumour
-
5. Parodontid
-
6. Tumour spread in mouth
-
7. Body fever especially in fac
-
8. Oral and dental eating disorders
-
9. Inability to open mouth
-
10. Gnashing
-
11. Oral bleeding
-
12. Dental eruption and malposition
-
13. Buried teeth
-
14. Polydontia
-
15. Agomphiasis or hypodontia
-
16. Odontoclasis
-
17. Xerophthalmia / xerostomia
-
18. Oral pruritus
-
19. Oral puffiness
-
20. Black layer
-
21. Blue color Appearance
-
22. Congenital malformation
-
23. Erythrodontia or Oral redness
-
24. Odontosynerrismus.
The artificial neural network consists of a set of processing units called nerve cells or neurons that are similar to the biological neurons of the brain. These units are interconnected in a form of neural networks.
There are many artificial neural networks used to handle data patterns and each type is unique in architecture and mechanism of information processing through the number and type of nodes in each layer in addition to the quality of the activation functions and the mechanism of the weight adjustment of these networks:
* Perceptron neutral network.
* Back-propagation neural network.
* Generalized Regression network.
* Kohonen Network.
-
B. Kohonen Network Algorithm:
Kohonen’s self-organizing networks are single-line linear networks fully connected where the results are generally organized into two-dimensional nodes and have the ability to learn, and are one of the types of artificial neural networks that rely on self-organizing maps and are widely used in data classification. The Self-Organizing Maps (SOM) consists of a set of regular Neurons with two-dimensional matrix. The Finnish scientist Teuvo Kohonen was the first one who talked about this model, whose name was named to this model, Figure 1: Illustrates the general structure of Kohonen's algorithm.
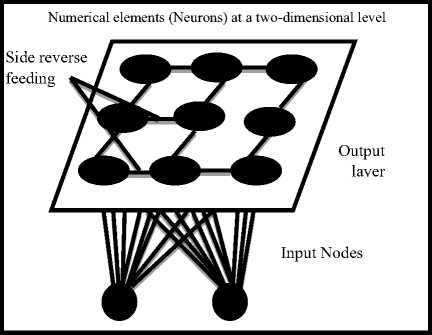
Fig.1. The general structure of Kohonen’s algorithm
II Background
-
A. Artificial Neural Network:
Artificial neural networks are known as computational techniques designed to mimic the way the brain works in a particular way. It consists of simple processing units. These units are only arithmetic components called neurons or nodes that have a neurological property where they store scientific knowledge and practical information to make it available to the user by adjusting the weights. The ANN is similar to human brain in that it acquires knowledge by training and storing knowledge via using connecting forces within neurons called entangled weights [4].
The algorithm includes the following steps:
-
• All input elements are connected to each output element.
-
• Inverse feedback is limited to the lateral connection between the closest computational elements only.
-
• Each element in the input is linked to all elements in the output.
-
• Determine random weights and minimum values for all connections between inputs and computational elements in outputs so that there is a single vector for each element that can be stored within this element.
-
• The learning process begins by comparing the vector of inputs with all the vectors stored in the arithmetic elements individually.
-
• The winning element is selected, which contains a similar vector or nearly similar to the data of the input vector. The winning element adjusts the weights stored in it with the input vector data until it becomes the same, so that the element can recognize these inputs when displayed again.
-
• The weights of the elements adjacent to this winning element are then adjusted to take an approximate direction of the winning element, so that the network can recognize close similar cases to the input cases.
-
C. Decision trees
Decision trees and neural networks are one of the most important techniques of data mining because of the precise results achieved by using these algorithms and their applicability in solving many problems despite their difficulty, which led to their non-wide proliferation. The most important feature of the decision tree is that the calculation is carried out at the end of the tree and at its distant parts, and then it goes back to its start according to a method known as retrograde return. That is to say, it begins with the decision, which associated with the distant goals of the tree and related to identifying certain trends and levels of the problem phenomena. After that, the process of decision-making continues from a subdecision to another sub-decision that is closer to the origin of the decision problem and continues until the final stage, through which everything related to the problem is clarified [6].
It should be noted that the decision-maker, by adopting this quantitative approach in addressing a particular problem, he chooses the best optimal alternatives available and excludes at the same time other paths and branches that do not have the same importance, comparing to those that have been selected. Decision trees as an unsupervised method, are used for classification and regression. The purpose of this model is to design a model for predicting a variable value by learning simple decision rules derived from the data features. The classification process is applied by a set of rules or conditions that determines the path that will follow the root, starting from the root node and ending with the root node – a final node, which represents a symbol of the item being classified. At each non-final node, a decision should be done, concerning path of the next nodes [12].
There are algorithms used to classify decision trees, including the J48 algorithm and the Id3 algorithm. In this article, these two algorithms were used and compared, and algorithms (Id3 and J48) were used to show the classification results.
-
D. Id3 Algorithm:
It is an algorithm used to classify data where data is collected and then categorized on the basis of the type it belongs to. The algorithm input is a set of data and output is a classifier base that can classify new data that has not been used as a type of prediction for this new data. The classifier takes the form of a tree structure, so it is called a decision tree and can be converted into a set of rules, so it can be called a "decision rules [28]. It is used for all classification problems (income analysis, disease classification, images classification and other classification problems)
-
E. J48 Algorithm:
The J48 decision tree is an extension to proceed the Id3 algorithm. This algorithm is one of the data classification algorithms, where data is collected and then categorized according to the type to which it belongs [19].
The data is usually large so we will represent it in a table with a set of instances. Each instance in a record; it is divided in terms of columns into the following:
-
• A set of attributes and each attribute has a set of values
-
• A set of classes; it is also an attribute, but they are a result of classifying a set of attributes with each other.
-
F. Entropy Calculating Method
Is a mathematical method used to calculate the amount of data distortion through which the best division attributes for data [14] can be determined, and it is calculated, as follows:
c
Entropy = ∑ - pi log2 pi (1)
i = 1
Where Pi is a symbol of the probable existence of an attribute in the case. Then, calculating the gain; the aim of calculation is to obtain the maximum gain, divided by the total Entropy. It is calculated as follows:
Gain ( pi , i ) = Entropy ( pi ) - Entropy ( i / pi ) (2)
-
G. WEKA program:
WEKA Program is an open source software package that contains a set of algorithms that helps to analyze and extract data (Data mining) that can be easily applied to a set of data either directly through the WEKA program interface or to be called by Java code using its own classes. That is through downloading the WEKA library. It also contains tools that are capable of dealing with the following processes:(pre-processing, classification, downgrade, etc.)and can be used through the graphical interface. In this program, the data can be filtered to Arff to be then mined by the WEKA program. After filtering, the classifier is evaluated; it is tested by providing it with a set of data in order to be classified [31].
There are four methods used in WEKA to test the classifier:
-
• Using Training set
-
• Cross validation
• Percentage
• Supplied test set
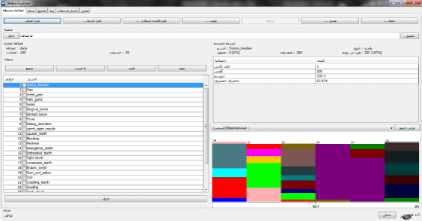
Fig.2. The WEKA program interface
Table 1. Comparing the classification result of id3 and j48
|
Comparison Aspect |
Id3 |
J48 |
|
Correct classification ratio |
79% |
86% |
|
Incorrect classification ratio |
21% |
14% |
|
Value of Kappa statistic invariant |
0.7676 |
0.8427 |
|
Average of F-Measure |
0.788 |
0.95 |
In the current work, The following classification techniques were used (Id3, J48, Decision Tree, and Artificial Networks (AN)) are used to predict the Oral and dental disease using WEKA 3.6.11 tool and that AN has been simulated by designing the user interface using C# language. This is unless used before .And therefore, the best technique of prediction is found.
-
III. Analysis Ans Classification of the Study Data.
The study data was analyzed and classified (more than 200 cases) on the WEKA program and decision trees and neural networks for its accuracy in classifying the results, which based on the symptoms mentioned in this article.
-
A. Use the WEKA Program
Cross validation was selected for data training on 90% and tested on 10% using the J48 algorithm, id3. When selecting the J48 algorithm to classify the data, the results of the classifier’s accuracy results were as follows:
=== Stratified cross-validation ===
|
=== Summary === Correctly Classified Instances |
172 |
86 % |
|
Incorrectly Classified Instances |
28 |
14 % |
|
Kappa statistic |
0.8427 |
|
|
Mean absolute error |
0.0135 |
|
|
Root mean squared error |
0.953 |
|
|
Relative absolute error |
18. 7976 % |
|
|
Root relative squared error |
50.3923% |
|
|
Total Number of Instances |
200 |
We notice: The first line shows the total number of instances, which the classifier classified correctly, they reached 86%. The following line shows the total number of instances, which the classifier classified incorrectly;
they reached 14%. The third line represents the value of the Kappa statistic invariant, which reached 0.84.
While using the Id3 algorithm to classify the data, the results of the classifier’s accuracy are as follows :
=== Stratified cross-validation ===
=== Summary ===
|
Correctly Classified Instances |
158 |
79 % |
|
Incorrectly Classified Instances |
42 |
|
|
20.5 % |
||
|
Kappa statistic |
0.7676 |
|
|
Mean absolute error |
0.0157 |
|
|
Root mean squared error |
0.1224 |
|
|
Relative absolute error |
21. 899 % |
|
|
Root relative squared error |
64.9127% |
|
|
Total Number of Instances |
200 |
We notice: The first line shows the total number of instances, which the classifier correctly classified, they reached 79 %. The following line shows the total number instances, which the classifier classified incorrectly; they reached 20.5%. The third line shows the value of the Kappa statistic invariant, which reached 0.76%.
Thus, we conclude from these results that the classification of the J48 algorithm is better than the classification of the Id3 algorithm, which is summarized in the following table:
-
B. Constructing a Decision Tree
Using Decision Trees to classify the study data in this article, We set a path beginning from the node in the attribute (black layer) and ending with the attribute (eating disorders).
Some of the rules of decision trees:
-
1. If the patient has a black layer in his teeth, he is likely to have dental calcification.
-
2. If the he suffers from Stomatitis and fever, he is likely to have mumps.
-
3. If the he suffers from teeth eruption and malposition and eating disorders, he is likely to have jaw dislocation.
-
4. If the he suffers from Odontosteresis and Odontoclasis and has diabetes, he is likely to have Odontosteresis; or if he is not having diabetes, he is likely to have Odontoclasis.
-
5. If the he suffers from Tumour spread in his mouth, he is likely to have oral cancer.
-
6. If the he suffers from Polydontia, he is likely to have temporal jaw disorders.
-
7. If the he suffers from Odontosynerrismus, he is likely to have bruxism.
-
8. If the he suffers from gingival redness, he is likely to have gingival pigmentation.
-
9. If the he suffers from Xerophthalmia, he is likely to be infected with mouth dryness.
-
10. If the he suffers from gnashing, he is likely to have a chronic dental caries.
-
11. If the he suffers from congenital malformation, he is likely to have harelip.
-
12. If the he suffers from dentalgia, he is likely to have caries.
-
13. If the he suffers from eating disorders, he is likely to have severe caries.
The cases are categorized, starting from the root node in the decision tree. Each node is sorted as a Class. The Entropy athematic system was used to order of the nodes_ it is a mathematical method to calculate the amount of distortion in the data, through which the best attribute for data division can be determined.
The entropy value is calculated by equation 1 where pi is the probability of the disease.
Table 2. Results of the entropy calculation for the disease cases
|
Attribute |
Value |
|
(Aphthous stomatitis) Pj |
2/200=0.01 |
|
(Odontoclasis) Pj |
12/200=0.06 |
|
(Bruxism) Pj |
5/200=0.025 |
|
(Calcinations) Pj |
14/200=0.07 |
|
(Caries) Pj |
9/200=0.045 |
|
(Chronic caries) Pj |
14/200=0.07 |
|
(Jaw Dislocation) Pj |
4/200=0.02 |
|
(Dental eruption and malposition) Pj |
4/200=0.02 |
|
(Facial nerve paralysis) Pj |
4/200=0.02 |
|
(Gingivitis) Pj |
4/200=0.02 |
|
(Gingival recession) Pj |
2/200=0.01 |
|
(Gingival pigmentation) Pj |
2/200=0.01 |
|
(Harelip) Pj |
3/200=0.015 |
|
(Buccal herpes) Pj |
5/200=0.025 |
|
(Temporal jaw disorders) Pj |
10/200=0.05 |
|
(Inverted bite) Pj |
4/200=0.02 |
|
(odontosteresis) Pj |
57/200=0.285 |
|
(Mumps) Pj |
5/200=0.025 |
|
(Maxillary bone narrowness) Pj |
5/200=0.025 |
|
(Severe caries) Pj |
8/200=0.04 |
|
(Sialolithiasis) Pj |
5/200=0.025 |
|
(Cancerous Tumor) Pj |
7/200=0.035 |
|
(Wisdom tooth inflammation) Pj |
7/200=0.035 |
|
(Xerostomia) Pj |
5/200=0.025 |
Entropy (class) = -2*(0.01 log (0.01))-0.06 log (0.06)-7*(0.025 log (0.025))-2*(0.07 log (0.07))-0.045 log (0.015)-0.05 log (0.05)-0.285 log (0.285)-0.04 log (0.04)-2*(0.035 log (0.035)) =1.18
Thus, we have obtained Entropy value for the entire table. Then, we start calculating the Entropy values for all the attributes in the spreadsheet. In the calculation, we select a root node for the tree. We calculate for one attribute, so that the rest of the attributes takes the same pattern in the calculation. Then, the decision tree will be produced as shown in the WEKA program
The entropy calculation for the cases in which the attribute (black layer) is there; carried out on 14 cases:
Black layer A1
Classification Calcinations
Entropy (A1 ) = -14/14 LOG(14/14) = 0
The other cases that do not have the attribute (black layer) and marked with the symbol (A2), where Entropy values are as follows:
Entropy (A2) = -2*(2/186 log(2/186))-12/186
log(`2/186)-7*(5/186 log(5/186))-9/186 log(9/186)-
14/186 log(14/186)-5*(4/186 log(4/186)-3/186
log(3/186)-15/186 log(15/186)-57/186 log(75/186)-8/186 log(8/186)-2*(7/186 log(7/186)=1.139.
Then, we calculate the gain of the attribute (black layer) by the Equation 2
We continue to calculate Entropy for all attributes in the same way. Then, all the attributes are sorted and the best Entropy value is selected for the attribute, which is found in the tree root.
The best value of the attributes according to the results of the classification and analysis was the attribute (black layer); so it was the root of the tree .
-
C. Use the C# Language.
0.1 = the pathological symptom is unavailable at all.
0.5 = the pathological symptom is available but in a low percentage; it may exist and may not exist.
0.9 = the pathological symptom is definitely available.
WEKA program and decision trees were used in this study to classify the data of the oral and dental diseases and to construct decision tree and neural networks. The results of the analysis and classification were also applied to the C # language through which the user's graphical interfaces were built to simulate the neural network. The pathological symptoms that determined and selected by the infected person through the interfaces are symbolized by (1) if the attribute is there; and symbolized by (0) if the attribute is not there, and then the network is trained by assuming random weights of the attributes, as follows:
-
• Flowchart for The Application to dental diseases
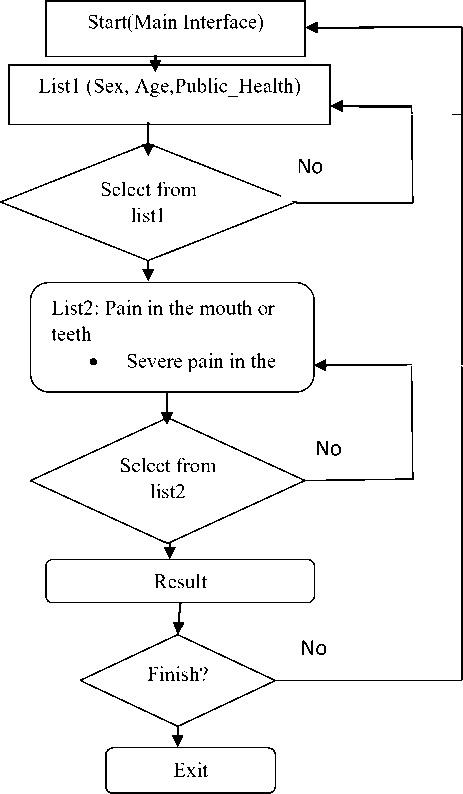
Fig.3. Illustration shows the function of the system.
-
• Main interfaces
The main interface of the system through which the user can identify the symptoms that the patient suffers from; it contains the (General Status- Healthy) list, as in figure 4; it contains the following options: Healthy, Diabetic Patient, Patient-Pressure, Pregnant woman. The user selects one of these options that suits his / her health condition. His choice from this list is compulsory because he cannot diagnose his condition unless he selects from the symptoms list. Every case has its own treatment determined by the dentist. Another list is the age option, it contains the following options: (Adult) _18 years old and above, (Young) _ ranging from (14 -17 years), (Baby), ranging from (2-13 years) and (Infant), ranging (a month - two years). According to dentists, age is necessary in diagnosing oral and dental diseases because determining medication varies according to the age group. A third list is the gender option, the list contains two options (Male) and (Female). Gender has an effect on medication, just like the age and the general status-Healthy. Yet, gender is affected when the case is a pregnant woman; in this case, the dentist determines it and prescribes suitable medications. The selection of the three lists is compulsory to fulfill the diagnosing process.
The list of symptoms in figure 4 is associated with oral and dental diseases; it reaches 24 symptoms, which was included in a single list of all the symptoms in which the user can select different symptoms. Finally, the result or diagnosis button in figure 4 is clicked after every selection from all the required lists through which the result of diagnosis or the disease resulting from the selected symptoms is shown.
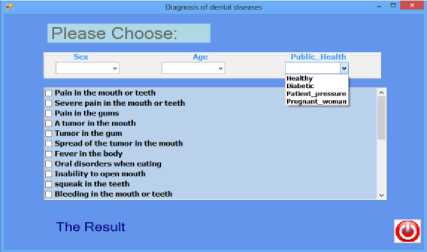
Fig.4. Illustrates the general status
Some pathological cases have been tested through the interfaces described above, some of which are as follows:
Case 1: The following options were chosen: General status (Healthy), 19 years old, adult, Male, suffering occasionally from pain in his teeth and mouth. After selection, the diagnostic button is pressed to analyze and classify the selected data, then it gives the result (Caries Type I) and the percentage of the disease is 97%( Infection Rate). Figure 5 illustrates the first case.
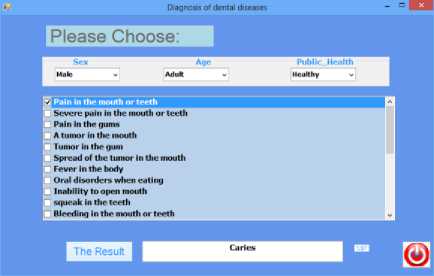
Fig 5. Shows the symptoms of first case, diagnosis and infection rate.
Figure 5 shows the result of the diagnosis, which caries type I and the infection rate = 97%. This is identical to the classification of the decision trees and the database.
Case II: From the list of general status (Pregnant Woman), from age (Adult or Young), from gender (Female) and from the list of symptoms (Gingivalgia, Oral Pruritus) are selected. After selection, the result button is pressed, showing the result (Gingivitis) as in figure 6.
Figure 6 shows the result of the diagnosis (Gingivitis) and the disease infection rate = 94%( Infection Rate). The user must be aware when selected from the general status list (Pregnant Women) of the other options. He cannot select from the list of age (child or infant), or from the gender list (male). In case the user made a mistake, the program will show a message that the selection is wrong and must be re-checked properly, as shown in Figure 7 below.
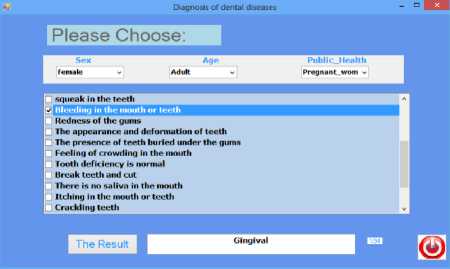
Fig.6. Results of the second case diagnosis and selection of the second case symptoms.
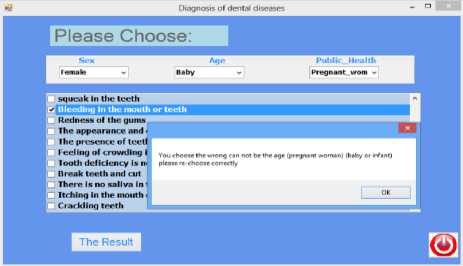
Fig.7. Message to alert the user in case of error selection.
In the previous figure 7, a message shows that the user is wrong when he selects from the general status list (Pregnant Woman) and from the age (Child) because a (Child) cannot be a (Pregnant Woman) and therefore the neural network will not work in such a case; it only works when the selection is correct.
-
IV. Conclusion
This paper, aimed at presenting a study about classification and diagnosis of oral and dental diseases and to predict the disease using data mining tools, Such as Artificial Networks (AN), Decision Trees (DT), ID3, AND J48 in the diagnosis process to obtain the most result. The above mentioned techniques have been applied using the Weka program to assist in the classification and mining of data .The J48 and algorithms were selected carefully ,and then a comparison between theme was made to show which one is more accurate .It was found that the J48 algorithm is more accurate in the classification, in this particular study ,because the error rate is lower than that in the id3 algorithm .After applying the above mentioned techniques, graphical interface were built using the C# programming language to simulate AN in order to be trained on a set of symptoms to predict diseases, then some cases suffered from these symptoms were presented. The program proved its effective and its essay in diagnosing oral and dental diseases.
References New approach to medical diagnosis using artificial neural network and decision tree algorithm: application to dental diseases
- Jenny Abanto Thiago S. Carvalho Fausto M. Mendes Marcia T. Wanderley Marcelo Bönecker Daniela P. Raggio, Impact of oral diseases and disorders on oral health‐related quality of life of preschool children, Volume39, Issue2,April 2011,Pages 105-114.
- Iain Pretty, Michaela Goodwin, Digital Technologies in Oral & Dental Research, Volume 74, Supplement 1, Pages S1-S50 (July 2018).
- R. Thanigaivel, and K. R. Kumar, "Boosted Apriori: An Effective Data Mining Association Rules for Heart Disease Prediction System," Middle-East Journal of scientific Research, vol. 24, pp. 192-200, 2016.
- J. Banupria, and S. Kiruthika, " Heart disease using Data Mining Algorithm on Neural Network and Genetic Algorithm," International Journal of Advanced Research in Computer Science and Software Engineering, vol. 6, Issue 8, pp.40-42, 2016.
- C. Sowmuiya, and P. Sumitra, "Comparative Study of Predicting Heart Disease by Means of Data Mining," International Journal of Engineering and Computer Science, vol. 5 , Issue 12, pp. 19580-19582, 2016.
- Swathi P, Yogish H.K, Sreeraj R, “Predictive Data Mining Procedures for the Prediction of Coronory Artery disease” , IJETAE Volume 5, Issue 2 February 2015.
- K.Sudhakar, Dr. M. Manimekalai, “Study of Heart Disease Prediction using Data Mining” , International Journal of Advanced Research in Computer Science and Software Engineering, Volume 4, Issue 1, January 2014
- M. Abdar et al., "Comparing Performance of Data Mining Algorithms in Prediction Heart Diseases, "International Journal of Electrical and Computer Enginnering (IJECE), vol. 5, no. 6, 2015.
- Boshra Bahrami, Mirsaeid Hosseini Shirvani, “Prediction and Diagnosis of Heart Disease by Data Mining Techniques”, Journal of Multidisciplinary Engineering Science and Technology (JMEST), ISSN: 3159-0040, Vol. 2 Issue 2, February - 2015
- Cabena, P., Hadjinian, P., Stadler, R., Verhees, J. and Zanasi, A."Discovering data mining: From concept to implementation,".New Jersey: Prentice Hall, 1997.
- Chang, C.-L., and ChenC.-H."Applying decision tree and neural network to increase quality of dermatologic diagnosis," Expert Systems with Applications, 4035-4041.,2009.
- Chau, M., Shin,D., “A Comparative study of Medical Data classification Methods Based on Decision Tree and Bagging algorithms”, Proceedings of IEEE International Conference on Dependable,Autonomic and Secure Computing, 2009, pp.183-187.
- Ture, M., Kurt, I., Kurum, A. T., and Ozdamar, K,"Comparing classification techniques for predicting essential hypertension,".Expert Systems with Applications, 2005.
- Eom, J.-H., Kim, S.-C., and Zhang, B.-T. "AptaCDSS-E: A classifier ensemble based clinical decision support system for cardiovascular disease level prediction," Expert Systems with Applications, 2008.
- Vikas Chaurasia, Saurabh Pal, “Data Mining Approach to Detect Heart Diesease”, International Journal of Advanced Computer Science and Information Technology (IJACSIT) Vol. 2, No. 4, 2013, Page: 56-66, ISSN: 2296-1739
- Aqueel Ahmed, Shaikh Abdul Hannan, “Data Mining Techniques to Find Out Heart Diseases: An Overview”, International Journal of Innovative Technology and Exploring Engineering (IJITEE), ISSN: 2278-3075, Volume-1, Issue-4, September 2012
- Nidhi Bhatla, Kiran Jyoti, “An Analysis of Heart Disease Prediction using Different Data Mining Techniques”, International Journal of Engineering Research & Technology (IJERT) Vol. 1 Issue 8,October - 2012 ISSN: 2278-0181
- Jenn-LongLiu, Yu-Tzu, Chih-Lung Hung, "Development of evolutionary data mining algorithm and their applications to cardiac disease diagnosis", World congress on computational intelligence, 2012.
- Dr. Neeraj Bhargava, Girja Sharma-Dr. Ritu Bhargava-Manish Mathuria- Research Paper-Decision Tree Analysis on J48 Algorithm for Data Mining-International Journal of Advanced Research in Computer Science and Software- Engineering Page | 111 4 Volume 3, Issue 6, June 2013ISSN: 2277 128X
- Ankita Dewan, Meghna Sharma, ―Prediction of Heart Disease Using a Hybrid Technique in Data Mining Classification‖, ITM University Gurgaon, INDIA,2015,PP 704-706.
- Sivagowry .S1, Dr. Durairaj. M2 and Persia.A3 1 and 3 Research Scholar, 2 Assistant Professor,‖An Empirical Study on applying Data Mining Techniques for the Analysis and Prediction of Heart Disease ‖, Journal of School of Computer Science and Engg.Bharathidasan University, Trichy, Tamilnadu, India.
- Usha. K Dr, Analysis of Heart Disease Dataset using Neural network approach, IJDKP, Vol 1(5), Sep 2011.
- M.Akhil jabbar* B.L Deekshatulua Priti Chandra b,‖Classification of Heart Disease Using K- Nearest Neighbor and Genetic Algorithm‖, International Conference on Computational Intelligence: Modeling Techniques and Applications (CIMTA) 2013, pp 85 -94.
- Chaitrali S. Dangare , Sulabha S. Apte,PhD. ,‖Improved Study of Heart Disease Prediction System using Data Mining Classification Techniques‖ ,International Journal of Computer Applications (0975 888) Volume 47 No.10, June 2012.
- Jiawei Han and Micheline Kamber, “Data Mining Concepts and Techniques”, second edition, Morgan Kaufmann Publishers an imprint of Elsevier.
- V.Karthikeyani,”Comparative of Data Mining Classification Algorithm (CDMCA) in Diabetes Disease Prediction” International Journal of Computer Applications (0975 – 8887) Volume 60– No.12, December 2012.
- M. Anbarasi “Enhanced Prediction of Heart Disease with Feature Subset Selection using Genetic Algorithm” International Journal of Engineering Science and Technology Vol. 2(10), 2010, 5370-5376.
- Wei Peng, Juhua Chen and Haiping Zhou ,An Implementation of ID3 --- Decision Tree Learning Algorithm- Project of Comp 9417: Machine Learning University of New South Wales, School of Computer Science & Engineering, Sydney, NSW 2032, Australia weipengtiger@hotmail.com- page(3)
- Prachi Paliwal, Mahesh Malviya, “An Efficient Method for Predicting Heart Disease Problem Using Fitness Value”, (IJCSIT)
- http://data-mining.business-intelligence.uoc.edu/home/j48-decision-tree Website - Jordi Gironis Lecturer in Business Intelligence Master /Feel free to email at:jgironesr@uoc.edu
- WEKA://http://www.cs.Waikato.ac.nz/mc/weka/index.html.
- Weekly magazine at https://www.webteb.com/dental-health/diseases-2011-2017
- A scientific article from the website : https: //informatic-ar.com/id3_algorithm/-10 October 2013.
- CSE5230 Tutorial: The ID3 Decision Tree Algorithm. Monash University, Semester 2,2004. Retrieved April 10, 2012, from http://www.csse.monash.edu.au/courseware /cse5230/2004/assets/decisiontreesTute.pdf.
