New Contribution on Compression Color Images: Analysis and Synthesis for Telemedicine Applications

Автор: Beladgham Mohammed, Habchi Yassine, Moulay Lakhdar Abdelmouneim, Bassou Abdesselam, Taleb-Ahmed Abdelmalik
Журнал: International Journal of Information Engineering and Electronic Business(IJIEEB) @ijieeb
Статья в выпуске: 2 vol.6, 2014 года.
Бесплатный доступ
The wavelets are a recent tool for signal processing analysis, for multiple time scale. It gives rise to many applications in various fields such as geophysics, astrophysics, telecommunications, imaging, and video coding. They are the basis of new analytical techniques and signal synthesis and some nice applications for general problems such as compression. This paper introduces an application for color medical image compression based on the wavelet transform coupled with SP?HT coding algorithm. In order to enhance the compression by this algorithm, we have compared the results obtained with wavelet transform application in natural, medical and satellite color image field. For this reason, we evaluated two parameters known for their calculation speed. The first parameter is the PSNR; the second is MSSIM (structural similarity).
DWT, color image, lifting scheme, SPIHT
Короткий адрес: https://sciup.org/15013242
IDR: 15013242
Текст научной статьи New Contribution on Compression Color Images: Analysis and Synthesis for Telemedicine Applications
Published Online April 2014 in MECS
Reduction technologies debit have long been used, but it is only recently that they have become simple enough for everyday application such as for distance diagnostic medical system, digital library and Internet…One of the most important problems in such applications is how to store and transmit images [1]. For this the researchers are interested by medical diagnostic field to help the doctor in his diagnostic work.
The search for a good representation is a central problem of image processing for this, many ideas that have already been studied for search and to come determine a bases adapted to complex geometry presented in the content of images.
Image representations in separable orthonormal bases such as Fourier, local Cosine can not take advantage of the geometrical of image structures. Standard wavelet bases are optimal to represent functions with piecewise singularities.
-
II. Classical wavelet transform
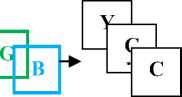
In separable 2D case, classical discrete wavelet transform (DWT) can be realized with convolutional Mallat’s algorithm in Fig 1.
Li Colu
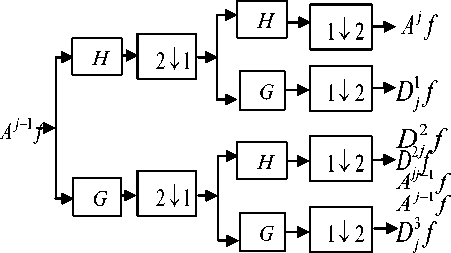
Fig 1: 2D DWT implementation A j f
The low-pass and high-pass decomposition filters are represented as H and G , respectively. Applying H and G both in horizontal and vertical directions to the original image I ( i , j ), and next, recursively to the resulting gradually coarser coefficients, we can obtain the following decomposition coefficients.
+^+^
Ak, if = E E h (2k - n) h (21 — m) Anm f(1)
n=-^ m =-^ +^+^
D1,k,if = E Eh(2k - n)g(21 -m)An-f(2)
n=-^ m=-^ +^+^
Djk, if = E E g (2 k - n) h (21 - m) An- f(3)
n=-^ m=-^ +^+^
D33,k,if = E Eg(2k -n)g(21 -m)Anmf(4)
n =-^ m =-^
The sub-bands are labeled by using the following symbols:
-
1. LLn ( A j f ) is the approximation image at resolution (level decomposition) n, indicate low-frequency component (LL) resulting from low-pass filtering in the vertical and horizontal directions.
-
2. HLn ( D 1 f ) represents the vertical details at resolution n, and results from vertical low-pass filtering and horizontal high-pass filtering.
-
3. LHn ( D 2 f ) represents the horizontal details at resolution n, and results from horizontal low-pass filtering and vertical high-pass filtering.
-
4. HHn D 3 f represents the diagonal details at resolution n, and results from high-pass filtering in both directions.
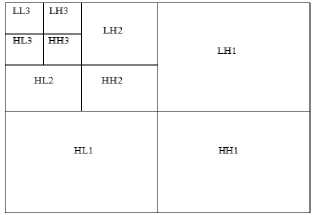
Fig 2: Wavelet Filter Decomposition
I ( i , j ) can be equivalently represented as the more compact form below.
I ( i , j ) = { A j , D * , D j , D j ,...A - 1, D ^ 1, D ^ 1, D D } (5)
-
III. Lifting scheme
The wavelet transform (WT), in general, produces floating point coefficients. Although these coefficients are used to reconstruct an original image perfectly in theory, the use of finite precision arithmetic and quantization results in a lossy scheme.
Recently, reversible integers WT’s (WT's that transform integers to integers and allow perfect reconstruction of the original signal) have been introduced [2,3]. In [4], Calderbank et al. introduced how to use the lifting scheme presented in [5], where Sweldens showed that the convolution based biorthogonal WT can be implemented in a lifting-based scheme as shown in Fig. 1 for reducing the computational complexity. The lifting-based WT consists of splitting, lifting, and scaling modules and the WT is treated as a prediction-error decomposition. It provides a complete spatial interpretation of WT. In Fig. 3, let X denote the input signal, and XL 1 and XH 1 be the decomposed output signals, where they are obtained through the following three modules of lifting-based 1DWT:
-
1. Splitting: In this module, the original signal X is divided into two disjoint parts, Xe ( n ) = X ( 2 n ) and
-
2. Lifting: In this module, the prediction operation P is used to estimate X 0( n ) from Xe ( n ) and results in an error signal d ( n ) which represents the detailed part of the original signal. Then we update d ( n ) by applying it to the update operation U , and the resulting signal is combined with Xe ( n ) to s ( n ) estimate, which represents the smooth part of the original signal.
-
3. Scaling: A normalization factor is applied to d ( n ) and s ( n ) , respectively. In the even-indexed part s ( n ) is multiplied by a normalization factor K to produce the wavelet subband X . Similarly in the odd-index part the error signal d ( n ) is multiplied by Ko to obtain the wavelet subband X
X X o ( n ) = X ( 2 n + 1 ) that denote all even-indexed and odd-indexed samples of X , respectively [7].
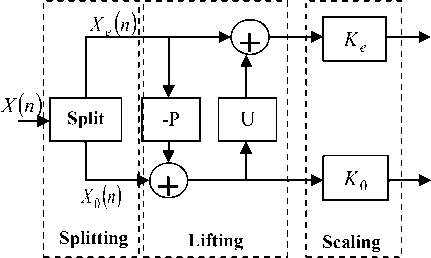
Fig 3: The lifting-based WT [7]
Note that the output results of X and X obtained by using the lifting based WT are the same as those of using the convolution approach for the same input even if they have completely different functional structures. Compared with the traditional convolution-based WT, the lifting-based scheme has several advantages. First, it makes optimal use of similarities between the highpass and lowpass filters; the computation complexity can be reduced by a factor of two. Second, it allows a full in place calculation of the wavelet transform. In other words, no auxiliary memory is needed.
-
IV. Ezw coding scheme
The algorithm proposed by Shapiro [18], the design of this algorithm is based on two pass with a calculated threshold T, we determine the maximum value of the wavelet coefficients, so in the first dominant pass, if the coefficient absolute value is greater than the threshold, so we obtained a positive code or negative code according to the sign of coefficient, if the absolute value is less, we check the descendants coefficient, if you have a coefficient with absolute value above the threshold, we obtained IZ code, else we have a code ZT.
In the second pass, the comparison is made in the middle of the interval [Tn, 2Tn[, if this coefficient belongs to the first interval, so we are a transmission of the bit 1, if this coefficient belongs to the second interval, so there are a transmission of bit 0.
V. Spiht coding scheme
The SPIHT algorithm proposed by Said and Pearlman in 1996 [19], ameliorate progressive algorithm is compared to the EZW algorithm, based on the creation of three list SCL, ICL and ISL with a calculated threshold T, each time you make a scan on both lists SCL and ISL and that for the classified the significant coefficient in the list of significant coefficient.
VI. Quality Evaluation parameter
The Peak Signal to Noise Ratio (PSNR) is the most commonly used as a measure of quality of reconstruction in image compression. The PSNR were identified using the following formulate:
MSE =
M.N
M - 1 N - 1
.EE
i = 0 j = 0
A
I (i,j)-1 (ij
Mean Square Error (MSE) which requires two M x N gray scale images I and I where one of the images is considered as a compression of the other is defined as:
• The PSNR is defined as:
PSNR = 10.log10
(2R -1)2
MSE
[dB]
Usually an image is encoded on 8 bits. It is represented by 256 gray levels, which vary between 0 and 255, the extent or dynamics of the image is 255.
PSNR of a color image (RGB) is defined by the equation:
PSNR = 10log10
___________ 255 2 x 3 ___________
MSE ( R ) + MSE ( G ) + MSE ( B )
• The structural similarity index (SSIM):
The PSNR measurement gives a numerical value on the damage, but it does not describe its type. Moreover, as is often noted in [20], [21], it does not quite represent the quality perceived by human observers. For medical imaging applications where images are degraded must eventually be examined by experts, traditional evaluation remains insufficient. For this reason, objective approaches are needed to assess the medical imaging quality. We then evaluate a new paradigm to estimate the quality of medical images, specifically the ones
compressed by wavelet transform, based on the assumption that the human visual system (HVS) is highly adapted to extract structural information. The similarity compares the brightness, contrast and structure between each pair of vectors, where the structural similarity index (SSIM) between two signals x and y is given by the following expression:
SSIM (x,y) = l ( x, y) c (x, y) s (x, y) (9)
Finally the quality measurement can provide a spatial map of the local image quality, which provides more information on the image quality degradation, which is useful in medical imaging applications. For application, we require a single overall measurement of the whole image quality that is given by the following formula:
M
MSSIM ( I, I ) = — E SSIM ( I i , I i ) (10)
Where I and I are respectively the reference and degraded images, I and I are the contents of images at the i-th local window.
M : the total number of local windows in image. The MSSIM values exhibit greater consistency with the visual quality.
VII. Algorithm
Before applying wavelet transform on the color image, the RGB color images are converts into YCbCr form, and then applying wavelet transform on each layer independently, this means each layer from YCbCr are compressed as a grayscale image. Fig.5 shows wavelet transform on each YCbCr layer. YCbCr refers to the color resolution of digital component video signals, which is based on sampling rates. In order to compress bandwidth, Cb and Cr are sampled at a lower rate than Y, which is technically known as "chroma subsampling." This means that some color information in the image is being discarded, but not brightness (luma) information. We obtains the best rate of compression using the rich less layer for the chromatic composante Cb and Cr.
Y = 0.2989 * R + 0.5866* G + 0.1145* B b = -0.1687* R - 0.3312* G + 0.5* B (11) Cr = 0.5* R - 0.4183* G - 0.0816* B
When the decomposition image is obtained, we try to find a way to code the wavelet transform into an efficient result, taking redundancy and storage space into consideration. After,we apply SPÏHT algorithm on each layer (y,Cr,Cb) independently .
RGB converted to

Apply SPIHT algorithm on
Apply DWT algorithm on
Fig 4: Complete steps image compression technique using wavelet transform (DWT) coupled with SPIHT
This process is repeated for every resolution in the case of level 3 decompositions. The encoding / decoding can be terminated at any time, with the best reproduction obtained up to that point. This is made possible because of the progressive nature of the coding algorithm.
-
VIII. Results and discussion
We will in this section applied wavelet transform color images on these images contain a lot of data redundancy, we present the performance of different wavelets using two incremental encoders to EZW and SPIHT image compression. The R, G and B of the color image are converted into YCbCr before application of the wavelet transform. Y is the luminance component; Cb and Cr have chrominance components of the image. The image is compressed for the different bits per pixel.
Our work is divided into three parts is to make a comparative study between different types of images, Zelda image, Retinal images, and Satellite images and applying the wavelet transform coupled with incremental encoders (EZW, SPIHT) with different filters.
For this reason we opted for a set of color images (ZERALDA, RETINAL, and SATELLITE) coded on 24 bits per pixel. For each application we vary sigma value 0.06 to 0.4 and calculate the PSNR and MSSIM.
The importance of our work lies in the possibility of reducing the rates for which the image quality remains acceptable. Estimates and judgments of the compressed image quality are given by the PSNR evaluation parameters and the MSSIM similarity Index.
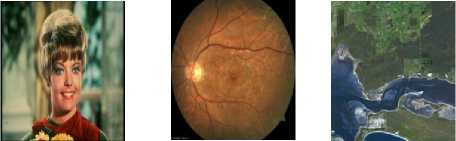
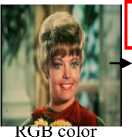
(a) (b) (c)
Fig 1: Popular test images (a) ZELDA, (b) RETINAL, (c) SATELLITE
Here, we adopt test Zilda color image of size 512x512 encoded by 24 bits per pixel for compression algorithm based on wavelet transform coupled with the SPIHT coder with another proposed algorithm (EZW) using different types of filters (cdf 9/7 (filter bank), CDF 9/7 (lifting) Gall5/3 lifting). For each application, we vary the rate of 0.125 to 2, with a decomposition level (N = 4). The results are shown in fig 5.
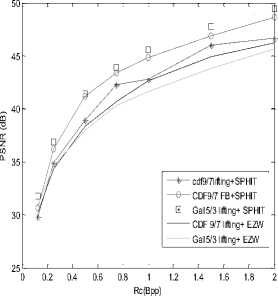
a. PSNR Varriation.
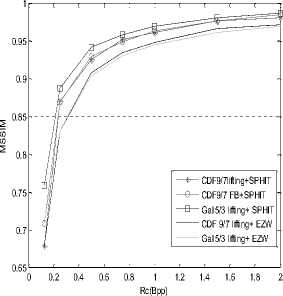
b. MSSIM Varriation.
Fig 5: Compression results of Zilda image
We note that the metric values increase with the bit rate of 0.125-2 bpp, it is clear that the PSNR values and MSSIM of Gall 5/3 lifting coupled with SPHIT are the best compared to other values.
We can say that the Gall5/3 filter lifting is best suited for test images.
We are interested in this work to compression of retinal images for this, we chose a retinal image size 512x512 (color) coded 24 bpp registered through retinography. This picture shows a diabetic patient.
a. PSNR Varriation.
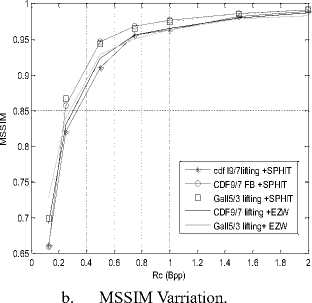
Fig 6: Compression results of the retinal image of a diabetic patient
We note that the wavelet coupled with SPIHT allow us to have better results and higher PSNR = 51.87dB means good quality image after reconstruction. It was a convergence of two curves (CDF Filter Bank) + SPHIT and that of Gall 5/3 lifting + SPHIT but the filter CDF 9/7 (Filter Bank) + SPHIT allows us the best results compared to other filters.
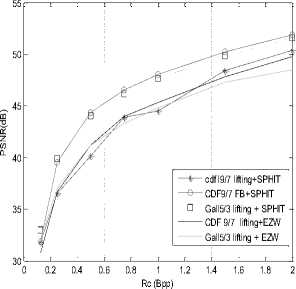
After showing the performance of the wavelet compression to medical images, we now apply our algorithm on the satellite images. To do so, we opted for a satellite image of 512x512 size (color) coded 24 bpp. To investigate the influence of the choice of filter and progressive encoder, we vary the rate of 0.125 to 2bpp, and calculate the evaluation (PSNR, MSSIM) parameters. The results are given in figure.
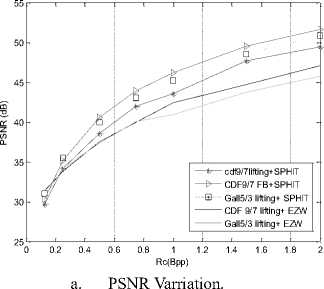
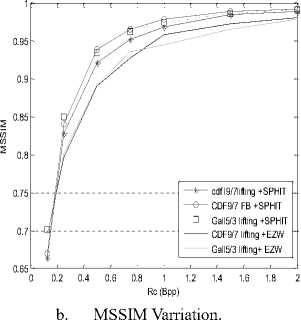
Fig 7: Compression results of satellite image
We note that wavelets allow us to have the best results with the encoder SPHIT, and PSNR = 51.61dB means high quality of the image after reconstruction. It was a convergence of two curves (CDF Filter Bank) + SPHIT and that of Gall 5/3 lifting + SPHIT but the filter CDF 9/7 (Filter Bank) + SPHIT allows us the best results compared to other filters.
To better compare the results obtained by the wavelet compression with the EZW and SPIHT coder for test, retinal and satellite images, we summarize the results in fig 8.
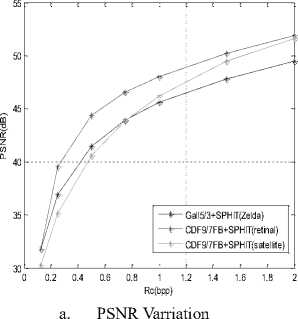
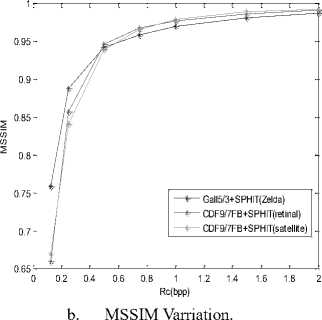
Fig 8: Compression results of the three images (Zelda, retinal and satellite)
Visually, for the three curves it is clear that the algorithm CDF (filter bank) + SPIHT allows us to have a good reconstruction of the image (good compression) so a better image quality, and this is proved by the values major evaluation parameters PSNR = 51.87 the highest value among the PSNR of the other images which shows the effectiveness of our algorithm with the filter CDF 9/7 (filter bank) in the medical field, it means a good quality image after reconstruction. The filter 7 CDF 9 / (Filter Bank) + SPHIT allow us to have the best results compared to other filters.
-
IX. Conclusion
The algorithm that we have implemented can be used in all images; strong performance of our algorithm is not only because of the wavelet transform, but also the superiority of the SPIHT coder. Its structure zerotrees allows significant gains in coding cards meaning. The performance of the algorithm on medical images was observed using a retinal gave its performance especially with the CDF (filter bank) filter.
Список литературы New Contribution on Compression Color Images: Analysis and Synthesis for Telemedicine Applications
- M. Nelson, “The data compression book“, 2nded., M&T books, New York, 1996.
- Said, W.A. Pearlman: An Image Multiresolution Representation for Lossless and Lossy Compression, IEEE Transactions on Image Processing, Vol. 5, No. 9, Sept. 1996, pp. 1303 – 1310.
- Zandi, J.D. Allen, E.L. Schwartz, M. Boliek: CREW: Compression with Reversible Embedded Wavelets, Data Compression Conference, Snowbird, USA, March 1995, pp. 212 – 221.
- A.R Calderbank, I. Daubechies, W. Sweldens, B.L. Yeo: Wavelet Transforms that Map Integers to Integers, Applied and Computational Harmonic Analysis, Vol. 5, No. 3, July 1998, pp. 332 – 369.
- W. Sweldens. The Lifting Scheme: A Custom-design Construction of Biorthogonal Wavelets. Applied and Computational Harmonic Analysis, Vol. 3, No. 2, April 1996, pp. 186 – 200.
- S.G. Miaou, S.T. Chen, S.N. Chao: Wavelet-based Lossy-to-lossless Medical Image Compression using Dynamic VQ and SPIHT Coding, Biomedical Engineering: Applications, Basis & Communications, Vol. 15, No. 6, Dec. 2003, pp. 235 – 242.
- Mohammed Beladgham, Abdelhafid Bessaid, Abdelmounaim Moulay Lakhdar, Abdelmalik Taleb-Ahmed, Improving Quality of Medical Image Compression Using Biorthogonal CDF Wavelet Based on Lifting Scheme and SPIHT Coding, SERBIAN JOURNAL OF ELECTRICATL ENGINEERING, Vol. 8, No. 2, May 2011, 163-179.
