New Intelligent-based Approach for the Early Detection of Disorders: Use on Rhinological Data

Автор: Alina S. Nechyporenko
Журнал: International Journal of Image, Graphics and Signal Processing(IJIGSP) @ijigsp
Статья в выпуске: 8, 2017 года.
Бесплатный доступ
Medical data are characterized by complexity, inaccuracy, heterogeneity, the presence of hidden dependencies, often their distributions are unknown. Correlations between factors of disorders, including clinical data, parameters of time series, patient’s subjective assessments have a high complexity that cannot be fully comprehended by humans anymore. This problem is extremely important especially in case of the early detection of disorders. Machine learning methods are very useful for such detection task. Special area of interest is a problem of breathing disorders. In the paper, author demonstrates the potential use of computational intelligence tools for rhinologic data processing. Implementation of supervised learning techniques will allow improving accuracy of disorders detection as well as decrease medical insurance company expenses. Proposed intelligent-based approach makes it possible to process a variety of heterogeneous data in the medical domain. A combination of conventional and fractal features for time series of rhinomanometric data as well as inclusion of hydrodynamic characteristics of nasal breathing process provides the best accuracy. Such approach may be modified for other breathing disorders detection.
Time series, early detection of disorders, classification algorithms, rhinomanometric signals,
Короткий адрес: https://sciup.org/15014207
IDR: 15014207
Текст научной статьи New Intelligent-based Approach for the Early Detection of Disorders: Use on Rhinological Data
Published Online August 2017 in MECS DOI: 10.5815/ijigsp.2017.08.01
Early detection of disorders is an extremely important problem in medical practice. It allows avoiding an unnecessary treatment and reducing of insurance costs. According to statistics [1], specialists should especially pay attention to breathing disorders. These include a wide range of pulmonary system pathologies [2], lung cancer [3], disorders of nasal breathing [4] and others. A process of early detection is mostly based on analysis of clinical data and time series signals. A clinical dataset usually comprises specific features from a clinical aspect and it is in accordance with the current medical domain knowledge [5]. Breathing signals’ acquisition is based on well-known instrumental methods such spirometry, rhinomanometry, polysomnography, plethysmography. The pulmonary plethysmographs are widely used to measure a volume of the lungs for monitoring breath in clinical setups [3], polysomnography is considered as the standard method for sleep apnea detection [6].
Results of measurements using such instrumental methods comprise an airflow rate, a differential pressure and acoustic signals. A wide range of techniques is used for signals processing for informative feature extraction. Most of them are based on the analysis of global integral statistical properties and significant parts of signal [7]. However, these methods are not suitable in practical sense in many cases. Signals mentioned above have common particularities. A dynamic nature of the breathing system causes them exhibit a nonstationary and quasi-periodical behavior. This may be explained by presence of chaotic properties. In [8], the analysis of signal’s fractal properties was performed. It was shown that such characteristics are indispensable features for detection of disorders.
In this paper, we will focus on detection of rhinological disorders. Rhinological disorders mostly have a symptom of nasal obstruction. An overview of methods for diagnostics of nasal breathing function is given in [9]. All standard diagnostic coefficients obtained from measurements have a number of dimensions and depend on specific anatomico-physiological features of a person. This fact reduces the effectiveness of disorders detection. Many patients including patients who had surgery according to [10] evaluate results of diagnosis as unsatisfied. A special problem is the differential diagnosis between structural changes and mucosal disorders. In additional, for example, symptoms of vasomotor rhinitis [11] may come and go throughout a long period. So, this fact demands a long time period of observing by Ear, Nose, Throat (ENT) specialist. Thus, the task is to search new ways for overcoming these disadvantages.
Considering specifics of the nasal breathing process, we should take into account a physics of the process. In [9, 12, 13, 14] a value of aerodynamic characteristics of the airflow has been proven.
A purpose of the current work is to develop a new approach for early detection of disorders in rhinology, which allow specialists to improve a quality of diagnosis in (ENT) domain. As a part of decision support system, the proposed approach should be accomplished through usage of features derived by a complex of methods. For detection of nasal breathing disorders it consists of the hydrodynamic characteristics, features extracted from time series and clinical data obtained from expert evaluations.
To support the ENT specialist in his decisions, the intelligent decision support system was designed. System implements machine-learning algorithms to provide a recommendation, based on a history of cases analyzed by experts to each specific case. The major research challenge to address is how to extract meaningful features from a large amount of heterogeneous data (CT-scans and the associated 3D reconstruction, rhinomanometric time series, results of medical exams and other relevant information associated to the patient). These data appear to be very high dimensional, and needs to be suitably processed before being fed to a learning algorithm. Thus, the proposed approach consists of the data preprocessing stage, feature extraction, feature selection and classification.
The rest of this paper is organized as follows. In Section II, the author describes a process of data acquisition including signal processing, feature extraction, feature selection and a classification strategy. Section III shows a result of classification. Finally, Section IV concludes this paper.
-
II. Matherials and Methods
-
A. Data acquisition
Signals of the airflow rate and the differential pressure were recorded for volunteer subjects who had rhinomanometry procedure at Kharkiv Scientific-Practical Center of ENT diseases. The system used in current research was originally designed to simultaneously measure the airflow rate and the differential pressure during a breath according to Active Anterior Rhinomanometry method. The system design has previously been described in detail [8]. It was certified in Ukraine, certificate of the state registration № 14777/2015 from 06.12.2015. A measuring module based on two sensors: an ultralow pressure sensor and a low pressure drop digital flow meter. A sampling rate of signals’ measurement is 100 Hz. Signals are presented in Fig. 1.
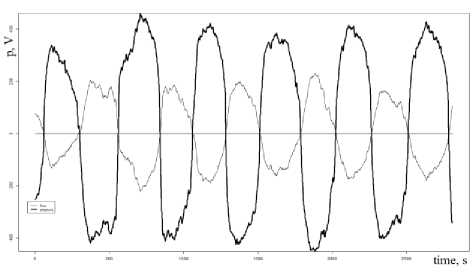
Fig.1. The airflow rate and the differential pressure as a function of time
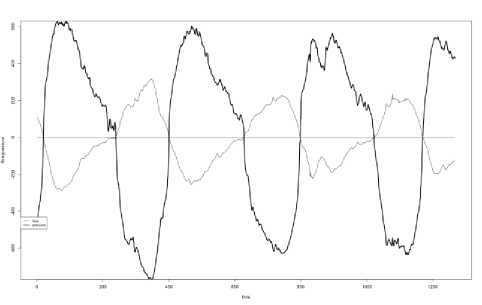
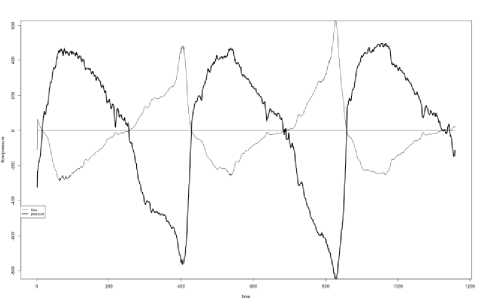
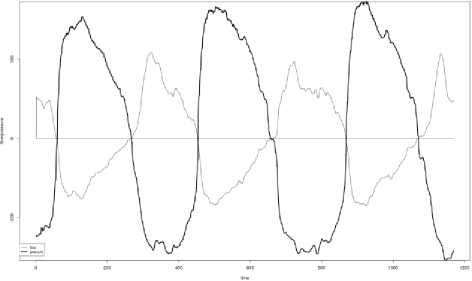
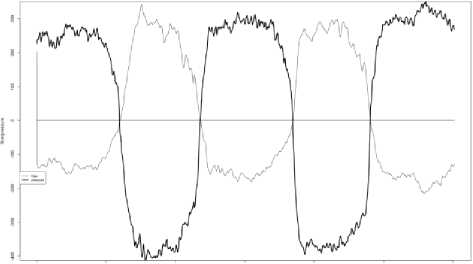
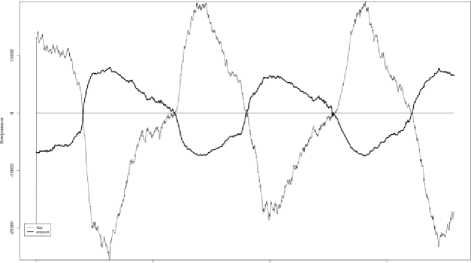
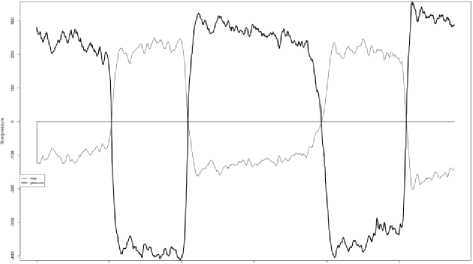
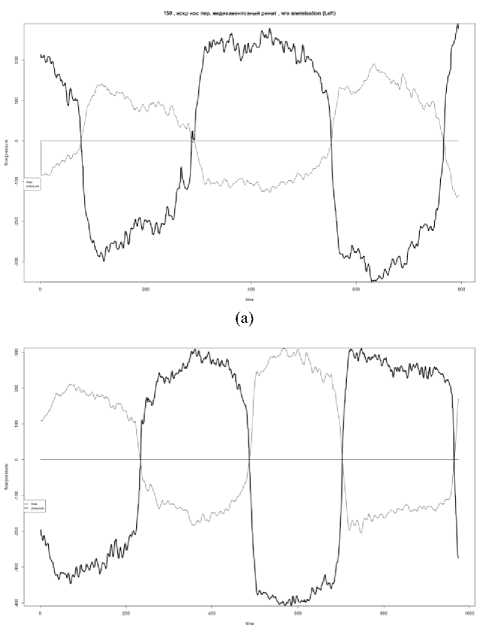
A measuring range of the differential pressure is ±1200 Pa. A limit of a reduced error of the differential pressure measurement is γp = ±0,25% . The digital flow meter is designed for high-volume applications. A measuring range of the airflow rate is ±1200 cm3/s. A limit of the relative error of the airflow rate measurement is δp = ±3% . A preprocessing stage with filtering techniques for noise reduction was implemented according to [15]. The collected data set consists of 1076 measurements of ENT patients. Each measurement comprises airflow rate and differential pressure signals. Procedure of measuring is carry out according to recommendations of ISCOANA [9]. An examples of measurements for rhinitis and for septal deviation are presented in Figs. 2 and 3.
(a)
(b)
(c)
(c)
(d)
(d)
Fig.3. Rhinomanometric time series for “septal deviation”
Fig.2. Rhinomanometric time series for “rhinitis”
(b)
During this investigation, the author figured out that some meaningful information is concerned only in time series of the airflow rate. So, the further research will be connected with airflow rate signals processing. Author uses R for signal processing and feature extraction.
Clinical data was derived from expert evaluation including description of CT-scans by radiologists, data of patient’s history and subjective assessments (VAS-visual analog scale) [9]. These data were analyzed using few preprocessing techniques: replacing missing values, discretization of attribute values, and normalization.
-
B. Feature extraction
A principal task of the proposed approach is to identify hidden meaningful information in the initial data. Many features can be derived from a time series waveform. Extracted features will be derived from an initial signal using statistical, spectral and fractal analysis. For the first group, ten features were obtained: peak airflow rate PIF (cm3/s); average airflow rate AIF (cm3/s); maximum inspiration airflow rate acceleration MIFA (cm3/s2); total inspiration volume TIV (cm3). Also skewness
E ( x - µ ) 3 k a = σ 3
and kurtosis
E(x-µ)4
ke= σ4
were calculated, where µ and σ are the mean and the standard deviation of the signal respectively. A crest factor was obtained according to kam
PIF
RMS
where RMS stands for Root Mean Square of signal. A parameter r t , as a ratio of time at PIF / total time of inspiration phase; form factor F f as a ratio RMS / mean of airflow rate of inspiration phase; the inverse power law 1/f β of the power spectrum were also defined.
Rhinomanometric signals are quasi-periodical, nonstationary and nonlinear [8]. Taking into account this fact, the analysis relies on a model of time series pq∞
x [ n ] = - ∑ a [ k ] x [ n - k ] + ∑ b [ k ] u [ n - k ] = ∑ h [ k ] u [ n - k ] k = 1 k = 0 k = 0
where x[n] is a sequence at the output of the causal filter h[k] = 0 ,k < 0 , u[n] is an input sequence, a[k] , b[k] denote parameters of autoregressive model. A class of such models which use characteristics of the white noise process are described in [16]. The power spectral density is calculated using
P ˆ АR ( f ) =
Tp ˆ ω
1 + ∑ p a ˆ[ k ]exp( - j 2 π fnT ) n = 1
where a[k] is linear prediction coefficients, p ю designates for the white noise variance estimation. Thus, we have a robust method with high frequency selectivity and a good noise reduction characteristic. Calculation results are shown in Figs. 4 and 5.
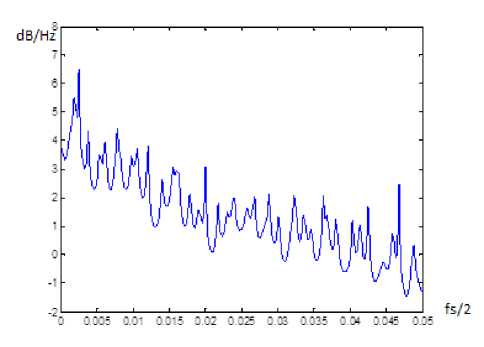
Fig.4. The power spectral density for a patient without disorders
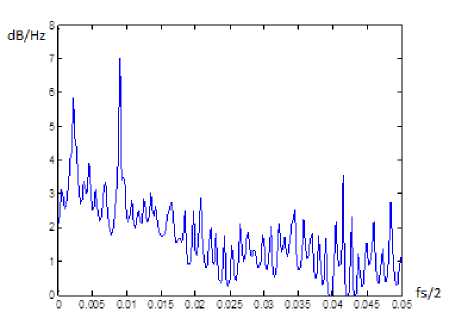
Fig.5. The power spectral density for a patient with disorders (vasomotor rhinitis)
We can observe a distinguishable spectral peak in Fig. 5 which means a disorder. It was investigated the area of interest Par : [0.005,0.05] is a special frequency range corresponding to sympathetic and parasympathetic activity. Spectral harmonic with a high amplitude α indicates such rhinological disorders as vasomotor rhinitis and may be calculated using a step on frequency and a sampling frequency. This relationship should be proved with the help of big statistics. In our case, such spectral harmonic was observed in 44 % cases of the data set.
As a result of such analysis, we obtained the following group of features: SC={PIF, AIF, MIFA, TIV, k a, k e , k am , r t , F f , α , β }.
The nonlinear approach to extract the hidden features from time series was applied at the next stage. Nonlinear time series analysis was based on calculation of the Hurst parameter
R ( τ ) = R / S =
S ( τ )
max( xcum ( t , τ )) - min( xcum ( t , τ ))
, t = 1, τ
1τ
∑ ( x ( t ) - x )2
τ - 1 t = 1
where R( t ) is a range of cumulative time series xcum(t, T ) , S( t ) is a mean square deviation according to
x(τ) = 1 ∑τ x(t) τ t=1
xcum(t,τ) = ∑t x(i) -x(τ).
t = 1
The Lyapunov exponent was calculated using
x' = ln x(t + iτ) + ε,i = 0,N -1
where τ is a step of sampling.
A correlation dimension D 2 is
D 2 =
C ( r u ) - C ( r l )
r u C ( r ) dr r l r
where a correlation sum C(r)
NN
С ( m , r ) = N ( N - 1) ∑ i ∑ i > j Θ ( r - II y i - y j II)
N(N ) i i>j
and y are m-dimensional delay vectors, N denotes a number of points, and Θ is the Heaviside function: Θ ( x) equals zero for x<0 and one for x ≥ 0 [17, 18].
The box-counting dimension was obtained as
D 0 = lim ∈ →∞(log N / Log (1/ ∈ )))
and the Higuchi`s dimension [17] may be calculated using
( L(k))=∑kLm(k)
m=1 k where ( L(k) ) computed a curve length for different k and it is related to the fractal dimension D
L ( k ) ∝ k - D 0 .
Calculation results for the fractal dimension is D ∊ [1.77,1.84], H ∊ [0.13,0.2] is for the Hurst parameter, L ∊ [0.17,0.19] is for high Lyapunov exponent. A group of features consists of FC={H,CD,BCD,HD}.
A next step is obtaining significant features from various models of fitting rhinomanometric curves [9, 12, 19]. So the dataset consists of parameters which describe aerodynamic characteristics of the breath HC={R eff , k 2 , R100,VR, ξ ,R2,deq}, where Reff an Effective Resistance, k2 a coefficient of the turbulent flow, R100 a nasal resistance coefficient on a level of the differential pressure 100 Pa, VR a Vertex Resistance, R 2 a parameter of the Broms model [9], ξ a coefficient of hydrodynamic resistance of nasal cavity, d eq an equivalent diameter [12].
Another group of significant features was obtained as a result of a patient' history, expert evaluation and subjective data assessment according to the Visual Analogue Scale test. This group can be expressed as EC={CTD, PH, SM, AL, VAS}, where CTD a description of CT-scans, PH a patient history, SM a factor of smoking, AL allergies, VAS –the Visual Analogue Scale.
-
C. Feature selection
As soon as we assemble four sets of features, we feed it further as an input vector to the classification algorithm. Feature selection is regarded as a classic method to prevent overfitting by eliminating redundant features. In real-time detection scenario, it is also an effective way to reduce the computational load by requiring less signal processing in feature extraction, to lower the rate of data transmission and energy consumption, to shorten the time required for model building during the training process.
Selection of the most informative features in groups SC={PIF, AIF, MIFA, TIV, k a, k e , k am , r t , F f , α , β } and FC={H,CD,BCD,HD} was performed by means of Correlation-based Feature Selector (CFS)
Ms =
kr cf
V k + k ( k - 1) r
where Ms stands for a correlation coefficient, r cf is a mean correlation between features and a class attribute, r ff designates for an average correlation between features [20].
Selection of the most informative parameters in a group HC={R eff , k 2 , R 100 ,VR, ξ ,R 2 ,d eq } was obtained according to [21]. This approach to feature selection uses a fuzzy regression model based on the least-angle regression ( LARS) method for significant feature selection. Such method allows reducing a number of input parameters of the model, which avoids the model’s overfitting. The results allow us to distinguish two significant model coefficients that affect the predicted degree of obstruction.
A group of features EC={CTD, PH, SM, AL, VAS} was analyzed using the Gain Ratio (GR) metric [20]. This metric is based on the Information Gain (IG) method and eliminates its weakness, which appear in case of large numbers of unique values. GR divides IG by entropy of the considered feature
GR ( C , A ) =
H ( C ) - H ( CIA ) H ( A )
where H ( CIA ) is the entropy of a feature C.
As a result of implementation of these methods, an input vector for the classification algorithm was obtained MC = {k 2 , ξ , PIF, k e , k am , α , H, BCD, CTD, VAS}. Before the classification procedure starts the data normalization should be implemented. To bring variables into the range {+h, -l} an expression Xn = (x - min(x)) / (max(x) - min(x)) * (h - l) + l was applied.
-
D. Classification
The effectiveness of the proposed approach is analyzed considering a binary classification procedure, i.e., classifying the results into two groups: structural disorders and vasomotor disorders. The classifier should be trained using features extracted from set of supervised cases, namely cases associated to the disorders and their treatment recommended by an expert.
A classifier implemented in this research is the support vector machine (SVM) [22]. The SVM algorithm has already been used for rhinomanometric data classification [15]. Since the data in our case are linearly inseparable, the SVM with the radial basis function (RBF) kernel was chosen. The polynomial kernel always gave higher accuracy than the linear kernel classification. In this case, a problem of constructing a separating hyperplane transforms into a dual search for the saddle point of the Lagrange function and reduces to the quadratic programming problem containing only dual variables
S SS
- L ( A ) = - X A i +^X X A i A T УУ т к ( Z , Z t ) ^ min i = 1 2 i = 1 T = 1
S
к Ay = 0, i=1
О < a.< c , i = 1,5, where Ai is a dual variable, Zi means an object of a training data set, yi is a value “-1” or “+1”, it characterizes whether an object belongs to one of the classes, k(z ,z ) kernel function, C denotes a regularization parameter, S stands for a number of objects in a training data set i = 1, S . The kernel function is calculated using
S
f(z) = X АУ exP [-(zi - zt , zi - zT) / (2^2)]+b. i=1
The implementation of such classifier depends on two parameters: the regularization parameter C and the RBF inverse parameter /
7 =
2 ^
.
The parameters C and у must be tuned to achieve an acceptable trade-off between performance and overfitting. A decision about belonging of the object z to the "-1" or the "+1" is adopted according to:
F ( z ) = sign ( f ( z )) =
S
= sign (X AiVi exp [-( z.- Zt , Zt- z^ I (2ct 2)]) + b i =1
Experimental results are presented in the next Section.
-
III. Experimental Results
We compare the results obtained by the SVM and Random Forest (RF) [23, 24, 25] classifiers.
The optimal parameters for SVM with the FBF kernel using a ten-fold cross validation procedure: C = 11 and Y = 0 , 01 were obtained.
The data set was divided into learning and test data sets. Learning data set takes 85% and test set takes 15% from a general quantity. For classification, we used three set of features: all features, features excluding nonlinear parameters and features excluding parameters which describe the hydrodynamic characteristics of data. Thus we can estimate the influence of these groups of data properties. Classification results are presented in Table 1.
Table 1. Classification results for all features and with groups of features excluded
|
Feature set |
Learning RF [%] |
Learning SVM [%] |
Test RF [%] |
Test SVM [%] |
|
All features |
91,6 |
94,1 |
82,5 |
87,0 |
|
Nonlinear features excluded |
82,1 |
84,2 |
72,4 |
75,1 |
|
Hydrodynamic features excluded |
79,2 |
81,0 |
64,2 |
67,4 |
The classification results were obtained for the initial data set of 1076 patients with selected ten features for each record. Data were preliminarily classified by otolaryngologists into two classes of disorders: rhinitis and septal deviation.
When the nonlinear features were excluded and only conventional, hydrodynamic and patient ’ s anamnesis features were used the classification performance decreased as is shown in Table 1. When the hydrodynamic features were excluded, the classification performance dramatically decreased. Thus, we can conclude that these features have the greatest impact on detection of disorders. The best results were achieved using the SVM classifier with full data set.
-
IV. Conclusion
In the current research, the new intelligent-based approach for the early detection of disorders is proposed. The application of the method on rhinological data is realized. It is novel automated technique for classifying of structural and vasomotor disorders. The early detection of nasal breathing disorders will allow avoiding unnecessary surgery and reducing the costs on treatment.
It was shown that signals of breath have common particularities, because of nonstationary quasi-periodical behavior of breathing process. The different groups of informative features were obtained and influence of few groups on classification accuracy was investigated.
The new method integrates a multitude of heterogeneous data. When the nonlinear features as well as hydrodynamic features were excluded and only conventional features were used the classification performance decreased. So we can conclude that a combination of different groups of features which describe the physics of breathing process can increase a quality of disorders detection. Both fractal and hydrodynamic characteristics of rhinological data affect accuracy of classification. Further investigation in this direction will allow investigating the procedure of detection for other classes of disorders.
The proposed approach can be used for postoperative evaluation to estimate the efficiency of the different methods. The postoperative evaluation in the functional surgery has a significant meaning for the clinical trials. ENT specialist chooses between surgery and conservative treatment using the different diagnostic tools: CT, Acoustic Rhinometry, Rhinomanometry, CFD, VAS. The proposed approach will provide an improvement of the prediction of human risks related to surgery.
Acknowledgment
The author would like to thank Prof. O.I. Mikhalyov and Dr. O.G. Garyuk for useful discussions and suggestions regarding this work.
Список литературы New Intelligent-based Approach for the Early Detection of Disorders: Use on Rhinological Data
- A. A. Morsy, K. M. Al-Ashmouny, “Sleep Apnea Detection Using an Adaptive Fuzzy Logic Based Screening System”, Proceedings of the 2005 IEEE Engineering in Medicine and Biology 27th Annual Conference, Shanghai, China, pp. 6124-27, 2005.
- J.S. Reynolds, W.T. Goldsmith, J. B. Day, A. A. Abaza, A.M. Mahmoud, A.A. Afshari, Jacob B. Barkley, E.L. Petsonk, M.L. Kashon, D.G. Frazer, “Classification of voluntary cough airflow patterns for prediction of abnormal spirometry”, Journal of biomedical and health informatics, Vol.20, Iss.3, pp. 963-969, 2016.
- A. Abusharka, M. Faezipour, “Acoustic signal classification of breathing movements to virtually aid breath regulation”, Journal of biomedical and health informatics, Vol. 17, Issue 2, pp. 493-500, 2013.
- C. Chaves, C. Ribeiro de Andrade, C. Ibiapina, “Objective measures for functional diagnostic of the upper airways: practical aspects”, Rhinology, Vol. 52, no. 2, pp. 99-103, 2014.
- K. P. Exarchos, Y. Goletsis, “Multiparametric decision support system for the prediction of oral canser reoccurrence”, Journal of biomedical and health informatics, Vol.16, Iss.6, pp. 1127-1134, 2012.
- Xie B., Minn H., “Real-time sleep apnea detection by classifier combination”, IEEE Transactions on information technology in biomedicine, vol. 16, no. 3, pp. 469-477, 2012.
- N. Bogunovic, A. Jovic, “Biomedical nonlinear signals by data mining methods”, Proceedings of 17th Conference on Systems, Signals and Image Processing IWSSIP, pp. 276-280, 2010.
- A. Nechyporenko, “Rhinomanometric signal processing for selection of formalized diagnostic criterion in rhinology”, Telecommunications and Radio Engineering, Vol.74, no.14, pp. 1285-1294, 2015.
- K. Vogt, A. A. Jalowayski, W. Althaus, C. Cao, D. Han, W. Hasse, H. Hoffrichter, R. Mosges, J. Pallanch, K. Shah-Hosseini, K. Peksis, K. D. Wernecke, L. Zhang and P. Zaporoshenko, “4-Phase- Rhinomanometry (4PR) – basics and practice 2010”, Rhinology Suppl. 21, pp. 1-50, 2010.
- H. L. Thulesius, “Rhinomanometry in clinical use. A tool in the septoplasty decision making process”, Ph.D. dissertation, Department of Otorhinolaryngology, Head and Neck Surgery, Clinical Sciences, Lund University Sweden, 2012.
- P. Wheeler, S. Wheeler, “Vasomotor rhinitis,”Am. Fam. Physician, no. 72(6), pp. 1057–62, 2005.
- V.V. Chmovzh, A.S. Nechyporenko, O.G. Garyuk, “System approach to finding hydrodynamic resistance coefficient on a nasal cavity”, Computer science, information technology, automation journal, № 4, pp. 8-15, 2016.
- F. Chometon, P. Gillieron, J. Laurent et al., “Aerodynamics of nasal airways with application to obstruction,” Proceedings of the 6th Triennial International Symposium on Fluid Control, Measurement and Visualization, pp. 65–71, 2000.
- C. Chaves, C. Ribeiro de Andrade, C. Ibiapina, “Objective measures for functional diagnostic of the upper airways: practical aspects”, Rhinology, Vol. 52, no 2, pp. 99-103, 2014.
- A. Yerokhin, A. Nechyporenko, A. Babii, O. Turuta, “Usage of F-transform to Finding Informative Parameters of Rhinomanometric Signals”, Proc. of the X International Scientific and Technical Conference “Computer Science and Information Technologies CSIT 2015”, Lviv, 14-17 September, pp. 129-132, 2015.
- S. L. Marpl, Digital spectral analysis with applications, Prentice Hall, New-Jersey, 571 p, 1990.
- J. Spilka, V.Chudacek, M.Koucky, L.Lhotska, M.Huptych, P.Janku, G. Georgoulas, C. Stylios, “Using nonlinear features for fetal heart rate classification”, Biomedical signal processing and control, № 7, p. 350-357, 2012.
- O. V. Spirintseva, “The Multifractal Analysis Approach for Photogrammetric Image Edge Detection”, Journal of Image, Graphics and Signal Processing, 12, pp. 1-7, 2016.
- E. B. Kern, “Committee report on standardization of rhinomanometry,” Rhinology, vol. 19(4), pp. 231-236, 1981.
- M. Gasparovica-Asite, I. Polaka, L. Alekseyeva, “The impact of feature selection on the information held in bioinformatics data”, Information Technology and Management Science, 18, pp. 115-121, 2015.
- A. L. Yerokhin, A.S. Babii, A.S. Nechyporenko, O.P. Turuta, “A Lars-Based Method of the Construction of a Fuzzy Regression Model for the Selection of Significant Features”, Cybernetics and Systems Analysis, Vol.52, no.4, pp 641–646, 2016.
- C. Cortes and V. Vapnik, “Support-vector network”, Machine Learning, Vol. 20, no. 3, pp. 273-297, 1995.
- L. Breiman, “Random forests”, Machine Learning, no. 45(1), pp. 5–32, 2001.
- N. Indurkhya, F. J. Damerau, Handbook of Natural Language Processing, Second Edition, - Chapman & Hall/CRC Machine Learning & Pattern Recognition, 2nd Edition, 704 p., 2010.
- S. Venkatalakshmi, J. Janet, “Classification of Mammogram Abnormalities Using Pseudo Zernike Moments and SVM”, Journal of Image, Graphics and Signal Processing, 4, pp. 30-36, 2017.
