New metrics for effective detection of shilling attacks in recommender systems

Author: T.Srikanth, M.Shashi
Journal: International Journal of Information Engineering and Electronic Business @ijieeb
Article in issue: 4 vol.11, 2019.
Free access
Collaborative filtering techniques are successfully employed in recommender systems to assist users counter the information overload by making accurate personalized recommendations. However, such systems are shown to be at risk of attacks. Malicious users can deliberately insert biased profiles in favor/disfavor of chosen item(s). The presence of the biased profiles can violate the underlying principle of the recommender algorithm and affect the recommendations. This paper proposes two metrics namely, Rating Deviation from Mean Bias (RDMB) and Compromised Item Deviation Analysis (CIDA) for identification of malicious profiles and compromised items, respectively. A framework is developed for investigating the effectiveness of the proposed metrics. Extensive evaluation on benchmark datasets has shown that the metrics due to their high Information Gain lead to more accurate detection of shilling profiles compared to the other state of the art metrics.
Recommender Systems, Collaborative Filtering, Shilling Attacks, Preprocessing, Profile Injection, malicious users, compromised items, Shilling Profiles, Attack detection
Short address: https://sciup.org/15016182
IDR: 15016182 | DOI: 10.5815/ijieeb.2019.04.04
Text of the scientific article New metrics for effective detection of shilling attacks in recommender systems
Published Online July 2019 in MECS
Collaborative filtering (CF) systems making personalized recommendations from a large number of options are widely used in e-commerce services like Grouplens[14], Ringo[15],Amazon, YouTube, Facebook, last.fm etc. Collaborative filtering technique is widely used in machine learning research because of its domain free nature. CF recommender systems are developed based on the conviction that everyone in the user community is fair and only gives genuine feedback [8]. Unfortunately, malicious users giving faulty feedback might alter the system functionality. A CF recommender system is said to be attacked, when the functionality of the recommender system is intentionally influenced resulting in inaccurate recommendations. The intent of the attack is either to promote certain item(s) or to demote item(s) referred to as push or nuke attack, respectively.
Prediction capability of the recommender system may be altered for wrongful gain by providing counterfeit feedback from a group of users. Users having a common goal are known as shills and the attack is known as shilling attack or profile injection attack [10]. Shilling profiles are similar as they were created with a common intent [7]. The distortion in ratings in the form of shilling profiles violates the underlying modeling assumptions of the recommender system and may compromise the prediction quality of recommender system [10].Thus, discovering shills hidden in recommender systems is crucial to enhance the standard of the recommendations. Detection and removal of fake user profiles from the system is error-prone, because strict screening may result in misclassifying a genuine profile as fake profile leading to low precision. On the other hand, accepting fake profile as genuine profile is detrimental to the system performance in terms of recall. Both precision and recall should be high for the detection algorithm in separating malicious profiles from normal profiles. Current techniques could not achieve a good tradeoff in identifying malicious users; PCA is an exception but suffers high latency in time.
Types of attacks on the recommender systems, attack detection techniques, robustness of the algorithms with cost benefit analysis were studied in the literature [7]. The attack detection methods proposed in the literature are broadly divided into supervised and unsupervised detection methods. Supervised methods are trained with labeled data in order to classify unlabeled user profiles into malicious and genuine users. Unsupervised methods use heuristics based on adhoc rules and analyze the ratings pattern to differentiate between normal and shilling profiles. Both supervised and unsupervised methods make use of the generic attributes derived from the rating patterns to detect shilling profiles. Semi supervised methods also exist in the literature which require more time than the methods mentioned above [17].
This paper proposes two novel metrics, namely Rating Deviation from Mean Bias (RDMB) and Compromised Item Deviation Analysis (CIDA). RDMB identifies the suspicious malicious users, while CIDA identifies the compromised targeted item(s) from the suspicious malicious profiles.
A framework is developed to investigate the effectiveness of these newly devised metrics for identifying shilling profiles belonging to four different attack models. The rest of the paper is organized as follows. Section-II describes related concepts and existing literature. Section-III describes the proposed metrics and the corresponding framework. Section-IV illustrates the Experimentation. Section-V covers the results analysis followed by conclusion in Section VI.
-
II. Related Concepts And Existing Literature
This section describes about the popular attacks in Recommender System. Finally, popular shilling attack detection methods are reviewed.
-
A. Attack Models
According to the intent of the attacker and the attack model chosen for inserting the synthetic profiles, the total set of items (I) in the database is partitioned into four mutually exclusive subsets namely Target Set (IT) , Selected Set(Is), Filler Set(IF) and Empty Set(I0).Hence, the total number of items in the database is given as |I| = |Ir| + |Is| + |IF| + |I0| . The general form (template) of a shilling profile is shown in Fig.1 Items of the target set (IT) are the items which are given maximum or minimum ratings assigned by the function /?with the objective of promoting(push attack) or demoting(nuke attack) the item. The Target set may contain a single item or multiple items. Selected set (IS) contains either popular or unpopular items selected across the whole database based on push attack or nuke attack, respectively. The function Sis used to assign ratings to items in the selected set. Items in the filler set (IF) are selected randomly and are assigned ratings given by a pseudo random number generator function у based on the attack model.The selection and ratings of the filler items may differ among a group of shilling profiles, in order to disguise the profiles as genuine profiles. The set of items with no ratings in the profile are referred to as Empty set.
This research work studied the effectiveness of proposed metrics for the detection of shilling profiles belonging to two basic attack models namely Random and Average attack and their specific tailor-made extension models for push and nuke attacks, namely Bandwagon and Reverse Bandwagon attacks. Table.1 depicts the rating pattern of items belonging to Is, IF and IT sets for shilling attack profiles under the four different attack models. N (μ,σ) denotes the normal distribution with mean μ and standard deviation σ of all items, μi and o i refers to the mean and standard deviation of item iover all users who rated the item.
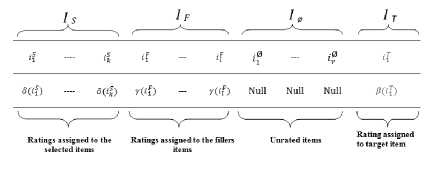
Fig.1. General Form of an attack profile
Table 1. Summary of Attack Models
|
Attack Model |
^(selected set) |
IF (Filler set) |
IT (Target set) |
|
Random |
0 |
Randomly chosen items {i e i f | у(!/)~ NO,a)} |
Ж) = r„„ for push attack |
|
Average |
0 |
Randomly chosen items {i e I f | у(1/)~ NQ^a)} |
Ж) = r„„ for push attack |
|
Bandwagon |
Randomly chosen items {i e I s l S(i f ) = ' m., : |
Randomly chosen items {i e I f I y(iF)~ N(/i,a)} |
№1) = ’ max for push attack |
|
Reverse Bandwagon |
Randomly chosen items {i e I s l S ( i s ) = ’ min } |
Randomly chosen items {i e I F | y (i F ) ~ NU’a ) } |
№) = ’ min for nuke attack |
-
i) Random Attack
Random attack [3, 10] can be considered as the naïve attack of all attacks models as it requires little knowledge of the rating distribution. Target item is assigned maximum or minimum rating value for push attack or nuke attack, respectively. There are no elements present in the selected set. Filler items are chosen arbitrarily and assigned random ratings drawn from normal distribution with mean and standard deviation over all items.
-
ii) Average Attack
Average attack [3, 10] is similar to random attack except that each filler item is assigned rating drawn from the normal distribution with the corresponding item mean and item standard deviation. Average attack requires a comprehensive knowledge on the rating distribution.
-
iii) Bandwagon Attack
Bandwagon attack [3] can be viewed as an extension to the random attack where a set of popular selected items are also included. Frequently rated items which are more popular are randomly included in selected items set and assigned maximum value making the profile to be similar to more number of genuine users. Filler items are assigned random values in the profile.
-
iv) Reverse Bandwagon Attack
Reverse Bandwagon Attack model [12] is used for Nuke Attack. It is a variation of Bandwagon Attack. Frequently rated items which are normally disliked are randomly included in selected items set and assigned a minimum value along with the target. Filler Items are assigned Random values.
-
B. Attack Detection
Chirita et al. [5] proposed two metrics, namely Rating Deviation from Mean Agreement (RDMA) and Degree of Similarity with top neighbors (DegSim) for detecting malicious profiles. RDMA measures the deviation of agreement from other users on a set of target items, combined with the inverse rating frequency for these items. DegSim estimates the average of the similarities of the top k nearest neighbors with the current user using Pearson correlation.
Burke et al. [4], derived two new metrics, namely weighted deviation from mean agreement (WDMA) and weighted degree of agreement (WDA) relying on RDMA. WDMA metric is similar to RDMA, but places greater weight on the ratings of sparse items by using square of the inverse rating frequency for these items. WDA, ignores the number of ratings per item, thus only numerator part of the RDMA is considered. Burke et al. [4] also proposed length variance (lengthVar), which measures the deviation in length of a given user profile from the average length, where length is the number of ratings available in the database for the profile.
Zhang et al. [18] proposed TWDMA metric derived from RDMA attribute weighted by trust values used to prevent malicious users in trust-based systems.
Bryan et al. [2] analyzed the attack profile detection is analogous to identification of bi-clusters in gene microarray expression data. Variance-adjusted Hy score was used for the unsupervised retrieval of attack profiles in recommender systems. Profiles having higher Hy — score are identified as malicious profiles.
Bhaumik et al. [1] has shown the use of two statistical process control (SPC) based techniques, namely X-bar control limit and Confidence Interval control limit in the detection of abnormal profiles. Items which fall outside these limits are marked as suspicious items.
Zhou et. al [19] proposed improved statistical metric based on DegSim (Degree of Similarity with Top Neighbors) and RDMA(Rating Deviation from Mean Agreement) which are used to distinguish attack profiles from normal profiles using target item analysis.
Variable selection techniques such as PCA and clustering techniques such as PLSA were applied to detect shilling attacks using statistical methods [11]. PCA-Var Select performance is better than PLSA in detecting attack profiles [11]. PCA has advantage over PLSA in the ranking users using cumulative similarity to other users.
Gunes et al. [7] provides a comprehensive review on various attack detection methods classifying them into supervised, unsupervised and semi supervised methods.
-
III. Proposed Metrics For Attack Detection
Baseline predictors also known as biases [9] capture the effects which do not involve user-item interaction. General form of a baseline predictor is given as:
? u,i = H + b u + b i (1)
The prediction of user u for item i is represented as ru ,i , ц is the average of all ratings in the database, bMand b i are user and item bias, respectively. The set of users rated for ith item and the set of items rated by uth user are denoted by U i and Iu respectively. The bias of user is defined as the average deviation from global mean(^) as follows:
b u = lIul ^ e I u (ru,i ^ (2)
Inserting several attack profiles into the database of the recommender system affect the bias of the target items. This paper proposes new metrics to find the bias inserted by the malicious users using baseline predictors [9] and the algorithm [16] used for rating prediction in collaborative filtering-based recommender systems. Each non-zero-rating entry in the sparse rating matrix is transformed as:
A u,i = r^ — b u — avgb (3)
Where
(E iU-U. “ ' (r -j -b u ))
avgb = ( |U|.|1| ) (3Л)
The entryru ,i represents the user-item pair (u,i) in the sparse rating matrix.Rmxn, where m and n are the number of users and items in the system, respectively. Au,i represents the entry for user-item pair(u,i) in transformed matrixЛтхпwhich isalso sparse. Equation (2) removes user-bias and av g b from the corresponding rating entries in the matrix leaving residue of rating having global average and corresponding item bias, according to equation (1). The term avgb represents the average bias of all the items in the database spanning over all users as given in equation (3.1).
Rating Deviation from Mean Bias (RDMB)
RDMB measures the user deviation from agreed meanbias of all items in the database.
RDMB u =
у (Aui) L ie/ N ;
S ieK A ui ) 2
XUi is the value in the transformed matrix, N is the number of available ratings of itemi in the database. Numerator in RDMB is the cumulative residue value obtained from the transformed matrix entries. Denominator in RDMB compensates for the bias present in the transformed matrix entries. Users having high RDMB values are suspected as malicious users irrespective of the attack model.
Compromised Item Deviation Analysis (CIDA)
CIDA is used to identify the targeted item. It measures the item deviation from the users mean rating, within the scope of the top-n suspicious malicious users, given as
CIDA i — X u etopn(RDMBsus) ( rui - ru ) (5)
rui is the rating given to itemi by useru , r u is the average rating of the useru.
-
A. Framework for attack detection
Fig.2 describes the framework for detection and retrieval of injected profiles. The framework is called as “UnRIP”, Unsupervised Retrieval of Injected Profiles. The framework has three modules, namely suspicious user profiles identification, compromised item identification, and retrieval of injected profiles.
Identification of suspicious user profiles using RDMB
Module-1 in the UnRIP Framework involves calculating RDMB scores for all users in the database. The user profiles are sorted in descending order of RDMB values so that the attack profiles tend to cluster together in the upper part of the sorted list. Profiles having high RDMB values as specified in algorithm-1 are labeled as suspicious malicious profiles.
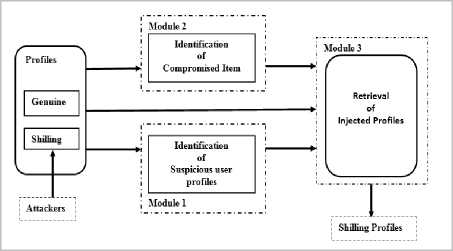
Fig.2. Unsupervised Retrieval of Injected Profiles
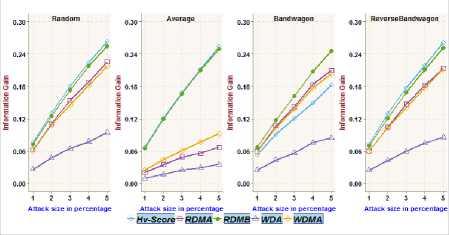
Fig.3. Information Gain achieved on MoviLens 100k dataset with different attack sizes over 2.5% filler size
Algorithm - 1 : Identification of suspicious User(s)
Input:
Ratingmatrix RmXT, sigma_threshold;
Output:
SuspiciousUsersRDMBsus;
-
1: Estimate global bias avg ^
2:Transform ratings as Au ,i — ru ,i — bu — avg ^
3:Estimate RDMB values for each user
-
4: Estimate mean XRDMB and standard deviation o r dmb of all users
-
5: Limit= XRDMB + ( sigma_threshold * aRDMB)
-
6: for each user u E U do
-
7: if RDMBu > Limit then RDMBsus ^ u ; endif
-
8: endfor
-
9: sort RDMBsus users in decreasing order of RDMB scores
-
10: returnRDMBsus;
Algorithm - 1 summarizes the process of finding suspicious malicious profiles in stage-1. The constant sigma_threshold is used to determine the abnormal deviation from average RDMB scores. Limit in Line-5is the threshold used to identify the user profiles which exhibit more than specified sigma_threshold from the overall mean of RDMB scores. Users below specified threshold are considered as normal users [1]. Line-7 identifies users having RDMB value greater than the Limit as suspicious users. sigma_threshold can be 0,1,2 or 3 to identify the suspicious user profiles . In the experimentation sigma_threshold is fixed at 1.
Identification of compromised Item using CIDA
Module-2 in the UnRIP framework involves identifying the target item. To identify the target item, the top-n users in the suspicious malicious users list having high RDMB scores are examined. CIDA values of all items are calculated, using top-n suspicious malicious profiles. The item(s) with the largest positive CIDA value in case of a pushed attack and smallest negative CIDA value in case of a nuke attack is identified as targeted item(s).
Algorithm - 2 : Identification of compromised Item(s)
Algorithm - 2 summarizes the process of finding compromised items in Module-2. Once the CIDA for every item rated by top-n users is calculated, the list is sorted and item with largest positive CIDA value is taken for push attack, item with smallest negative CIDA value is taken for nuke attack.
Retrieval of Injected Profiles
Module-3 in the UnRIP framework further eliminates the wrongly identified normal user profiles, from the list of suspicious malicious user profiles identified from Module-1, to complete the detection process of shilling profiles as specified in algorithm-3.
Algorithm - 3 : Identification of malicious User(s) through analysis of compromised Item(s)
Input:
RatingmatrixRmxn;
Suspicious UsersRDM5sus;
CompromisedItemC7D.<4com p with verdict;
Output:
USerSmalicious ;
-
1: USerSmalicious = null;
-
2: for each user и £ RDMBsus do
-
3: if и rated item icomp then
if push attack then if icomp rating >u average rating then add u to USerSmalicious ;
end if else if icomp rating
end if end if
-
4: end if
-
5: end for
-
6: returnUSerS malicious ;
Algorithm - 3 summarizes the process of identifying shilling profiles by further screening the suspicious users in RDMBsus with reference to the compromised item(s).The identified candidate profiles are further filtered by eliminating profiles that have not rated the target item or rated in reverse to the considered attack. Specifically, for a push attack, a user who has rated higher than the average rating while for a nuke attack, a user who has rated lower than the average rating is identified as malicious user.
-
IV. Experimental Evaluation
This section describes the experimental settings. Extensive experiments based on MovieLens datasets [6] and NetFlix1dataset are conducted. The effectiveness of the proposed metric RDMB, to identify attack profiles using different attack models in comparison with existing metrics [2, 4] is studied through Information Gain (IG).
In section 4.3 we investigate the ability of our frame to detect attack profiles in comparison with prominent unsupervised attack detection methods, PCA-VarSelect[11] and UnRAP[2].
-
A. Experimental datasets
To evaluate the proposed metrics and framework, the following four datasets are used to create experimental datasets.
-
i) MovieLens 100K dataset
This data set contains 100,000 ratings across 1682 movies given by 943 users. Each user in the dataset has rated at least 20 movies. All ratings are integer values between 1 and 5, where 1 indicates most disliked and 5 indicate most liked.
-
ii) MovieLens 1M dataset
This data set contains 1,000,209 ratings across 3952 movies given by6040 users. Each user in the dataset has rated at least 20 movies. All ratings are integer values between 1 and 5, where 1 indicates most disliked and 5 indicate most liked.
-
iii) MovieLens Latest dataset
This dataset contains 26024289 ratings across 45843 movies given by 270896 users. Each user in the dataset has rated at least 1 movie. Ratings are from 0.5 to 5 with an increment of 0.5, where 0.5 indicates most disliked and 5 indicate most liked. A random sample of 6, 57,985 ratings over 3260 movies given by 8969 users is used as the experimental dataset.
-
iv) NetFlix dataset
This dataset contains 103,297,638 ratings over 17,770 movies given by 480,189 users. All ratings are integer values between 1 and 5, where 1 indicates most disliked and 5 indicate most liked. A random sample of 4, 22,204 ratings over 4370movies given by 8000users is used as the experimental dataset.
The number of users rated an item is referred to as ‘density of rating’ for the item. Table.2 shows the division of items according to density of ratings into 5 groups. In the experimentation, a stratified random sample of 30 items, in total, ten from each of LD, MD, HD groups are considered as target items. Items having ratings less than 40 and ratings greater than 300 are not considered in the target selection. A target item in the experimental dataset has an average rating between 2 to 4, 3 to 5 for push and nuke attacks, respectively. For Bandwagon and Reverse bandwagon attacks the profiles include popular or unpopular items in the selected subset Is which is formed by randomly selecting among the items of VHD group, those with an average rating greater than 4 for Bandwagon attack and less than 3 for Reverse bandwagon attack.
1This dataset released as a part of competition to support participants in the NetFlix prize
Table 2. density of ratings
|
Very Low Density (VLD) |
<40 |
|
Low Density (LD) |
40-100 |
|
Medium Density (MD) |
101-200 |
|
High Density (HD) |
201-300 |
|
Very High Density (VHD) |
>300 |
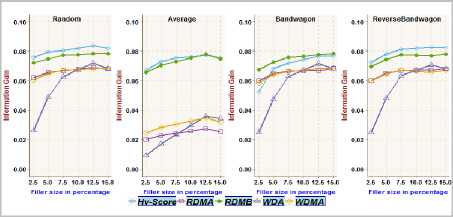
Fig.4. Information Gain achieved on MoviLens 100k dataset with different filler sizes over 1% attack size
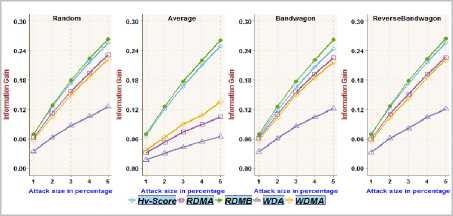
Fig.5. Information Gain achieved on MoviLens 1m dataset with different attack sizes over 2.5% filler size
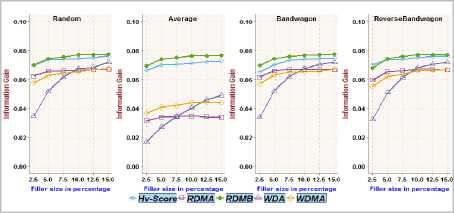
Fig.6. Information Gain achieved on MoviLens 1m dataset with different filler sizes over 1% attack size
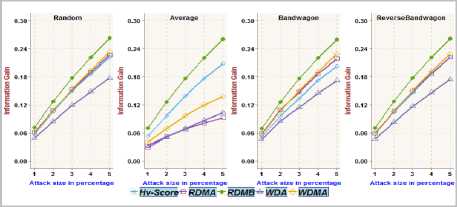
Fig.7. Information Gain achieved on MoviLens Latest dataset with different attack sizes over 2.5% filler size
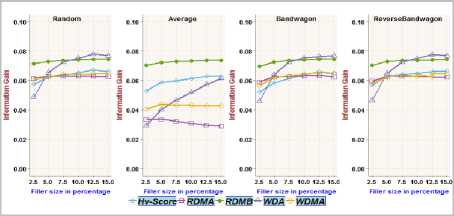
Fig.8. Information Gain achieved on MoviLens Latest dataset with different filler sizes over 1% attack size
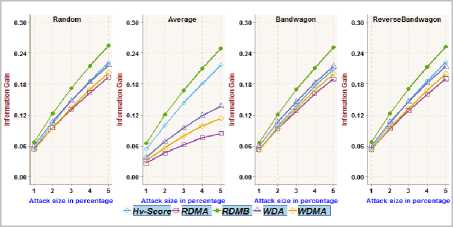
Fig.9. Information Gain achieved on NetFlix dataset with different attack sizes over 2.5% filler size
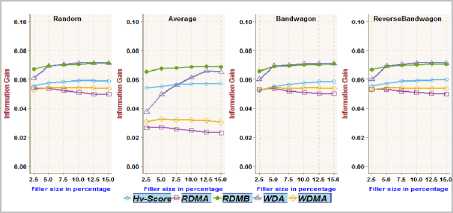
Fig.10. Information Gain achieved on MoviLens 1m dataset with different filler sizes over 1% attack size
Experimental dataset has two parts, namely authentic profiles and attack profiles. Attack profiles are generated in the experiments; assuming real attack profiles are not present in Movie Lens datasets and NetFlix dataset, the attack profiles are generated using 4 different attack models as discussed previously. For each attack model, attack profiles are created using different attack size2 {1%, 2%, 3%, 4%, 5%} and different filler size3 {2.5%, 5.0%, 7.5%, 10.0%, 12.5%, 15%}. The attack datasets thus created are combined with the corresponding authentic datasets to form the experimental datasets. Therefore, a total of 3600 (4 (attack models) ×5 (attack sizes) ×6 (filler sizes) × 30 (Target Movies))
experimental datasets are constructed with each dataset. The top-n is taken as 15 for MovieLens datasets, while top-n is taken as 30 for NetFlix dataset.
2Number of profiles inserted compared to total number of users in the recommender system
3Number of items rated by user compared to total available items in the recommender system
-
B. Evaluation of RDMB Metric
The functionality/adequacy of the attack detection metric employed in the framework to distinguish the attack profiles from normal user profiles is evaluated by using Information Gain metric [2, 4]. The information theoretic measure, Information Gain, quantifies the effectiveness of a metric in dividing a set of user profiles into normal verses attack groups. The proposed metric RDMB is compared with RDMA, WDMA, WDA and Hv -score metric towards recognizing random, average, bandwagon and reverse bandwagon attack. Fig.3, Fig.5, Fig.7 and Fig.9 show the Information Gain achieved with profiles having 2.5% filler size over different attack size through best split between attack profiles and normal profiles on different datasets. Fig.4, Fig.6, Fig.8 and Fig.10 show the Information Gain achieved with inclusion of 1% attack profiles for different filler sizes through best split between attack profiles and normal profiles on different datasets.
It may be observed that RDMB outperformed all other metrics. It can be noted from Fig.3through Fig.10, the performance of RDMA, WDMA, and WDA is not competitive in dealing with average attack. Fig.3 and Fig.4, reveals the Information Gain for Hv -score metric in identifying Bandwagon attack is comparatively less which indicates the limitation of Hv -score metric to identify Bandwagon attacks with low filler sizes.
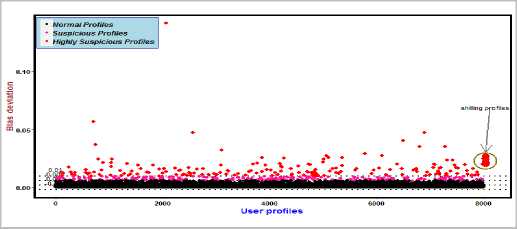
Fig.11. Average attack with 1% Injected Profiles over 2.5 filler size on NetFlix dataset
Evaluating the Frame work
The robustness of the attack detection framework lies in the ability to ascertain the differences between an attack profile and a normal profile.
-
i) Evaluation metrics
To evaluate the performance of our proposed framework, we use Precision and Recall which are defined as [4].
Precision
Recall =
#True Positives
#True Positives+#False Positives
#True Positives
#True Positives+#False Negatives
Where #True Positives represents the number shilling profiles correctly identified as attack profiles, #True Negatives represents the number of normal profiles correctly identified as normal user profiles. #False Negatives represents the number of shilling profiles identified as normal user profiles and #False Positives represents the number of normal profiles identified as shilling profiles.
-
ii) Detection using PCA-VarSelect
PCA-VarSelect[11] is an unsupervised variable selection procedure used to identify malicious users in the system as they have least covariance with other users. In the procedure, users are treated as variables, items are represented as observations and the covariance matrix is calculated after replacing ratings with z-scores [11]. Eigen decomposition is applied on covariance matrix to obtain principal components (PCs). Each PC contains a coefficient of every variable, i.e. every user. First m PCs are used for the selection of users. Users with smallest PC following coefficients are identified as malicious users. PCA-VarSelect performs well when the data is highly correlated, but it needs to know in advance the number of attack profiles (p) to detect. The parameter p, number of shilling profiles present in the system is hard to estimate, in the experiments, p is equal to the number of shilling profiles inserted.
-
iii) Detection using UnRAP
Unsupervised Retrieval of Attack Profiles (UnRAP) [2] algorithm ranks every user in the database using Hv-score metric. Profiles with larger values of Hv -score may be identified as malicious. The target item is identified using top-sp (10 is specified by the author for MovieLens 100k) profiles with largest Hv -score. The item which has maximum deviation from mean rating of the user becomes the target item. Next, Attack profiles are retrieved passing a sliding window of sp users along the Hv-score sorted user list by eliminating one user each time. The observed calculation in rating deviation for the target item over the sliding window can be obtained through the summation of rating deviation. This process is continued until it reaches a ceased point (stopping point) when summation of rating deviation reaches to zero. The user navigated up to the ceased point is considered as candidate attack profiles. The candidate profiles are further filtered to eliminate profiles which do not rate the target item following the attack strategy. The top-sp is taken as 15 for MovieLens 1m dataset; top-sp is taken as 30 for MovieLens Latest dataset, and while top-n is taken as 80 for NetFlix dataset for effective detection of shilling profiles.
Table 3. Time taken for retrieval of shilling profiles
|
Attack Size in % |
Average time taken in seconds for single experimental NetFlix dataset |
||
|
PCA |
UnRAP |
UnRIP |
|
|
1 |
582.57 |
14.35 |
12.12 |
|
2 |
586.69 |
17.42 |
12.34 |
|
3 |
592.09 |
20.30 |
12.48 |
|
4 |
598.57 |
22.93 |
12.58 |
|
5 |
604.18 |
24.75 |
12.91 |
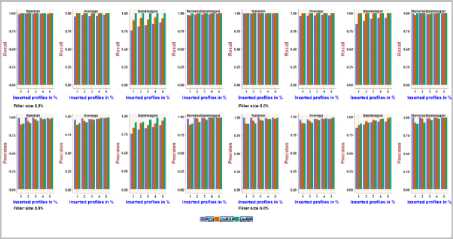
Fig.12. Precision and Recall obtained with MovieLens 100k dataset using 2.5% and 5.0% Filler size over different attack sizes
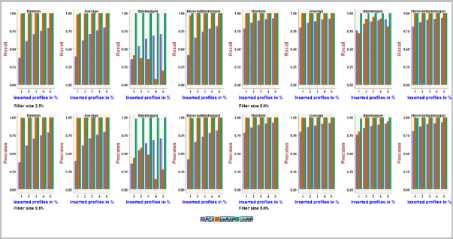
Fig.16. Precision and Recall obtained with MovieLens Latest dataset using 2.5% and 5.0% Filler size over different attack sizes
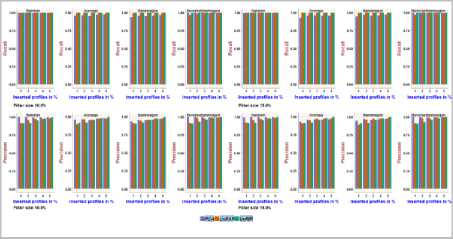
Fig.13. Precision and Recall obtained with MovieLens 100k dataset using 10.0% and 15.0% Filler size over different attack sizes
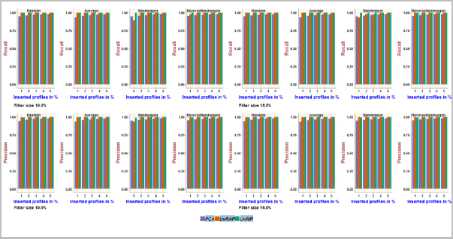
Fig.17. Precision and Recall obtained with MovieLens Latest dataset using 10.0% and 15.0% Filler size over different attack sizes
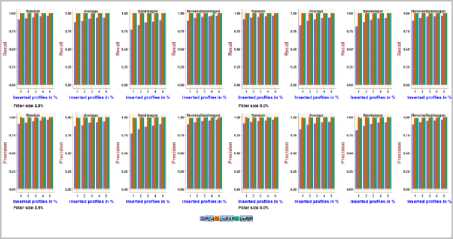
Fig.14. Precision and Recall obtained with MovieLens 1m dataset using
2.5% and 5.0% Filler size over different attack sizes
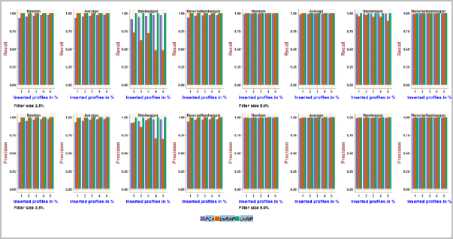
Fig.18. Precision and Recall obtained with NetFlix dataset using 2.5% and 5.0% Filler size over different attack sizes
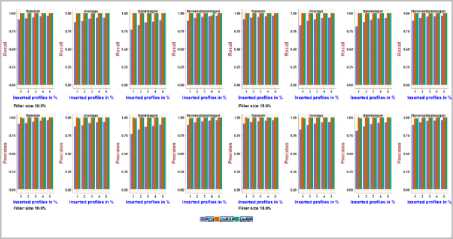
Fig.15. Precision and Recall obtained with MovieLens 1m dataset using
10.0% and 15.0% Filler size over different attack sizes
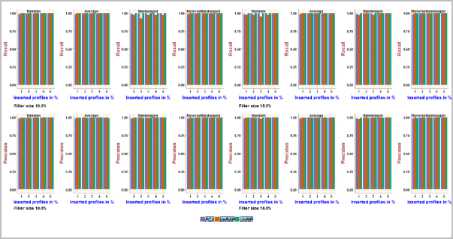
Fig.19. Precision and Recall obtained with NetFlix dataset using 10.0% and 15.0% Filler size over different attack sizes
-
V. Result Analysis
It can be seen from Fig.11, suspicious profiles are represented with red color, and normal profiles are represented in black color. RDMB is successful in identifying attack profiles present in the dataset and the shilling profiles are clustered together in suspicious zone.
It can be noted from Fig.12, Fig.13, on the MovieLens 100k dataset with four attack models, the precision and recall achieved using PCA-VarSelect is between 0.76and 1.0, the precision and recall achieved using UnRAP is between 0.84and1.0, 0.9 and 1.0, respectively. The precision achieved using UnRIP is between 0.81and1.0 and the recall is 1.0.It can be inferred from the above that UnRIP has outperformed both PCA-VarSelect and UnRAP.
It is revealed from Fig.14, Fig.15, on the MovieLens 1m dataset, the precision and recall achieved using PCA-VarSelect with four attack models is between 0.77 to 0.96, the precision and recall achieved using UnRAP is between 0.99 and 1.0, 0.97and 1.0, respectively. The precision achieved using UnRIP is between 0.98 and 1.0, and the recall is 1.0. It can be inferred from the above that UnRIP has outperformed both PCA-VarSelect and UnRAP.
It can be verified from Fig.16, Fig.17, on the MovieLens Latest dataset, the precision and recall achieved using PCA-VarSelect with four attack models is between 0.36 to 0.98, the precision and recall achieved using UnRAP is between 0.0 to 1.0, the precision and recall achieved using UnRIP is at its maximum i.e., 1.0. it can be inferred from the above, UnRIP has outperformed both PCA-VarSelect and UnRAP.
It can be noted from Fig.18, Fig.19, on the NetFlix dataset, the precision and recall achieved using PCA-VarSelect with four attack models is between 0.36and 0.98, the precision and recall achieved using UnRAP is between 0.14and1.0,0.08 and1.0, respectively. For the UnRIP, the precision is between 0.99 and 1.0, the recall is at its maximum i.e., 1.0. It can be inferred that, UnRIP has outperformed both PCA-VarsSelect and UnRAP.
Precision and recall are same with PCA-VarSelect when the number of malicious profiles to detect is equal to injected profiles . PCA-VarSelect performance is at its low with lower filler size for smaller datasets. Traditional PCA suffers from high latency which can be verified from Table.3 Latest strategies like performing thin SVD to select 3-5 dimensions which gives a good approximation similar to performing complete PCA [11].
UnRAP algorithm fails to identify the target with bandwagon and reverse bandwagon attack. H — score metric does not perform well with Bandwagon attack which leads to inconsistency in identifying the target item. The metric fails to cluster the shilling profiles to the top of the list for large datasets. It is clear from Table.3, time taken to retrieve attack profiles increases with increase in window size for larger datasets using UnRAP algorithm.
The proposed framework (UnRIP) has 100% detection capability and is consistent with all attack models. RDMB metric successfully cluster attack profiles to the top of the sorted list of RDMB scores. CIDA successfully identify the targeted item using top-n list of users obtained from RDMB scores. It can be verified from Table.3, the proposed framework is fast and consistent in identifying and separating malicious profiles from the normal profiles.
All the experiments are done with Intel core i7-2.60 GHz processor with 8.00 GB RAM. The experimentation is carried using R programming [13].
-
VI. Conclusion
A recommender system can be misled, to provide biased predictions by inserting shilling profiles with fabricated identities. In this paper, two novel metrics are proposed for distinguishing the shilling profiles from normal profiles in collaborative filtering recommender systems. RDMB has clearly outperformed other prominent metrics available in the literature in terms of Information Gain. RDMB successfully cluster the shills to differentiate from normal users. RDMB is consistent in segregating the attack profiles injected through any of the attack strategies. The proposed framework using the metrics RDMB, CIDA has identified the shilling profiles with high accuracy under different attack models and the frame work is fast in identifying the malicious profiles and hence also scalable. The effectiveness of RDMB metric improves with increase in dataset size which is reflected by higher values of Information Gain.
References New metrics for effective detection of shilling attacks in recommender systems
- Bhaumik R, Williams CA, Mobasher B, Burke RD, 2006. Securing collaborative filtering against malicious attacks through anomaly detection. In Proceedings of the 4th workshop on intelligent techniques for web personalization, Boston, MA
- Bryan K, O’Mahony MP, Cunningham P, 2008. Unsupervised retrieval of attack profiles in collaborative recommender systems. In Proceedings of the 2nd ACM international conference on recommender systems, Lausanne, Switzerland, pp 155–162
- Burke RD, Mobasher B, Bhaumik R, 2005. Limited knowledge shilling attacks in collaborative filtering systems. In Proceedings of workshop on intelligent techniques for web personalization, Edinburgh, UK
- Burke RD, MobasherB,Williams CA, Bhaumik R ,2006. Classification features for attack detection in collaborative recommender systems. In Proceedings of the 12th ACM SIGKDD international conference on knowledge discovery and data mining, Philadelphia, PA, USA, pp 542–547
- Chirita PA, NejdlW, Zamfir C, 2005. Preventing shilling attacks in online recommender systems. In Proceedings of the 7th annual ACM international workshop on web information and data management, Bremen, Germany, pp 67–74
- Harper, F.M. and Konstan, J.A., 2016. The movielens datasets: History and context. ACM Transactions on Interactive Intelligent Systems (TiiS), 5(4), p.19.
- IhsanGunes, CihanKaleli, Alper Bilge, and HuseyinPolat. 2014. Shilling attacks against recommender systems: a comprehensive survey. Artif. Intell. Rev. 42, 4 ,767-799. DOI: http://dx.doi.org/10.1007/s10462-012-9364-9
- Jannach, D., Zanker, M., Felfernig, A. and Friedrich, G., 2010. Recommender systems: an introduction. Cambridge University Press.
- Koren, Y. and Bell, R., 2015. Advances in collaborative filtering. In Recommender systems handbook (pp. 77-118). Springer US.
- Lam SK, RiedlJT, 2004. Shilling recommender systems for fun and profit. In Proceedings of the 13th international conference on world wide web, New York, NY, USA, pp 393–402
- Mehta B, NejdlW, 2009. Unsupervised strategies for shilling detection and robust collaborative filtering. User Model User Adapt Interact 19(1-2):65–97
- Mobasher B, Burke RD, Bhaumik R, Williams CA, 2007. Towards trustworthy recommender systems: an analysis of attack models and algorithm robustness. ACM Trans Internet Technol 7(4):23–60
- R Core Team, 2015. R: A language and environment for statistical computing. R Foundation for Statistical Computing, Vienna, Austria. URL http://www.R-project.org/.
- Resnick, P., Iacovou, N., Suchak, M., Bergstrom, P. and Riedl, J., 1994. GroupLens: an open architecture for collaborative filtering of netnews. In Proceedings of the 1994 ACM conference on Computer supported cooperative work (pp. 175-186).
- Shardanand, U. and Maes, P., 1995. Social information filtering: algorithms for automating “word of mouth”. In Proceedings of the SIGCHI conference on Human factors in computing systems (pp. 210-217). ACM Press/Addison-Wesley Publishing Co.
- Srikanth, T. and Shashi, M., 2019 An effective preprocessing algorithm for model building incollaborative filtering-based recommender system, Int. J. Business Intelligence and Data Mining, Vol. 14, No. 4, pp.489–503.
- Tong, C., Yin, X., Li, J., Zhu, T., Lv, R., Sun, L. and Rodrigues, J.J., 2018. A shilling attack detector based on convolutional neural network for collaborative recommender system in social aware network. The Computer Journal.
- Zhang, F., 2009. Average shilling attack against trust-based recommender systems. In Information Management, Innovation Management and Industrial Engineering, 2009 International Conference on (Vol. 4, pp. 588-591). IEEE.
- Zhou, W., Wen, J., Koh, Y.S., Alam, S. and Dobbie, G., 2014. Attack detection in recommender systems based on target item analysis. In Neural Networks (IJCNN), 2014 International Joint Conference on (pp. 332-339). IEEE.
