NMR imaging application for study of the polymethylmethacrylate colloidal crystals infiltration in the inverse opals preparation technology

Author: Morozov Evgeny V., Shabanova Olga V., Falaleev Oleg V.
Journal: Журнал Сибирского федерального университета. Серия: Техника и технологии @technologies-sfu
Article in issue: 3 т.5, 2012.
Free access
NMR Imaging results of polymethylmethacrylate colloidal crystals infiltration are presented. For infiltration study the colloidal silica and fluids with different relation of surface tension and viscosity were utilized. Wetting front has a trend to be steady while propagated into bulk sample as revealed by means of NMR Imaging. As regards of powder sample, the wetting front instability was observed. Both the wetting front dynamic and structural properties of samples namely porous media permeability, fractal dimension of porous space and tortuosity were successfully measured. NMR Imaging techniques was demonstrated to be suitable for noninvasive study of infiltration processes occurred in the course of inverse opals preparation.
Nmr imaging, inverse opals, pmma colloidal crystals, infiltration, wetting front instability
Short address: https://sciup.org/146114648
IDR: 146114648 | UDC: 537.9:543.429.23
Применение ЯМР-томографии для исследования пропитки коллоидных кристаллов полиметилметакрилата в процессе получения инверсных опалов
В работе представлены результаты ЯМР томографического исследования пропитки коллоидных кристаллов полиметилметакрилата золем SiO2 и жидкостями с различными значениями поверхностного натяжения и динамической вязкости. С помощью данного метода выявлен устойчивый характер фронта пропитывания в крупнокристаллических образцах, измерена его динамика и рассчитана из экспериментальных данных проницаемость пористой среды. Обнаружена неустойчивость фронта при пропитывании порошкообразных образцов, рассчитана фрактальная размерность и извилистость порового пространства. Продемонстрирован высокий потенциал метода для неразрушающего контроля процессов пропитки ПММА при получении инверсных опалов.
Text of the scientific article NMR imaging application for study of the polymethylmethacrylate colloidal crystals infiltration in the inverse opals preparation technology
Last two decades can be marked by vigorous investigation of new challenging nanomaterials – inverse opals. Investigations involved development, synthesis and properties characterization of these materials [1-3]. The inverse opal is well known to be a three-dimensional highly ordered structure consisted of spherical voids surrounded by solid walls. Due to the dielectric constant difference between void space and solid walls medium the inverse opals structure can be regarded as a photonic crystal [4]. Photonic crystals are interesting for both fundamental and applied points of view. There are optical filters, wave guides, different types of sensors, antireflecting coating etc. which were developed on the base of photonic crystals (for instance, [5]).
There are some methods to fabricate inverse opals but the most convenient is template approach [3, 6]. This approach involves the crystallization of a colloidal dispersion of monodisperse spheres (the most widely used is polymethylmethacrylate (PMMA)) to form a material with a threedimensional periodic structure in which 24% of the volume is air (a colloidal crystal or opal). Inverse opal structures can readily be fabricated from colloidal crystal (opal) templates, by filling the voids in the opal with a dielectric material, and then removing the original opal template by calcination (thermal treating at t > 500 ºC). In this sequential process the stage of PMMA colloidal crystals infiltration by sol-gel precursor (colloidal SiO 2 ) is the most important. The size of samples, their structure, both cracks and heterogeneities formation is strongly influenced by features of preparation technology. Thus the study and nondestructive monitoring of colloidal crystals infiltration seems to be an urgent problem.
Among the experimental approaches to study transport to porous media there are some advantageous methods based on NMR phenomenon and particularly the NMR Imaging [7]. Nuclear Magnetic Resonance Imaging (NMR Imaging or MRI) is well known noninvasive and sufficiently informative technique first of all in medicine. Apart from medical and biomedical application NMR Imaging nowadays actively becomes integrated into chemical engineering and materials science [8]. So, the polymerization processes, cementation, chemical waves propagation, catalysts materials etc. were successfully studied by MRI [9-11]. Some NMR Imaging works were devoted to study of wetting front propagation into soil (natural porous media) [12-13]. At present there is no any information concerned about MRI application for study the PMMA colloidal crystals infiltration during the inverse opals preparation. The detailed visualization of wetting front structure and dynamic as well as liquid phase distribution inside of colloidal crystal seems to be successfully addressed to NMR Imaging.
Experimental part
NMR imaging techniques
The principles of NMR Imaging method are well described in literature [14]. It is necessary to make mention only on specific techniques employed in the experiments. For image acquisition the spin echo based technique (Multi Slice Multi Echo [15]) was made use of. Basic timing diagram of spin echo pulse sequence is presented in Fig.1. In such type of techniques two RF pulses are applied: 90º (excited) and 180º (generated spin echo signal). In comparison with other imaging techniques the spin echo one possessed by some substantial advantages, first of all this technique allows us to acquire T 1 , T2 and proton density weighted images.
The described spin echo pulse sequence is defined by set of parameters: ТE (Time Echo) – time interval between 90º pulse and echo signal; TR (Time Repetition) – time interval between every applied pulse train (from first exciting 90º pulse to second one). A pulse sequence is repeated defined number of times. The signal intensity I after 180º pulse can be expressed as follows [14]:
I = M 0
1 - exp
TE -
T 1
TR
I - TE 1 expl------- I
,
V T 2 J
where T1 – spin-lattice (longitudinal) relaxation time, T2 – spin-spin (transverse) relaxation time, M0 initial magnetization (depended from proton density in object under study).
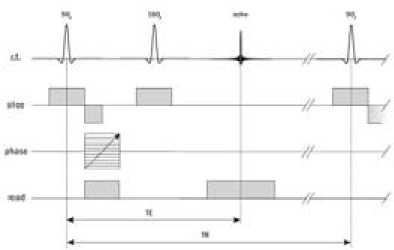
Fig.1. Timing diagrams of pulse sequences for the spin echo (left) and pulsed gradient spin echo (right) techniques
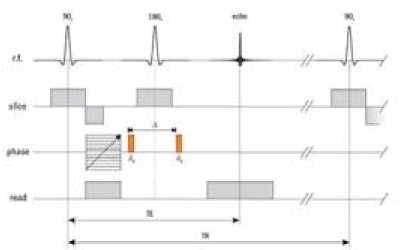
For self-diffusion measurements the pulsed gradient spin echo technique was employed [15] (Fig. 1). In this case a pulsed gradient is introduced into a spin echo sequence. The signal intensity I can be expressed as follows [14]:
( 1 1
I = M 0 exp ( - bD ) , with b = -y 2 GS 21 A - ^ |,
I 3 )
where G is the diffusion gradient strength, δ is the duration of the diffusion gradient, Δ is the time between the gradient pulses, γ is the gyromagnetic ratio, and D is the self-diffusion coefficient for a given substance. Thereby the diffusion experiment allows the self-diffusion coefficient D to be extracted from dependence of –ln I vs. b .
All imaging experiment were carried out using NMR microimaging installation based on Bruker AVANCE DPX 200 with 4.7 T magnetic field, probe PH MICRO 2.5 (radio frequency coil diameter 25 mm), at 25 ºС.
Samples preparation
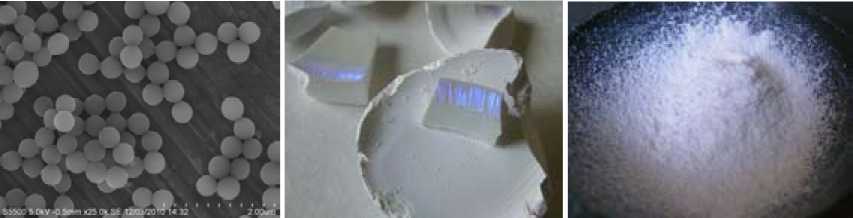
Some aspects of the sample preparation are illustrated in Fig.2. Monodisperse PMMA spheres with diameter 300 nm (Fig.2a) were prepared by the method of Schroden et al. [6, 16]. PMMA colloidal suspensions were left in open glass ampoules (~20 mm) with hemispherical bottom at 25 ºC. After 2–3 weeks, water in the colloidal suspensions evaporated to leave well-ordered PMMA photonic crystals of the round shape. Then the colloidal crystals were left to dry in air at 25 ºC for a further 1–2 weeks. After drying the large-sized pieces (about 7x7x10 mm) were cut out and taken for the first experiment (bulk sample, Fig.2b). Residual part of colloidal crystals was slightly crushed (according to technology practice) to obtain a powder for second experiment (powder sample, Fig.2c). Bulk sample was then placed into a glass tube with the infiltrating liquid. Noncompacted powder sample was filled up to glass pipe with open ends in order to provide air free yield. The glass pipe with powder sample was then mounted into MRI probe and infiltration occurred top-down.
The colloidal SiO 2 obtained by alkali silicates acidic leaching and set of liquids possessed by different values of both surface tension and viscosity (Table 1) were utilized for infiltration experiment.
Table 1. Parameters of surface tension σ and viscosity μ for different types of liquid media utilized for PMMA colloidal crystal infiltration.
|
H 2 O |
Glycerol |
Isobutyl alcohol |
Ethanol |
Hexane |
|
|
σ (N/m) |
0.073 |
0.065 |
0.023 |
0.023 |
0.018 |
|
μ, 10-4 (Pa∙c) |
8.9 |
9450 |
39.5 |
10.96 |
2.94 |
a
b
c
Fig.2. Electron microphotography of PMMA colloidal spheres deposited on aluminum substrate (a) and bulk sample (b), powder sample (c) photos
For PMMA colloidal crystal infiltration by SiO2 sol the dwell time τd has a decisive importance. Dwell time is defined by period between of SiO 2 sol preparation and the infiltration of sample being started. It is concerned with intensive sol-gel transfer processes occurred in the colloidal silica (particularly at the very first time after preparing) to result in spatial gel structures growth accompanied by substantial viscosity increasing.
Results and discussion
Bulk sample infiltration
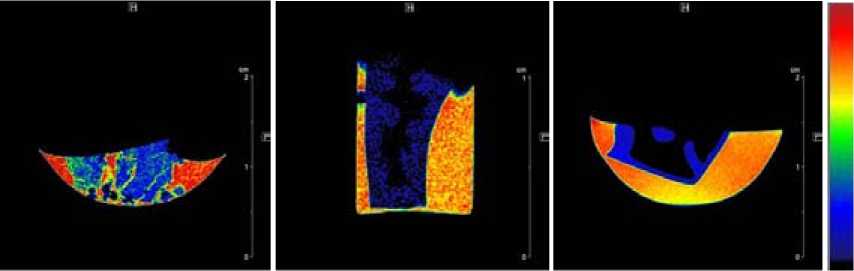
Because the colloidal silica is commonly used for inverse opals preparation, that is the SiO2 precursor which was chosen for PMMA colloidal crystals infiltration. Besides of colloidal SiO 2 the liquid media listed in Table 1 and liquid glass as well were utilized additionally for infiltration experiments. It enables to reveal the more suitable media for comparative study of wetting front propagation dynamic. So, the preliminary results have shown that the glycerol is the most convenient liquid (large value of viscosity is provided), due to the optimal infiltration time accompanied with sample structural integrity retention; hexane is imbibed too fast to be detected by imaging technique, and sample infiltration by ethanol (as well as by water) leads to violent cracks formation with subsequent sample fracturing (as can be seen in Fig.3a).
The most informative results were obtained in case of glycerol infiltration. In particular, the internal defects in form of microcracks were also successfully revealed in different samples by means of MRI. These microcracks lead to wetting front distortion in appropriated parts of sample as it is shown in Fig.3b,c. As soon as the liquid media appears inside of microcrack it becomes a secondary source of wetting front propagation.
abc
Fig.3. Images of PMMA bulk samples transverse slice in the course of infiltration by water (a) and glycerol (b, c). Image parameters: TR/TE 160 (a), 68 (b), 48 (c); slice thickness 0.5 mm (a, c) and 0.4 mm (b)
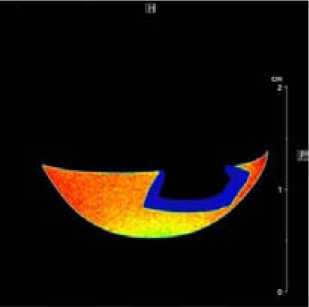
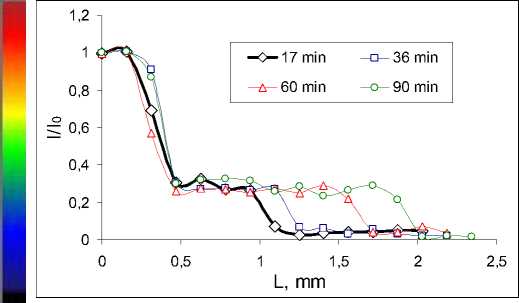
Fig.4. Image of sample transverse slice in the course of glycerol infiltration (left), cross section time-spaced profiles (right). Image parameters: TR/TE 48; slice thickness 0.5 mm
If there is no any internal microcrack-scale defect, the wetting front has a trend to be steady over the time of whole process occurred. For a high quality sample the NMR image of sample transverse slice in process of glycerol infiltration is presented in Fig.4. For this process the cross section timespaced profiles ( I/I 0 vs. L ) were plotted. The intensity I 0 corresponds to NMR signal from 1H located outside of porous media while I being variable correspond to signal intensity inside of sample ( L corresponds to wetting front lengths). It is worth noticing that the normalized signal intensity I/I 0 inside of sample is substantially less as compared with those corresponded to external part. It is caused by (firstly) absolute proton density decreasing (1) while wetting front having moved from interface into deep of sample and (secondly) surface relaxation effects. The wetting front interface keeps being sharp with wetted part intensity having the same value over the all time of process.
Fresh prepared SiO2 sol in the most cases of infiltration give rise to bulk PMMA sample fracturing and there is no fracturing when utilized SiO 2 sol with τ d more than20 min. For this reason the SiO 2 sols set with equal concentration but different dwell times 20 min, 90 min, 180 min were used for study. In all cases if the sample did not have a crack the wetting front was a steady. The NMR image of sample
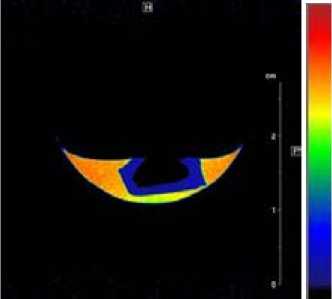
Fig.5. Image of sample transverse slice in the course of SiO 2 sol (τ d 180 min) infiltration (left), cross section timespaced profiles (right). Image parameters: TR/TE 48; slice thickness 0.5 mm
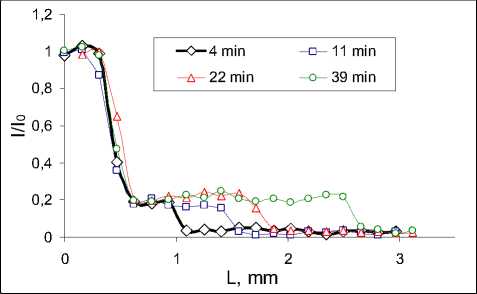
transverse slice in process of SiO2 sol infiltration with τd 180 min is presented in Fig.5; the cross section time-spaced profiles also were plotted. The sharp form of wetting front interface can be found out in the all NMR images, making it possible to measure the dynamic of front propagation.
Infiltration is modeled using a variety of methods, depending on scale and scope of the problem [17]. Among of them the Green and Ampt approach accounts for a number of variables and is widely used for different applications. This approach was to recognize that infiltration is driven by capillary and gravitational forces but hindered by fluid viscosity. It is assumed:
-
- the hydraulic gradient to be linearly distributed between sample surface and position of the wetting front,
-
- the medium behind the wetting front to be fully saturated,
-
- the medium ahead of the wetting front to be at its initial water content.
Based on this approach Kao and Hunt presented a model for wetting front propagation in porous media [18]. Horizontal wetting front lengths were predicted to propagate as the square root of time as:
-
1 2 1 1
L = B\- I k 4 1 2, (3)
I A )
where L – distance from the source to the wetting front, σ – fluid-air interfacial tension, μ – fluid viscosity, k – porous media permeability, B – a dimensionless geometric factor determined to be 0.5. In Fig.6 the wetting front lengths L vs. square root of time t1/2 are presented for some fluids which were used. For colloidal silica the data presented for different dwell times. In terms of data from Table 1 and Fig.6 the bulk PMMA colloidal crystal permeability was calculated according to (3) to be k = 0.3-1.7 mD (~10-15 m2). In conclusion the porous media described can be referred to as weakly permeable (corresponded to a range of 1-10 mD).
Powder sample infiltration
For infiltration in powder sample only glycerol and colloidal silica were utilized. The NMR images of sample longitudinal slice in process of infiltration are presented in Fig.7 (images are pointed out for
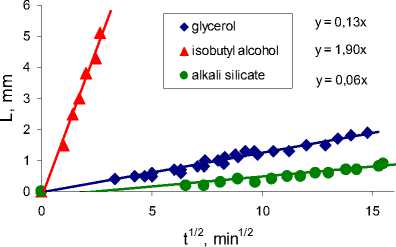
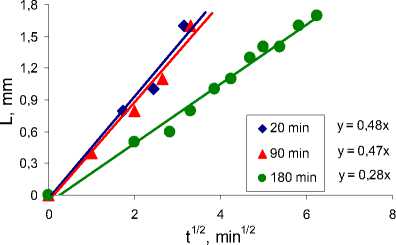
Fig.6. Time dependence of wetting front length for different fluid (left) and colloidal silica with different dwell times (right)
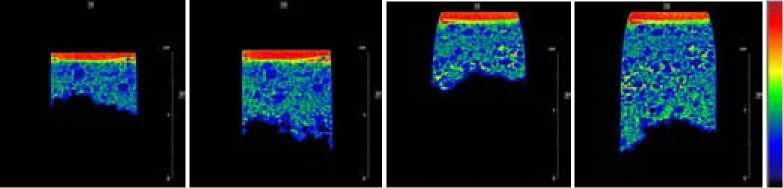
a b cd
Fig.7. Images of sample longitudinal slice in the course of glycerol infiltration, 15 min (a), 35 min (b) and SiO 2 sol (τ d 180 min), 5 min (c), 10 min (d). Image parameters: TR/TE 24 (a, b), 48 (c, d); slice thickness 0.6 mm (a, b), 0.5 mm (c, d)
different time after infiltration being started). The inhomogeneous pattern of powder can be observed: there are areas in the image with relatively large-scale size grains as well as with small ones. The first mentioned corresponds to low signal intensity while the second one corresponds to high signal intensity. The topmost part in the images corresponds to fluid-powder interface. The same nature of infiltration was observed when used both glycerol (Fig.7a,b) and colloidal silica (Fig.7c,d). Since the SiO2 sols with dwell time τd < 2 h practically does not differ on their properties, it was decided to use 2d sols with τd 1 h, 3 h and 5 h. It was not found out the alteration of infiltration law against of dwell time, but as τd increased the rate of wetting front displacement appropriately decreased.
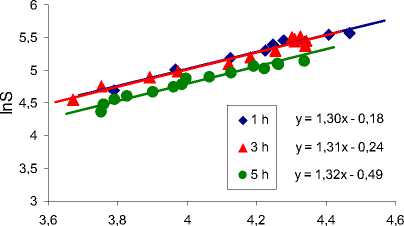
By means of NMR Imaging the wetting front instability was clearly visualized in process of PMMA powder infiltration. It is well-known to be a “fingering” (like the “viscous finger formation” in Hele-Shaw cell), which usually having been observed when studied of transport to porous media [19]. It does not allow the Green and Ampt approach to be applied for wetting front propagation dynamic. However the fact of wetting front instability could testify to fractal nature of porous space. The area S of figure is known correlate to its own perimeter L as follows [20]:
S ∝Ld , where d is a topological dimension (to be 2 for two-dimensional space). For fractals d would be a fractional number and always will vary from 2. In Fig.8 the dependencies of lnS vs. lnL are presented – 281 –
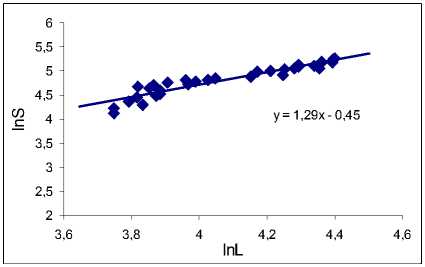
Fig.8. Dependencies of ln S vs. ln L for samples infiltrated by glycerol (left) and colloidal silica with different τ d (right)
lnL
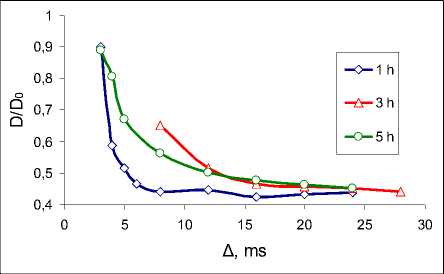
Fig.9. Dependencies of D/D 0 vs. Δ for experiments with different SiO 2 sol dwell times
(in this case L corresponds to contour length of wetted part in image). One can see that parameter d ~ 1.3 and it does not depend on fluid utilized, being a property of powder itself.
Pore space of powder sample can also be characterized to measure of water self-diffusion coefficient behavior after infiltration having been finished. The self-diffusion coefficient D in common case is known depends on Δ i.e. D=f( Δ ). It was determined that [7]:
D ( a ) _ 1 _ 4 S
7 D 0 A + O ( D o A )
D о " "9 V where D0 is a water self-diffusion coefficient outside of porous media (D0 = 2.1∙10-3 mm2/s for pure water), S is a surface area of porous space, V is a total pores volume. At ∆→∞ (4) can be written:
Hm
A^x
D (A)
D 0
T ,
where T is tortuosity of porous space. Thus the asymptotic behavior of D/D0 vs. Δ allows T to be evaluated from (5). Self-diffusion coefficients measuring were carried out as soon as powder sample infiltration by SiO2 sol was finished. In Fig.9 these dependencies are presented for different dwell times. In result the dependencies proved to be asymptotic and they does not be affected to dwell time, – 282 – being also a property of powder itself. For PMMA powder sample the tortuosity T was found out to be 2.27.
Conclusions
In this work the NMR Imaging method was successfully applied to study PMMA colloidal crystal infiltration in process of inverse opals preparation. Some facilities of this technique were tested for noninvasive visualization of liquid phase interaction with porous media. Wetting front propagation dynamic, wetting front instability, structural properties of samples were studied. So, bulk sample permeability was measured to be 0.3-1.7 mD, for powder sample both the fractal dimension and tortuosity were measured to be 1.3 and 2.27 appropriately. Such information can assists to adjust some technological parameters for colloidal crystals infiltration. MRI as a tool proved to be helpful for monitoring of essential stage of inverse opals preparation. It is worth noticing that the NMR Imaging possibility in this field of research now is hardly exhausted and further activity is looking forward.
