Noiseimmunity of the search for broadband frequency manipulation signals with minimal shift of the radio navigation system under the influence of structural interference

Author: Musonov V.M., Romanov A.P.
Journal: Siberian Aerospace Journal @vestnik-sibsau-en
Section: Informatics, computer technology and management
Article in issue: 4 vol.23, 2022.
Free access
In the presented work, an assessment of the noise immunity of the parallel algorithm of the broadband signals with frequency manipulation with minimal shift time search is given. The threshold value of the Signal-to-Noise ratio per one L signal is used as a criterion, which ensures the required accuracy of code synchronization with a given error probability. In this case, the task of temporary search is formed as a task of L signals recognition which modulating code sequences { } kl d differ by a time cyclic shift τk (k 1) τэ (k 1,L,L the length of the modulating code sequence, э the duration of the signal element or the element of the modulating code sequence) equal to energy. The L -dimensional probability density of the modules 1,..., LVV ( i V the correlation module of the analyzed and comparison signals at the output of the quadrature correlator) is preliminarily determined. The probability of error is determined by L -multiple integration of the L -dimensional probability density of modules 1,..., L VV. The problem of determining the energy losses in the analyzed signal under the influence of structural interference is solved. In this case, a quadrature recognition circuit of one of two discrete signals is used and the Signal-to- Noise ratio at the output of the recognition circuit is determined, taking into account the effect of structural interference, and a comparison is made with the Signal-to-Noise ratio for the analyzed signal acting at the input of the quadrature recognition circuit. An assessment of the structural interference impact on the temporary search is given, taking into account the normalized periodic autocorrelation function (NPACF) of the analyzed signal and structural interference (at L 16383). It is shown that it is most rational to work with NPACF in its ascending section (cycle interval [ 361τ , 540τ э э]), while the reciprocal correlation coefficient will not exceed 4 · 10–3 and the equivalent energy losses of the analyzed signal will not exceed 3 dB. At an intensity of 34 dB of structural interference, the use of an ascending section of the NPACF allows minimizing the energy losses of the analyzed signal and temporary searching for a time of 0.35 s (at τэ = 2.5 microseconds).
Interference intensity, Signal-to-Noise ratio, noise immunity of the search system, correlation coefficients
Short address: https://sciup.org/148329656
IDR: 148329656 | UDC: 517.977.5-629.783 | DOI: 10.31772/2712-8970-2022-23-4-615-632
Text of the scientific article Noiseimmunity of the search for broadband frequency manipulation signals with minimal shift of the radio navigation system under the influence of structural interference
In radio navigation systems (RNS) with broadband signals (BBS), mutual and structural interference is possible, which represent BBS of the same type as those used in broadband RNS -signals emitted by support stations (SS) [1]. Signal reception by the onboard station (BS) of the RNS can be carried out under the influence of interference in the form of interfering signals: surface wave signals of other SS and sky wave signals of those SS that are at least 100 km away from the BS taking into account operating frequencies. For RNS "Sprut" with an operating frequency of 2 MHz at distances up to 1000 km, the effect of a sky wave can be neglected [2], then for the Sprut RNS with three reference stations, the number of interfering signals relative to BS reception will not exceed two.
When used as modulating pseudo-random sequences, cyclic shifts of the code common to all support stations, the shown interfering signals can be considered as interference in the form of useful signal copies, cyclically shifted in time. When at the point of BS reception the powers of the emitted SS signals are approximately equal, then such interfering signals can be attributed to mutual interference making analysis of the required signal possible on the basis of conventional code separation [3]. In the case when the Ps power of the analyzed signal is significantly lower than Pn of the interfering signal ( K D 20-30 dA , K = 10 Lg ( P n / P s ) - interference intensity), the SS of the interfering signal is located much closer to the BS than the SS of the analyzed signal), then the interfering signal is a structural noise (SN). The impact of powerful structural interference in the form of broadband FM signals on the analyzed FM signal was studied in detail in [4].
In the RNS Sprut under consideration, support stations are located at the vertices of an equilateral triangle with a side of 300–400 km. Each SS emits a BBS with frequency shift keying at a minimum shift (MSK) [5], in which the modulating code is a cyclically shifted by elements of the original β-code sequence. When signals propagate between SS over the sea surface at a distance of up to 350 km, the signal is suppressed by 34 dB [2]. Hence, the power of the signal emitted by the nearest SS for the BS will exceed the power of the signal emitted from the most distant SS for the same BS by 34 dB. In this case, the signal with the highest power, which differs from the power of the useful signal by the magnitude of the interference intensity, will be a structural interference. The impact of structural interference in the search for a broadband signal with MSK is not available in the literature today, which became a driving factor for analyzing the impact of structural interference on the search for BBS - MSK signals from terrestrial RNS reference stations, which helped to significantly reduce the effect of structural interference on the "search" of broadband signals with MSK.
Noise immunity of BBS-MSK parallel search
Let us execute the parallel search algorithm [6] in the form of the optimal procedure for detecting and recognizing one of the L signals that differ in time cyclic shift т k = ( k - 1)т э ( k = 1, L, L - the length of the modulating code sequence, т э - duration of the signal element or the element of the modulating code sequence { d kl }) [7]. To assess the noise immunity, we use as a criterion - probability of correctly determining the quadrature correlator (QC) number, at the output of which the calculated correlation modulus Vk of the analyzed and comparison signals will be the largest among the L - 1values. Hence, the probability of correct signal recognition will be valid if of all the V 1 , V2,..., VL - 1 values of the modules, Vk is the largest. Therefore, the probability Р пр of correct signal recognition is the probability that if Vk = V max, then all other L - 1values ( V 1 , V 2,..., VL , except Vk ) are less than V max , i.e. the probability Pпр corresponds to the value of the Vk modulus distribution function on the [0, + ^] interval with the V k modulus distribution density f (Vk ):
Ж
Р пр = P(V k = V max ) = £ f (V k ) dV k . (1)
The distribution density f ( Vk )of the correlation module Vk can be expressed in terms of the multiple integration L - 1of the L -dimensional probability density of the modules V 1 ,..., VL - W ( V ) [8]:
VkVk f (Vk) = f... f W (V) dV1... dVi... dV . (2) 0 0 l * k
Under the influence of fluctuation noise, together with the signal at the Linputs of quadrature correlators, the values V1,V2,...,VL will be functions of orthogonal signals. We can say that each of the modules will be an independent random variable and then the distribution W (V) can be expressed through the product of distributions of independent random variables (modules)V1,...,VL . Taking into account the behavior of the main spike in the module of the normalized periodic autocorrelation function (NPAKF) [5] of a broadband signal at MSK
R (т) =
1--
2 т з 7
Г cos —т + -Sin —|т| , |т|<2т 2τ π 2τ
э
к
3 7
к
э
0, |т| > 2т 3 .
L - dimensional probability density W ( V ) can be expressed in terms of the product:
– one-dimensional density W 1( Vk )at the output of the synchronous quadrature correlator (where the reference signal corresponds in shape to the analyzed signal) according to the Rayleigh-Rice law with 2
the square of the mathematical expectation M (Vk ) = ET / 2 ( E = AT / 2 - signal energy, A - signal amplitude, T = L тэ - signal duration) and dispersion о2 = D ( V ) = N o T /4 of the module V k [7]
W 1 ( V k ) =
- V 2 + M2( V ) | ------ / 2
V J 2 D ( V ) И V M (Vk ) t V k / JDV g ' \ ) - hhx
D ( V ) o к D ( V ) 7 DVi^ '
2 V k h
D ( V )
where I0 ( * ) - modified zero-order Bessel function [9], 2 h 2 = M 2 ( V ) / D ( V ) = ( ET / 2) / ( NOT /4) - Signal-to-Noise ratio at the SC output with optimal correlation processing of signals in the k -th quadrature correlator;
– two one-dimensional distribution densities of modules Vτ at the outputs of neighboring (relatively synchronous) in the k + 1-th and k - 1-th quadrature correlators (the modulation code in the comparison signals is shifted by ±т3 ) according to the Rayleigh-Rice law with the square of the mathematical expectation M (V) = PTR (тэ)/2 (with reference to the NPAKF (3)) and the variance о2 = of the quadrature components of the module Vт with substitution u = Vk2 / 2D(V) we obtain
W 2 V ) = n l = 1
1 D ( V )
V 2 + M 2( V , ) R 2( т 3 )
V k 2 D ( V )
J V e L J 1 o
V τ M ( V τ ) R (τ э )
D ( V )
k

du e [ u+h 2 R 2( т3)]
;
- one-dimensional distribution W(V l) at the output of L - 3 quadrature correlators according to the Rayleigh law under variance о 2 = D ( V )
f v2 ^ ?2
T 3 V1 -I—l— T qV2/2D(V)
L-3 1 Vk \ 2D(V) L-3 k v 7
W3(Vl) = П^ J Vle к 7^Vl =П J e-xdx = (1 -e2D(V))L-3 .(6)
l=1 D(V) 0
Introducing notations p = Vk Io , u = Vт / о and integrating L - 3 multiple Rayleigh distribution (5)
according to Vl / σwe write the multivariate distribution W ( V ) for (2) in the following form:
k I o ( 2 k h )
W(V) = W1(Vk)W2(Vk)W3(Vk) = e 2 + h
V k 2
2D(V)Io(2hR(τэ) u)du j e (u+h 2 R 2( т 3))
V k 2
1 - e 2 D ( V )
L - 3
Then the probability of correct detection of the maximum module V by the quadrature correlator with the number k when analyzing the received signal, taking into account (1)–(7) and the change of variables р - 2 /2 ^ p, will be determined as
ОТ

I o [2 ^ h J
P + h 2 1 e L J
p
J
Io 2 JuhR (тэ )J
— ———du 11 - e p I
[ u+h 2 R 2 (тэ )J L
Formula (8) is used under the assumption that the equivalent cyclic delay т; of the analyzed signal can take values that are multiples of0, 1тэ, 2тэ,..., ( L - 1)тэ. In this case, the analyzed and reference signals are synchronous with respect to time up to the accuracy of тэ and upon completion of the search, ideal code synchronization is established. Timing diagrams explaining the synchronism of the analyzed and comparison signals are shown in fig. 1. In the latter case, when the moments tp (the beginning of the p element of the analyzed signal s ( t )) and t (the beginning of the action of the comparison signal s0 ( t ) or signal processing sr ( t )) must coincide, then the identity t p = 1 0 must be fulfilled (Fig. 1). This corresponds to the zero time detuning т = tp - 1 0 = 0 of the comprison signal of the “synchronous” quadrature channel relative to the analyzed signal (the modulus value V will correspond to the maximum of the NPACF, Fig. 1, в ). Although the probability of such "synchronism" is almost zero, during simulation it is possible to set a condition tp = 1 0 and determine the probability of a synchronization error for a given Signal-to-Noise ratio. Taking into account (8), the probability of erroneous detection of the maximum value of the module by the quadrature correlator with the number l ^ k will be P0 = 1 - Р пр .
At т = 0 the output Vk of the quadrature correlator with the number k corresponds to the maximum probability of correct recognition Р пр/ т = 0 = P(V k > V l ), l = 1, L - 1, l ^ k , which corresponds to the probability of erroneous detection
P o
ОТ
= 1 - J
Io [2л/ph J p+h 21 eL J
p
J
I o [ 2 JuhR (т э ) J
[ u+h 2 R 2 (тэ )] UU eL J
“I L -3
- e p J d p .
In the case when the synchronization error т can be equal to the value ± т э /2 - this is the least favorable case, so upon completion of the “search”, the code synchronization error can be ± тэ. In this case, the outputs Vk - 1 , Vk and Vk + 1 of quadrature correlators (with numbers k - 1 , k and k + 1 ), for comparison signals with appropriate time settings тэ /2 , - тэ / 2 and - 3тэ / 2 relative to the analyzed signal, are determined, respectively, by the values of the main NPACF output (3) as R ( - тэ /2), R (тэ / 2) and R (3тэ /2). In this case, the probability of a recognition error can be determined by taking into account W 1 (p), W 2 1 (p) and W 2 2 (p) in the distributions of NPACF values R (тэ / 2), R ( - тэ / 2) and R (3тэ / 2), respectively. Due to the parity of NPACF (3) with respect to the т distribution W 1 (p) and W 2 1 (p) will coincide in form. When “searching” from the moment to synchronization error matches the value т = t o - tp . The moment t o relative to the moment tp (time coordinate of the maximum of the main NPACF signal burst) can be considered as a random variable distributed uniformly over the interval [ - тэ /2, + тэ /2]. In this case, the conditional probabilities of correct detection at the time setting т = + тэ / 2 and т = - тэ / 2 (due to parity of NPACF relative to т )
will be the same value. Then the total conditional probability of correct detection will be determined through doubling and the conditional probability of erroneous detection of the maximum module by the quadrature correlator with the number k during the “search” with a finite time setting value т = |тэ / 2| takes the following form:
p , ,7 I o (2vP hR (т э
P 05 т э 1 2J, j P ± h 2 R 2 (т э /2) )
J
du
( u + h 2 R 2 ( - т э /2) )
e
o э du
I u + h 2 R 2 (3т э /2) I 0 e
L - 3
( 1 - e - P ) d p .
а )
sr ( t )
s r ±1( t )
UUL
p
P ± 1 LIUL
L - 1
L 1
UUL
p - 1 p U U L
p
б )
в )
bg( t ; T p )
p t0 t1
I T
H R ( T ) I
P +1
RR ( Т э )
Tr-
ULIL L -1
L
Т э ' 2 т Э 3 Т э
t
U U L
t
R (-Т э )
L R (- £3±l )
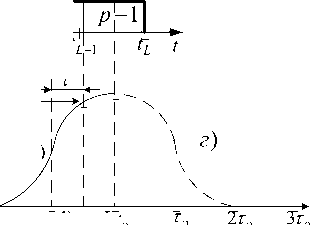
( L - 2)Т Э ( L - 1)Т э LT
Рис. 1. Эпюры анализируемого sr ( t ) и опорного s 0 ( t ) сигналов
Fig. 1. Time diagrams of analyzed sr ( t ) and comparison s 0 ( t ) signals
Formulas (9) and (10) determine the error probability in two extreme cases: synchronization error т = 0 and |т| = тэ /2 , respectively. Given the random nature of the parameter т , it is advisable to determine the average value of the error probability, assuming a random variable т uniformly distributed over the interval [ - тэ /2, ± тэ /2]:
P ср
^
1 -
n т э 7
т э 0 0
т
э
e
J
e
du
P
J
10 Г 2 JuhR (т - т э ) I du
I u ± h 2 R 2 (т - т э ) I
eL J
L - 3
| 1 - e P J d p
d т
Fig. 2. presents the dependence of the error probability P o, Рср , Р0 .5 Тэ on the Signal-to-Noise ratio h 2 under L = 214 - 1 = 16383, calculated according to formulas (9)-(11). Graph 1 is built for probability P o and corresponds to synchronous search in the absence of synchronization error (т = 0). Graph 2 is built for average error probability P ср and corresponds to the "search" with a possible random time error uniformly distributed over the interval [ - тэ /2, ± тэ /2]. Graph 3 is built for probability P 05^ when "search" with synchronization error |т| = тэ /2 . According to fig. 2 (graphs 23) with practical expediency, it is most acceptable to conduct a search with an error probability of at least 1*10-3 with a Signal-to-Noise ratio of h 2 = 15 ^ 16 dB.
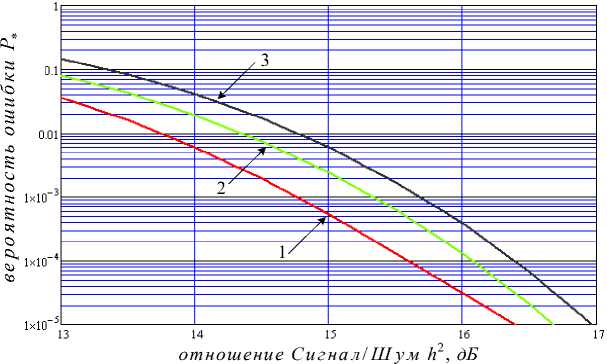
Рис. 2. Зависимости вероятности ошибки от отношения Сигнал/ Шум
1 - т = 0 ; 2 - {т} = ( - т э /2, + т э /2); 3 - |т| = т э /2
Fig. 2. Dependence of the error probability on the Signal-to-Noise ratio
1 - т = 0 ; 2 - {т} = ( - тэ /2, + тэ /2); 3 - |т| = тэ /2
Method for calculating the energy losses of the analyzed signal under the impact of the SI
The noise immunity of the algorithm for searching the onboard station for a signal s ( t )under the combined influence of structural s n ( t ) and fluctuation ^( t ) interference is studied by means of an optimal binary recognition scheme for orthogonal signals with an unknown phase.
As it is known [7], the recognition of one of the two discrete signals (the modulating code of each of the signals differs by such a cyclic shift nmin at which the cross-correlation coefficient R min( n mьтэ) is equal to the minimum value R min = 1/ L ) with a random phase in the presence of fluctuation interference is performed using the circuit shown in fig.3.
The recognition scheme includes two pairs of in-phase and quadrature correlators Ki and K q operating on a single time interval {t } = 0, T ( T = тэ L ):
– to calculate the components Yk and Yˆk of the correlation module Vk of the adopted implementation in the form s(t) + sn (t) + ^(t) and comparison signal so k (t), module Vk calculator Bk .
s ( t ) - analyzed signal [9] in the form
L
s ( t ) = A E rect [ t - ( l - 1)т э ]cos [ 2n ( d ki f^ + d ki fe ) t + n( b ki ® D r ) ] , (12)
i = 1
Here A - amplitude; f н(в) - manipulated lower (upper) frequencies; d ki ^ {0,1} and b ki e {0,1} - binary symbols, belonging to a cyclically shifted by k source M -code sequence and corresponding to the frequency and phase shift keying of the signal element l ; Dr - information symbol corresponding to the additional phase shift keying.
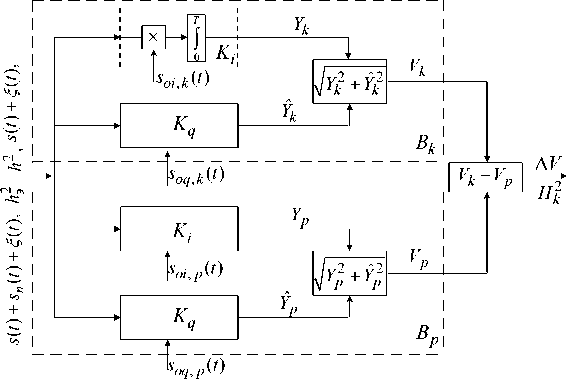
Рис. 3. Структурная схема распознавания ШПС-ЧММС сигналов
Fig. 3. Block diagram of ВВS-MSK signal recognition sn (t) - structural interference in the form of a signal from the nearest comparison station:
s n ( t ) = A n E r rec [ t - ( l - 1)тэ ] cos [ 2n ( d nl f I + d nl f в ) t + П( b nl ® Dn ) ] ,
here An - amplitude; f ^ - manipulated lower (upper) frequencies; d ni e {0,1} and bn i e {0,1} - binary symbols, belonging to a cyclically shifted by n source M -code sequence corresponding to the frequency and phase shift keying of the signal element l ; Dn - information symbol corresponding to the additional phase shift keying.
^( t ) - fluctuation interference with a uniform (in the signal frequency band) power spectral density N o .
so k ( t ) - comparison signal operating in the synchronous quadrature correlator:
s ok ( t ) = A o E rect [ t - ( l - 1)тэ ]cos [ 2n ( d kl f н + d kl f в ) t + n b kl ] , here Ao - apmlitude, can be taken equal to1;
– to calculate the components Yp and Yp of Vp module of accepted implementation correlations in the form of s ( t ) + s n ( t ) + ^( t ) and comparison signal s o p ( t ), acting in an asynchronous quadrature correlator, module Vp calculator Bp ;
– comparison scheme, essentially a subtraction scheme.
On fig. 4. possible diagrams of signals operating in the circuit are presented (Fig. 3). Here, the sn (t) - signal of the active structural noise (13), at the moment 10 of the beginning of the analysis, the modulating code {dnl} corresponds to the cyclically shifted byn elements of the original M -binary sequence {di} (as an example); so k (t) - comparison signal (14), at the start 10 of the analysis, the modulating code {dkl } corresponds to a cyclically shifted by k elements of the original M -binary sequence {di}; the analyzed signal s(t) - (12), at the moment 10 of the beginning of the analysis, the modulating code {dkl} corresponds to the cyclically shifted by k elements of the original M -binary sequence {di}; so p (t) - the comparison signal, at the moment 10 of the beginning of the analysis, the modulating code {dpl }corresponds to the cyclically shifted by p = nmin elements of the original M -binary sequence {dl} .
sn ( t )
n — 1!
s o , k ( t ) • • k - 1
T t o
n
k
n + 1
k + 1 k + 2
a
• • • n — 1
• • • k — 1
s ( t ) • • k — 1
k
k + 1 k + 2
• • • k — 1
• • •
t
• • •
t
• • •
t
s o , p ( t ) • • p 1
p
p + 1 p + 2
• • • p — 1
• • •
t
Рис. 4. Диаграммы сигналов, действующих в схеме распознавания
Fig. 4. Diagrams of signals acting in the recognition scheme
An erroneous decision while recognizing one of the two orthogonal signals occurs when the difference Vk — Vp has a negative sign, although the output of the lower calculator B p does not contain a recognizable signal. At the outputs of synchronous В k and non-synchronous В p calculators, modules Vk are Vp formed with mathematical expectations and variances M ( Vk ), M ( Vp ) and D ( Vk ), D ( Vp ), respectivelly. For reliable transmission of information during a phase modulation with an error probability of at least 1*10-5 a Signal-to-Noise ratio of h 2 = P t э L / No > 10 dB ( P = A 2 /2) — a relatively strong signal is required. With a strong signal, one can approximate the distribution law of the Rayleigh-Rice modules by a normal law. Then the probability of recognition error of one of the two signals can be defined as
Pe = 1 — Ф ( H k ), (15)
where Ф ( H k ) — probability integral [10]; H k ~ a Signal-to-Noise ratio at the “output” of the subtraction scheme (Fig. 3) determined by the relation [11]:
H k 2 = ( M ( V k ) — M ( V p ) ) 2/ ( D ( V k ) + D ( V p ) ) , (16)
where M ( V k ), M ( Vp ) and D ( V k ), D ( Vp ) – mathematical expectations and variances of modules Vp ( k ) at the outputs of synchronous В k and nonsynchronous В p calculators (Fig. 3).
Also, the probability of an error in binary recognition of orthogonal signals, by means of an incoherent circuit (Fig. 3), with signal energy P t э L under the action of interference ^( t ) with spectral density N o , can be determined through the Signal-to-Noise ratio h 2 using the known expression [7]
P e = e /2/2, (17)
where h2 = PtэL / No, the Signal-to-Noise ratio, at which at the input of the circuit (Fig. 3) there is a signal with duration tэ L. Equating (15) and (17) by the value of Hk , we can determine the equivalent Signal-to-Noise ratio hэ2 at the input of the orthogonal signal recognition circuit using the formula h2 =—2 Ln {2 [1 — Ф (Hk2)]}. (18)
The action at the circuit input (Fig. 3) additionally of structural interference sn (t) will lead, taking into account (15) and (17), to the probability of a recognition error, which will now be determined by the equivalent Signal-to-Noise ratio h2 calculated by expression (18). Here, the Signal-to-Noise ratio H 2 at the "output" of the subtraction circuit (Fig. 3) will now be determined by the influence of interference s(t). Hence, it is now possible to determine the equivalent energy losses л hЭ = h2 - hЭ,
due to the combined action of a signal with a Signal-to-Noise ratio h 2 and structural noise s ( t ), leading to an equivalent Signal-to-Noise ratio h 2 in the signal of the subtraction circuit (Fig. 3).
The modules V and Vp in (16), as random variables, are distributed according to the Rayleigh
Rice law with parameters of mathematical expectation and dispersion [12]
M ( V ) = °^ F i 1 h ) = лЛ
C h 2 ^
к 7
o
+ T I 1
к 7 к 7
h i 2 e 4
D ( V ) = 2^ 2

м 2 ( V ),
where о - standard deviation of the module V i quadrature components, Signal-to-Noise ratio at the "outputs" of the quadrature correlators:
h i = [ M 2 Y ) + M 2 Y )]/ о 2 = { M 2 [ R ki y i cos(9) + n y ] + M 2 [ R ki y i sin(ф) + fiy ]}/ ( N 0 T / 4) =
= R 2 i ( AT /2) 2 /( N о T /4) = 2 R^PT / No = 2 R2klE / N o = 2 h 2 R^, (21)
here Rki - cross-correlation coefficient of the analyzed and comparison signals; Ir (*) - modified order Bessel function of the first kind r [9].
Dispersion of fluctuation noise in output signals of correlators (module Vi )
D ( Y ) = о 2 = LN o Т э /4 . (22)
With reference to (16) and (20), for Hk2 (16) taking into account (20) can have the following form н 2 = (MVbMV,^ = 2 [Fk (hi)- Fp (h2 )]2 k DVJ + D(V,) 4 + h2 + hp - я[F2(hP) + fP(h2)]
At the "output" of the synchronous correlator (Fig. 3, Bk ) there will be two responses - to the analyzed signal s(t) and to structural noise sn (t), determined by the periodic autocorrelation function (PACF) of the signal s(t) and the periodic cross-correlation function (PCCF) of the signals s(t) and sn (t). The response to fluctuation interference will also act jointly.
Mathematical expectations for the in-phase and quadrature components [7] of the modules Vk(p)of the synchronous and asynchronous quadrature correlators (Fig. 3, 4, Bk and Bp ) can be written in the form
M ( Y k ) = #72 TRkk (т) cos( “ o Т + ф) + 4Pf /2 TRfk (t f ) cos( “ o Т f + Ф f ) M ( Y k ) = #72 TR kk (Т) sin(® o т + Ф) + PP /J T TR fk (Т f ) sin(® o т f + ф f ) M ( Y p ) = #72 TR , (T)cos(ro o т + ф) + PPjTTR f P (Т f )cos(® o т f + ф f ) , M ( Y p ) = #72 T R p (т) sin( ® o Т + ф) + PP /J T TRfp (t f ) sin( ® o Т f + ф f )
where P - analyzed signal power; Pn = A 2 /2 - structural noise power, Rk s(t) - PACF coefficient of the analysed signal s ( t ) with modulating code { d }, corresponding to the cyclically shifted by k elements of the original M -binary sequence { d }and the comparison signal so , k ( t ) with the modulating code { d }, corresponding to the cyclically shifted by k elements of the original M -binary sequence { dt }; т - delay of the start of the action of the k -th element of the comparison signal s o k ( t ) relative to the start of the action of the k -th element of the analyzed signal s ( t ) (fig. 4); Rn j(t„) - coefficient of normalized PACF of structural noise s ( t ) with the modulating code { d }, corresponding to the cyclically shifted by n elements of the original M -binary sequence { d } and comparison signal so , k ( t ) with the modulating code { d }, corresponding to the cyclically shifted by k elements of the original M -binary sequence { d[ }; rn - delay of the start of the action of the n -th element of the structural noise s ( t ) relative to the start of the action of the p -th element of the comparison signal s op ( t ) (fig. 4); R kp (t) - PACF coefficient of the analysed signal s ( t ) and comparison signal so , p ( t ) with the modulating code { dp , l }, corresponding to the cyclically shifted by p elements of the original M -binary sequence { d[ }; R n p (t n ) - PACF coefficient of the structural noise sn ( t ) and comparison signal s op ( t ); ю0 - cyclic center frequency; ф and фи - additional phase incursions [12] due to the parameters of the propagation path of the surface electromagnetic wave; cos(*) and sin(*) - correlation functions of high-frequency fillings at the central frequency.
Using the relations for trigonometric functions [13], we find from (21) and (23) the Signal-to-Noise ratio at the “output” of the synchronous quadrature correlator Bk (Fig. 3) in the form hk = {[Jp 2TRkk(t)cos(®oт + ф) + PPJT TRnk(tn)cos(®oтn + ф„)]2 +
+ [ J’2 TR kk T )sin(® o т + ф) + pP T TRn k (t „ )sin(® o т n + ф n ))]2} /( N o T /4) =
= 2 h 2 [ R ^ (t) + KR 2 k (t „ ) + 2 PKR n (t „ ) R kk (t)cos ( V( t ) ) ], (25)
where h2 = (PT2/2)/(NoT/4) = 2E/No - the Signal-to-Noise ratio at the “output” of the synchronous quadrature correlator Bk; K = Pn /P - noise intensity;
cos[ v( t )] = cos[® o (t - T n ) + ф - ф n ] (26)
-
- joint correlation function of high-frequency filling at the center frequency ю o .
The Signal-to-Noise ratio in the output signal (moduleVp ) of the non-synchronous quadrature correlator Вp (Fig. 3.) can be determined using (20) and (23), taking into account the trigonometric functions [13], we obtain h2 = {[ Vp/2 TRkp (t) cos(® o T + ф) + flUT TRnp (T n ) cos(m o T n + ф n )]2 +
+ [ ^/ P 7P TR kp (r)sin(® o т + ф) + pP T TR np (t n )sin(® o т n + ф n )]2}/( NT /4) =
= 2 h 2 [ R kp (t) + KR np (t n ) + 2 KKR^ (t) R np (t n )cos ( V( t ) ) ]. (27)
According to (25) and (27), the Signal-to-Noise ratios hk and hp are determined by cos[y(t)], where the phase angle ф(t) (26) is a non-stationary random process [14] and it is practically impossible to take into account its value in the processing equipment of the received signals by the onboard station. Sinse the variation area ф(t) is ±n, the upper and lower bounds of the synchronization error probability during the search will correspond tocos[y(t)] = ml. Thus, when searching for a relationship Signal-to-Noise hk2 and hp2 can be within the limits of two extreme values determined by the formulas hk = 2 h2 [ Rkk ± ^: ]2
h$ = 2 h 2 [ Rkp ± KKR] ] 2
Assessing the impact of SI in the search for BBS - MSK
In the RNS "Sprut" in order to ensure code separation, each of the SS signals is formed in accordance with the cyclically shifted modulating code relative to the original M -code. In accordance with this, the correlation coefficients (28) can take on the values of the the main and side emission levels of the module (calculated according to the formulas [15]) of the normalized periodic autocorrelation function (NPACF) for a broadband signal with MSK, under a modulating code sequence (length L = 16383) formed in the generator M -sequences (14-bit register with corresponding feedback taps). According to [15], the form of the calculated NPACF has an isosceles (up and down descending) trapezium. At the same time, for upward and downward descending values of the correlation function are determined by approximately equal intervals (2500 т э ) of delays. In the interval 2501 тэ ^ 13883 тэ, the value of the maximum NPACF emission equals 1.8*10-2, the average value of NPACF emissions is 4.2*10–3. Due to the main emission behavior (3), the minimum value of 6.1*10-6 can be in the interval of 3 т э ^ 16382 т э time delays. According to (28) at cos[y( t )] = -1 the coefficient Rnk (т) should take the minimum possible value. In view of the above, the most acceptable will be the values of the coefficient Rnk (т) determined by the upward converging section of the calculated NPACF on the delay interval of 3 тэ ^ 2500 т э .
If the support stations are at the distance of r =350 km from each other, then the propagation delay of the surface signal will be т p ; 1.167 ms (using the speed u0 3*108m/s of signal propagation, we make an error of the order of 0.1%) and at 2.5*10–6 s it will correspond to a "cyclic delay" of 466 - 467 modulating binary symbols { dnl }. Fig. 5 shows fragments of the emitted signal with a cyclic shift n i - 1by the remote support station ( SS i , i=1.3 - possible numbers of remote support stations), and the same signal received by the onboard station ( BS i ), taking into account the delay in its propagation, and the onboard station receiving ( BS k , k=1.3 - possible numbers of the nearest support stations) signal with cyclic shifts nk - 1by the nearest support station ( SS k ). Here, the correlation coefficient Rnk (т) will be determined by both the delay т p and cyclic shifts ( nk - 1and n i - 1) of the modulating code { dnl }of the original M -code sequence:
т э L
Т
э
ОСi
n i n ii + 1 ••• L - 1| L I 1 I 2 ••• n i - 1
n i I n i + 1 •••
БC
i
' t i 1
• t^
t
■ p = по т э
n In,- +1 ••• L -1 L 1 1'2 ••• n ii i
- 1
ni \ n++ 1 •••
j t Бi
T ik •
t
БС к n k n + 1 ••
•••L 1
• nk
—
1 nkln k + 1 •••
t k 1
Т э L t k 2
t
Рис. 5. Фрагменты излучаемых ОС и принимаемых БС сигналов
-
Fig. 5. Diagrams of the emitted SS and received BS signals
R nk (т) = R nk (т ik ) = R nk [( nk - 1)т э + T p - ( ni - 1)т 3 ] = R nk К n k + n o - ni )т э ] . (29)
For the indicated support stations, the following combinations of numbers of the remote and nearest support stations relative to the onboard station are possible: 1 and 2, 1 and 3, 2 and 3, 2 and 1, 3 and 1, 3 and 2. We choose cyclic shifts of the modulating code { dnl }of the original M -code sequence for SS i : n i - 1=0, SS 2 : П 2 - 1= 24, SS 3 : П 3 - 1= 49. Hense, with the given n0 = 466 and possible combinations of SS numbers, via (28) the following clock delay numbers т ik will be obtained:
SS1 and SS2 ^ 25 + 466 - 1 = 490;
SS1 and SS3 ^ 50 + 466 - 1 = 515;
SS2 and SS3 ^ 50 + 466 - 25 = 491;
SS2 and SS1 ^ 1 + 466 - 25 = 442;
SS3 and SS1 ^ 1 + 466 - 50 = 417;
SS3 and SS2 ^ 25 + 466 - 50 = 441.
Fig. 6 shows a fragment of an upwardly converging graph of the NPACF module for MSK signals with additional FM at the interval [361тэ,540тэ ] of clock delays (in order to obtain high resolution). As can be seen from fig. 6, the value of the maximum emission makes no more than 4*10–3; at the cycles values of 417, 441, 442, 490, 491 and 515 the values also do not exceed 4*10–3. Hence, the possible values of the coefficient Rkn (т) on the interval [361тэ,540тэ ] of clock delays cannot exceed the value of 4.0*10–3 with a clock delay of signal propagation n o .
Now consider the possible values of the correlation coefficients in (28) on the interval [361тэ,540тэ ].
Coefficient Rk ^(т) corresponds to the synchronous calculator B k (Fig. 3), then its value is commensurate with the unit (|т| < тэ /2 ) and can be taken equal to 1.
As shown above, the coefficient values Rkn (т) cannot exceed 4.0*10-3.
During the recognition circuit operation (Fig. 3), a cyclic shift n min = 5relative to the first signal is selected for the second signal, at which the cross-correlation coefficient R m in( n min т э ) is equal to the minimum value R m in = 1/ L = 5.1 * 10-5 (Fig. 7), thus the coefficient Rkp (т) = R min can be accepted.
• ••
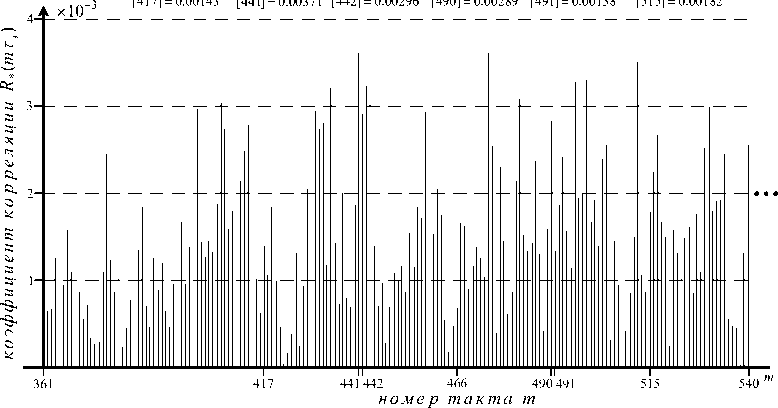
Рис. 6. Фрагмент графика модуля НПАКФ для ЧММС сигналов с дополнительной ФМ на интервале тактов [361,540]
-
Fig. 6. Fragment of the diadram normalized PACF module for MSK signals with additional FM on the clock interval [361,540]
Relative to the second signal (Fig. 3-6), the values of the R np (t) coefficient will also be in the interval [ 361тэ,540тэ ] of clock delays and will not exceed 4*10-3.
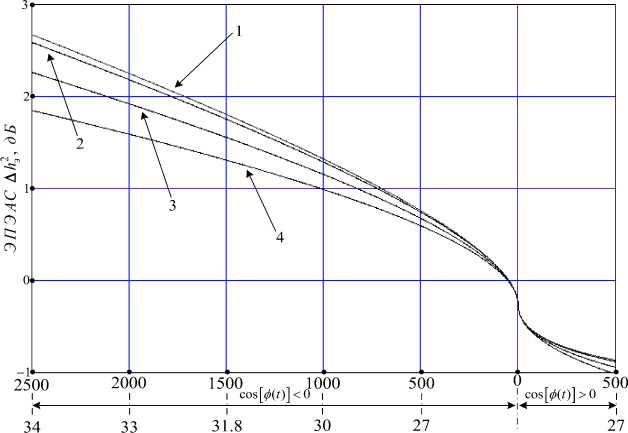
By means of (18), (17), (22) and (28), it is possible to determine the potential equivalent energy losses A h 2 of the analyzed signal (EELAS) at a given value of the Signal-to-Noise ratio h 2 due to the impact of structural interference in the signal form s ( t )with intensity K , possible coefficient values Rkn and R np and extreme values cos[y( t )] = ± 1. Fig. 8 shows the dependence of EELAS at h 2 ; 10dB and correlation coefficients Rkn , maximum 3.9*10–3 and (as an example) determined by possible combinations of numbers of the remote and nearest support stations relative to the onboard station: 3 and 2 ^ 3.71*10-3, 1 and 2 ^ 2.89*10-3, 2 and 3 ^ 1.38*10-3. From the analysis of Fig. 8 it follows that the search for signals together with structural interference at its intensity K can be carried out within the upper (cos(^( t )) < 0 ) and lower (cos(^( t )) > 0 ) limits of the synchronization error probability. When searching for signals and atcos(y( t )) > 0, the negative effect of structural interference s ( t )is excluded. It follows from the graphs behavior (Fig. 8) that smaller EELAS also correspond to a smaller value of the coefficient Rkn ( p )(t) . Under the impact of structural interference with an intensity of no more than 34 dB, the permissible equivalent energy loss of the analyzed signal will be not exceed 3 dB (under a minimum value of the correlation coefficient = 1.38*10–3 – no more than 2 dB) and the equivalent Signal-to-Noise ratio h 2 will not exceed h 2 - A h 2 = 7 db. Thus, in order to ensure a reliable search for the analyzed signal with a Signal-to-Noise ratio h 2 ~ 10dB (when synchronization error probability is not worse than 1*10-3 with a synchronization error |t| < т э /2 , Fig. 2), it is necessary to ensure h 2 ~ 15 - 16 dB, but taking into account the Signal-to-Noise losses, it equals h Э2 ~ 7 dB, the search of which will require additional incoherent accumulation of up to 15-16 dB. The value of 7 dB corresponds to a relatively strong signal, so then the generalized Rayleigh distribution law of the module Vk can be approximated by a normal law with mathematical expectation M ( V ) and dispersion D ( V ) (20); and then to ensure h 2 ~ 15 - 16 dB, it is necessary to perform 8-fold linear accumulation, so that the “parallel” search can be carried out for 8 L тэ < 0,33 s (in the RNS "Sprut", L = 16383, тэ = 2,5 ms is the duration of the signal element).
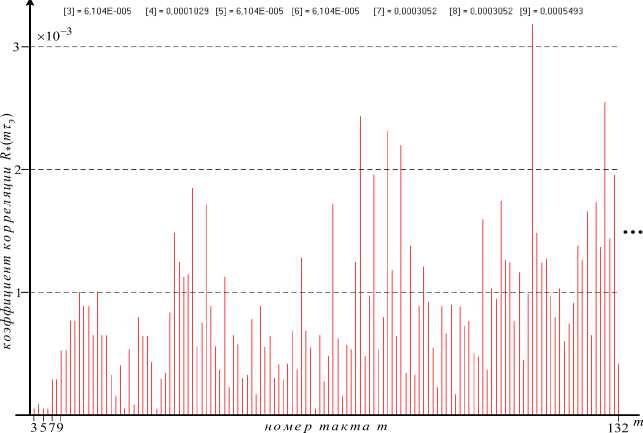
Рис. 7. Фрагмент графика модуля НПАКФ для ЧММС сигналов с дополнительной ФМ на интервале тактов [3,132]
-
Fig. 7. Fragment of the diadram normalized PACF module for MSK signals with additional FM on the clock interval [3,132]
Интенсивность помехи K , дБ
Рис. 8. Зависимость энергетических потерь анализируемого сигнала от интенсивности K :
1 - при R kn = 3,9*10- 3 ; 2 - при R kn = 3,71*10 —3 ; 3 - при R kn = 2,89*10- 3 ; 4 - при R kn = 1,38*10-3
-
Fig. 8. The dependence of the energy losses of the analyzed signal on the intensity K :
-
1 - under R kn = 3,9*10 -3 ; 2 - under R kn = 3,71*10-3; 3 - under Rkn = 2,89*10-3; 4 - under Rkn = 1,38*10-3
On Fig. 9 the working area of the RNS is shown (for the RNS "Sprut" the working area is built taking into account the adoption of the maximum distance from the support station up to Dmax = 600 km), formed by 3 combined sectors intersecting at points Пikwhich centers are SSi locations (for example, on islands), and the arcs di are the locus of points with the maximum distance (R1 = R2 = Dmax) from SSi. When the onboard station moves from the point Пa (closest BS to the location of SS2) to the point Пb , there is a distance of BS from all SS, so we can say that there is an increase in the propagation delay of signals from both the remote support station SS1 and the nearest support station SS2. In this case, when changing the signal propagation path Δ r1 from SS1 and changing the signal propagation path Δ r2 from SS2 relative to the BS, the correlation coefficient Rnk (тik) will be determined
R nk (т ik ) = R nk [( nk - 1)т э + т p + Ат1 - Ат2 - ( n i - 1)т э ] = Rnk [( nk + n o - ni )т э + Ат] , (29)
Here Ат 1 = А r 1 / v - the shift in signal propagation delay from SS i , Ат2 = А r2 / v - the shift in signal propagation delay from SS 2 ( v - propagation speed of a surface electromagnetic wave). The difference in the delay shifts Ат when the BS moves in the right half-plane relative SS 2 will always be negative since А г 2 > А г 1 , and when moving in the left half-plane т p decreases, which indicates the impossibility of exceeding the maximum possible value т ik and the coefficient Rnk (т ik ) will not exceed 3.9*10–3. The same can be said about the search for a signal with other number combinations of the remote and nearest support stations.
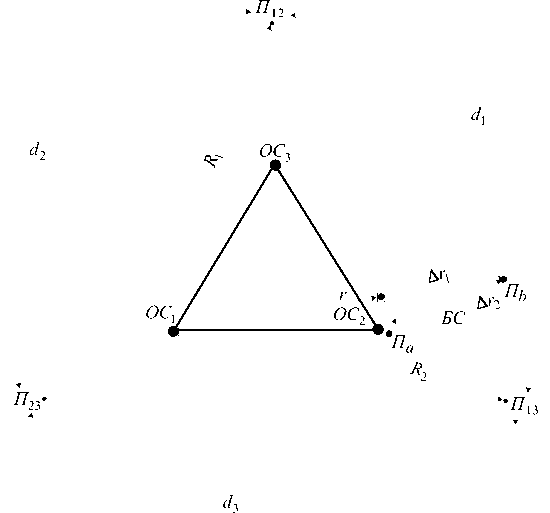
Рис. 9. Рабочая зона РНС с учётом расположения опорных и бортовой станций
Fig. 8. The working area of the RNS, taking into account the location of the support and on-board stations
Conclusion
The method for analyzing the effect of structural noise on the search for signals in which appropriately selected cyclic shifts by elements ni of the same M -sequence of length 16383 are used as modulating codes are proposed in this article. The choice of cyclic shifts suggested makes it possible to use the correlation coefficients of the NPCCF of structural interference by an order of magnitude less than the maximum (2.8*10–2), which leads to equivalent energy losses of the signal -the search not exceeding 3 dB. The indicated conditions for SS signals search in a broadband RNS of the medium wave range enables to effectively apply code division of signals when using a combined radio channel (for navigation measurements and data transmission) without limiting the RNS working area, determined by the maximum range value D max = 600 km.
References Noiseimmunity of the search for broadband frequency manipulation signals with minimal shift of the radio navigation system under the influence of structural interference
- Varakin L. E. Sistemy svyazi s shumopodobnymi signalami [Communication systems with noise-like signals]. Moscow, Radio i svyaz Publ., 1985, 384 p.
- Agafonnikov A. M. Phazovye radiogeodezicheskie sistemy dlya morskikh issledovaniy [Phase radio-geodesic systems for marine research]. Moscow, Nauka Publ., 1979, 164 p.
- Varakin L. E. Teorya sistem signalov [Theory of signal systems]. Moscow, Sovetskoe radio Publ., 1978, 304 p.
- Varakin L. E., Vlasov A. V. [Analysis of the impact of powerful structural interference on a radio engineering system with noise-like signals]. Radiotehnika i elektronika. 1983, Vol. 28, No. 6, P. 1094–1101.
- Krokhin V. B., Belyaev V. Yu., Gorelikov A. V. et al. [Methods of modulation and reception of digital frequency-manipulated signals with continuous phase]. Abroad. Radio electronics. 1982, No. 4, P. 58–72.
- Musonov V. M., Romanov A. P. [Search for broadband signals of a ground radio navigation system]. Siberian Aerospace Journal. 2022, Vol. 23, No. 3, P. 391–408 (In Russ.). Doi: 10.31772/2712-8970-2022-23-3-391-408.
- Shumopodobnye signaly v sistemah peredachi informazii [Noise-like signals in information transmission systems]. Ed. V. B. Pestryakov. Moscow, Radio i svyaz Publ., 1982, 424 p.
- Ventzel E. S., Ovcharov L. A. Prikladnye zadachi teorii veroyatnostey [Applied problems of probability theory]. Moscow, Radio i svyaz Publ., 1983, 416 p.
- Yanke E., Emde F., Lyosh F. Spezialnye funkzii [Special functions]. Moscow, Nauka Publ., 1977, 342 p.
- Tichonov V. I., Charisov V. N. Statisticheskiy analiz i cintez radiotehnicheskih ustroystv i system [Statistical analysis and synthesis of radio engineering devices and systems]. Moscow, Radio i svyaz Publ., 1991, 608 p.
- Vaisey D. J., McLane. Bend limitation and error rate in digital UNF-FM transmission. IEEE Trans. 1983, Vol. COM-31, No. 11, P. 1222–1224.
- Kinkulkin I. E., Rubtsov V. D., Fabrik M. A. Phazovyi metod opredeleniya kordinat [Phase method of determining coordinates]. Moscow, Sov. Radio Publ., 1979, 280 p.
- Bronshtein I. N., Semendyaev K. A. Spravochnik po matematike dlya inzhenerov i uchashchihsya vtuzov [Handbook of Mathematics for engineers and students of higher education institutions]. Moscow, Nauka Publ., 1986, 544 p.
- Varakin L. E. Teorya slozhnyh signalov [Theory of complex signals]. Moscow, Sovetskoe radio Publ., 1970, 376 p.
- Simon M. K. The autocorrelation function and power spectrum of PCM/FM with random binary modulating waveforms. IEEE Trans. 1976, Vol. COM-24, No. 10, P. 1576–1584.
