Non-Invasive Blood Group Prediction Using Optimized EfficientNet Architecture: A Systematic Approach

Author: Nitin Sakharam Ujgare, Nagendra Pratap Singh, Prem Kumari Verma, Madhusudan Patil, Aryan Verma
Journal: International Journal of Image, Graphics and Signal Processing @ijigsp
Article in issue: 1 vol.16, 2024.
Free access
This research work proposed a non-invasive blood group prediction approach using deep learning. The ability to swiftly and accurately determine blood types plays a critical role in medical emergencies prior to administering red blood cell, platelet, and plasma transfusions. Even a minor error during blood transfer can have severe consequences, including fatality. Traditional methods rely on time-consuming automated blood analyzers for pathological assessment. However, these processes involve skin pricking, which can cause bleeding, fainting, and potential skin lacerations. The proposed approach circumvents noninvasive procedures by leveraging rich EfficientNet deep learning architecture to analyze images of superficial blood vessels found on the finger. By illuminating the finger with laser light, the optical image of blood vessels hidden on the finger skin surface area is captured, which incorporates specific antigen shapes such as antigen ‘A’ and antigen ‘B’ present on the surface. Captured shapes of different antigen further used to predict the blood group of humans. The system requires high-definition camera to capture the antigen pattern from the red blood cells surface for classification of blood type without piercing the skin of patient. The proposed solution is not only straightforward and easily implementable but also offers significant advantages in terms of cost-effectiveness and immediate identification of ABO blood groups. This approach holds great promise for medical emergencies, military battleground scenarios, and is particularly valuable when dealing with infants where invasive procedures pose additional risks.
Deep learning, cnn, efficientnet, abo blood type
Short address: https://sciup.org/15018857
IDR: 15018857 | DOI: 10.5815/ijigsp.2024.01.06
Text of the scientific article Non-Invasive Blood Group Prediction Using Optimized EfficientNet Architecture: A Systematic Approach
There are four common blood groups (A, B, AB, and O). Person’s blood is determined by the gens inherited from its parents. Each of these common blood groups can be either Rh positive or Rh negative, which further classified into 8 blood groups [1]. Human blood contents include RBC, ABC, platelets and plasma. Any of these 8-blood group are predicted by identifying the presence of antibodies and antigens in the blood. Antibodies can be observed on exterior sheath of RBC i.e., in plasma and these are produced by specialized white blood cells called ‘B’ cells. However, human’s immune system reacts to foreign red blood cell when they have markers called as antigens thereby typically located on the extracellular surface of RBC membrane. The blood group is determined by an ABO blood typing system. The presence or absence of protein molecules helps to predict the ABO blood type. Antibodies are the proteins found in plasma which functions as natural defense system of human body that recognizes foreign materials such as germs, bacteria, viruses and alerts the immune system to demolish them further [2]. On the contrary, antigens are any foreign particles that induce the immune system to produce the antibodies against it, eventually depict the human’s immune system behavior that do not have the ability to recognize the foreign substances.
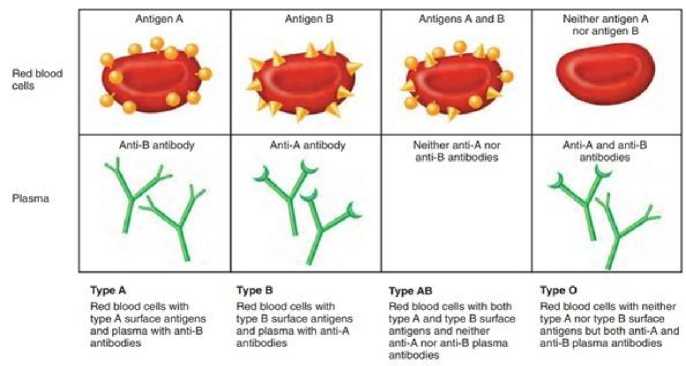
Fig. 1. ABO Blood Groups [19]
Blood group classification consists of invasive procedure which is quite time consuming and discrepancy may occur when results of red cell typing do not match with plasma typing, sometimes due to clerical error or technical problems with sample during testing. Considering these challenges, there is a demand of tangible non-invasive blood group classification. Based on the compatibility; blood transfusion is carried out. For secure blood transfusion, blood group determination is essential. [3] According to research carried out by the ARC (Accident Research Centre), approximately 12000 lives are compromised annually in road accident that causes about 35,000 injuries. In an event of accident, it becomes essential to perform urgent blood transfusion for which it is necessary to conduct blood group identification of the victim instantly. Apart there are few other use cases where blood typing may be required for rapid diagnostics such as public health care center and forensics spot. Conceivably, the most real requirement is in countryside areas of developing countries like India where availability of pathological labs and trained medical staff is limited. Early 19th century, Karl Landsteiner introduced the human ABO blood group types. Agglutinogens are the antigens present on the surface of red blood cells and antibody that reacts to antigens are typically known as agglutinins. The Rh blood group is one of the 35 widely known blood systems. Rh component is a macronutrient seen on the cellular surface of red blood cells. If a given blood sample contains this macronutrient, then it is classified as Rh positive or else Rh negative [4]. With the advent of cutting-edge technologies, the blood group determination in conventional pathological lab is time taking and any procrastination during blood transfusion in medical emergencies leads to risk of patient life. In developed countries automated devices are used for blood group determination in many hospitals but such systems are big in size and expensive. Considering the constraints of traditional blood group determination; we proposed an automated system based on deep learning that predicts a blood type immediately.
The primary contribution in this paper is:
i. The data acquisition methodology, statistical analysis of input and blood group distribution
ii. The selection of available CNN models for classification of blood group based on neural network
iii. Designed proposed optimized Efficient-Net model to predict the blood group of an individual and compare its performance with other CNN models
2. Literature Review
3. Methodology
The blood group is determined according to the presence or absence of antigen seen on red blood cells essentially in the plasma that acknowledge human’s body to recognize its blood type. In clinical blood examination, there are wide range of conventional processes and practices which may vary in terms of responsiveness, reactants and device used as well as need of operation. Unfortunately, all of them deal with invasive blood sample collection.
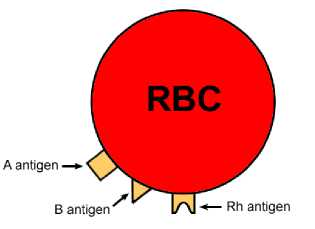
Fig. 2. RBC with antigens on membrane surface [18]
Among all the available conventional procedures of blood group prediction, slide test is least sensitive in which, the donor and recipient blood is combined with antigen A, B & D on separate slides. [5] The blood agglutination pattern is manually observed to classify ABO and Rh type blood. However, this method is expensive and required 10 to 15 minutes to complete. The tube test is reliable in comparison to slide, due to its moderate sensitivity. It uses forward and reverse grouping, where the blood sample are collected in two test tubes. One droplet of each antigen is mixed separately in these test tubes. Tubes are then kept for centrifugation for couple of minutes and then shaken to visualize the blood embolism. Microplate technology [6] is fast and can be automated for blood typing. The Microplate methodology uses several small tubes that contain a few microliters of reactants which are used against the given blood samples. The investigation of centrifugation and blood embolism nurturing is carried out by an automatic device. Microplate technology is found fast and highly sensitive. The Column/Gel centrifugation test [4] composed of small micro tubes that consist of gel to limit the agglutination. Blood cells are combined with antigen A, B & D reactants in micro tubes under controlled environment and centrifugation. The gel medium captures the agglutinates; however, nonagglutinated blood cells are strained through the medium. This method is highly sensitive as compare to other but time consuming.
Gayathri et al. [7] proposed non-invasive method for identifying blood type. The proposed research work uses LED light which acts as a source for optical signals that is allowed to pass through the finger and optical detector (OPT 101) is used to prevailing optical signals obtained from the finger. Depending on the optical property, blood may differ for various antigens present on the red blood cell and therefore voltage value will also vary. Based on the range of output voltage level, blood type is classified. This method determines the ABO blood group in a short span of time and cost effective but the range of output voltage levels for each blood type is very close to each other. As a result, this method is not reliable and may lead to misclassification of blood group. Gaurav Mehare et al. [8] proposed a system that deals with light scattering mechanism for classifying blood cell considering presence or absence of antigens on typical surface of membrane. The light from the optical device moves through antigenic substances, epitopes of antigens and eventually captures multiple images of a specific focus area with the help of camera. The captured image is compared with the available sample blood type image by processing it pixel wise using pattern matching algorithm. The difference between captured image and all sample blood type image is used to predict the blood group. This system is non-invasive small sized, cheaper, requires less time for classification of blood type. The major drawback of this research work is dependency on conventional image processing algorithms and the size of the dataset is very less to train the model for desired task. Pallavi K. et al. [9] proposed IoT solution for classification of blood types. The proposed method uses LED, OPT101 sensor, Arduino Board and PC display for implementation. The light from LED passes through the finger. The OPT 101 detector converts light into voltage level. The optical variations in blood and corresponding voltage level are used to classify the blood group. The system developed by Gaurav Mehare, Chetan Pinjarkar and system implemented by Pallavi K., Immaculate Stefi are identical except the hardware settings. During the survey, we recognized that output voltages level obtains in both the systems lead to misclassification because each blood group’s range of voltage level is very close to each other. Panjivarna, Saranya, Anitha and surya, proposed method [10] that automatically classify human blood type by utilizing conventional image processing algorithm on captured images of superficial capillaries underlying the skin surface. Distinguished architecture of proposed system includes preprocessing of image for enhancement, HSV conversion, morphological operation, and image segmentation. This system is implemented in MATLABR2018A but author experienced the variation in accuracy of blood group prediction due to external light intervention, insufficient training dataset and low responsiveness of image capturing device. The author has explicitly stated that to increase the accuracy, number of samples could be used to thousand per group and advanced machine learning or deep learning architecture can be used. [11] Bhubaneswar et al. proposed IoT based non-invasive approach for blood group detection. This proposed idea is same as existing system except the additional feature called request button implemented in mobile application that connects the recipient with blood donor in case of medical emergencies. [12] This research work collects raw blood image from various hospitals and medical labs. These images are then preprocessed to remove the noise and elimination of outliers. Preprocessed images are segmented into four parts for feature extraction. Extracted features are then use for prediction of blood groups. The system developed aims to classify the common blood group as well as targets the special blood group type called ‘Bombay Blood.’ The result and discussion section of this article does not give any details but can be improved further to determine the blood types except antigens or anti serum. In addition to this, machine learning algorithm used is not mentioned. The Balaji B et. al. [13] and others proposed novel approach for identification of ABO blood group using deep learning algorithm. The authors have developed the ABO dataset and automatically predicts the blood type using convolution neural network (CNN) which can extract and learn features from developed dataset. The proposed research work claims the 96.5 percent accuracy and suitable for blood group prediction when compared with existing CNN models. G. Ravindran et. al. [14] proposed method utilizes image processing techniques such as thresholding and morphological operations to process images acquired during the slide test and evaluate the occurrence of agglutination. It mentions the use of global thresholding, an algorithm capable of automatically choosing a threshold based on image data, which is more appropriate for images with uniform contrast distribution like document images. The research work does not provide information on the generalizability of the developed method to different blood types or changes in agglutination pattern. The authors [15] presents HemaApp, a smartphone application that noninvasively monitors blood hemoglobin concentration using the smartphone's camera and various lighting sources. The authors perform a chromatic analysis by analyzing the color of the patient's blood when a light source shines through their finger to estimate hemoglobin levels. The evaluation of application was conducted on a relatively small sample size of 31 patients, which may limit the generalizability of the finding. Vijay Kumar Patil et. al. [16] proposed an optimized Convolutional Neural Network (CNN) as an extension of AlexNet for correlating fingerprint patterns or different features of the fingerprint with the blood group of an individual. The study focuses on the ABO and Rh systems, which are prominent blood grouping methods, and explores the potential of using fingerprint analysis to predict an individual's blood type. The work introduces the concept of using transfer learning theory for feature extraction in the classification of blood group using fingerprint images .In our extensive review of literature, we identified a significant gap in the availability of robust, fast, and accurate systems for non-invasive blood group prediction in humans. To address this gap, our research aims to design and develop a state-of-the-art non-invasive blood group prediction system by harnessing the power of cutting-edge deep learning architectures. Through our work, we aim to bridge this critical technological void and provide a reliable solution that can revolutionize blood group prediction, eliminating the need for invasive procedures.
In this section the proposed methodology presented for classification of blood group using finger print image of different classes. The first step in this study is to define the data collection and its description. The next section discusses the optimization of existing Efficient-Net CNN model. We found the two ways to perform blood group prediction using non-invasive approach [17]. The first contains use of output voltage level of optical detector as classification metric for predicting the blood type. During analysis, we observed that first approach relies on internet of things architecture. The IoT architecture consists of a photo resistor, a light source, a microcontroller and an analog digital converter that converts the capacitor’s output value from analog to digital. Further this digital output will be given as an input to microcontroller. The following are the steps of IoT approach,
-
i. The user will place his/her finger over a photo register. This photo register is connected to the analog-to-digital converter which is connected to the microcontroller.
-
ii. A light source is placed over the finger. Once the light is projected onto the finger then light penetrated from the finger will be projected onto the photo resistor.
-
iii. Photo register uses photons from the light as a metric to determine resistance. Photo register is connected to a capacitor where the current will be deposited.
-
iv. Use an analog-to-digital converter to determine the voltage in the capacitor.
-
v. Compare these values with a specific range of voltage values to determine the blood group.
-
vi. Ultimately microcontroller is used to project these values onto an LCD display.
On the contrary, the second approach uses deep learning architecture. The benefits of a deep learning-based non-invasive approach are substantial and can revolutionize the way solutions are developed and deployed. Deep learning models excel at learning complex patterns [20] and relationships from data. They can adapt to various data distributions and capture intricate nuances, resulting in higher accuracy compared to traditional rule-based IoT methods that might struggle with complex or non-linear patterns. Deep learning models automatically learn relevant features and hierarchies from raw data. This eliminates the need for manual feature engineering, which is often required in IoT-based methods. Deep learning-based approaches primarily rely on software algorithms. This eliminates the need for specialized hardware components which often require in IoT-based solutions such as specific sensor devices [21] that ultimately limit flexibility and increase costs. In summary, deep learning-based non-invasive approach encompasses accuracy, adaptability, scalability, insights, efficiency, and user acceptance. These advantages collectively contribute to more effective and comprehensive solutions in various domains, making the non-invasive deep learning approach a preferred choice for addressing complex problems.
-
A. Dataset Collection
The 103 samples belonging to different blood group are collected through the device shown in the figure below.
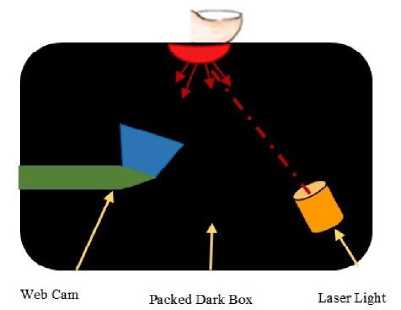
Fig. 3. Data Collection Device Architecture
A desktop application is implemented in python that reads the input users demographic details and captures the images through above black box containing laser light and web camera. The data collection is performed as follows,
-
i. The user will place his/her thumb under the light source.
-
ii. The sensitive photo detector traces the path of the light on being deflected or absorbed by the red blood cells.
-
iii. When light is illuminated at certain frequencies, it is absorbed by the hemoglobin in the red cells, perhaps due
to coherent nature of illumination - the light gets scattered in a small margin on hitting the edges of the antigenic determinants having a specific structure.
-
iv. An optical device captures multiple images for different light scatterness pattern for a certain period to obtain after-effect of scattering.
-
v. Subsequently, a deep learning model will read the captured image and extract features such as scattering events and record the pattern of scattered light based on the molecular shapes of epitopes for different antigens like ‘A’, ‘B’ and ‘Rh’ antigens.
-
vi. Eventually deep learning model will use these features to classify the blood group.
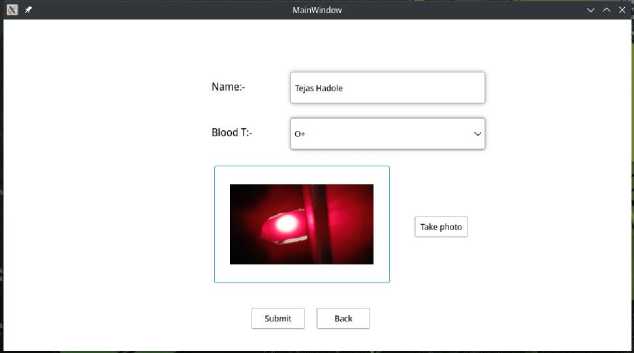
Fig. 4. Data Collection Desktop Application

Fig. 5. Data Generated
-
B. Dataset Summary
In real time, the 103 sample images are collected, which include 48 males and 55 females of varying age between 18-50 years at MVPS’s KBT College of Engineering, Nashik Maharashtra India by using proposed data acquisition methodology.
Table 1. Input Dataset
|
The Input Dataset |
||
|
Sr. No. |
Blood Group Type |
No. of Samples |
|
1 |
A+ |
24 |
|
2 |
A- |
01 |
|
3 |
B+ |
29 |
|
4 |
B- |
00 |
|
5 |
O+ |
36 |
|
6 |
O- |
03 |
|
7 |
AB+ |
10 |
|
8 |
AB- |
00 |
-
C. Statistical Analysis
The ratio of males to females is 1:1 with the number of males being approximately equal to that of females. The distribution of sample according to gender and blood group is shown in Table 2.
|
A |
B |
AB |
O |
Total |
|
|
Male |
07 |
16 |
05 |
20 |
48 |
|
Female |
18 |
13 |
05 |
19 |
55 |
|
Total |
25 |
29 |
10 |
39 |
103 |
The Table 2. offers valuable insights into the relationship between sex (male and female) and blood group types (A, B, AB, O) among a sample population of 103 individuals. This discussion aims to interpret the patterns observed within the data. Table 2. exhibits a clear distinction between male and female distributions across different blood groups. Through data interpretations and analysis, some interesting observations can be made:
-
i. Blood Group A Dominance: Both male and female participants have a higher prevalence of blood group ‘A’ compared to other blood types. This could imply a commonality in the genetic makeup of the sample population that favours the presence of the antigen ‘A’.
-
ii. Gender Disparities: The distribution patterns also highlight some gender-specific trends. For instance, blood group ‘B’ appears to be more prevalent among males, while blood group A is more prominent among females. Such disparities might indicate potential gender-related genetic influences on blood group distribution.
-
iii. Blood Group AB and O Equivalence: Blood group AB and O have similar representations within both gender groups. This suggests that these blood groups might not exhibit strong gender-related differences, and their distribution could be influenced more by other factors such as genetic inheritance.
-
iv. Total Distribution Balance: The total distribution of blood groups across the entire sample population reflects the natural distribution of blood groups within the broader population. This balance further validates the reliability of the collected data.
The observed patterns could be influenced by genetic factors, regional demographics, or other variables. The insights gained from this table lay the foundation for further research and exploration into the genetic and environmental factors that shape blood group distribution within diverse populations. The distribution of samples according to ABO & Rh blood group is shown in following table. t able 3. d istribution of s amples a ccording to abo & r h b lood Group (n=103)
|
Distribution of Samples According to ABO & Rh Blood Group |
|||
|
Blood Group |
Rh+ve |
Rh-ve |
Total |
|
A |
24 |
01 |
25 |
|
B |
29 |
00 |
29 |
|
AB |
10 |
00 |
10 |
|
O |
36 |
03 |
39 |
The Table 3. provides a detailed breakdown of the sample population's distribution across different ABO blood groups (A, B, AB, O) and their respective Rh factor (Rh+ve or Rh-ve). After data distribution analysis, we uncovered the following data certainties.
i. Blood Group A: Among the individuals with blood group A, 24 individuals are Rh+ve, and only 1 individual is Rh-ve. This indicates a significant predominance of the Rh+ve factor among individuals with blood group A.
ii. Blood Group B: For blood group B, all 29 individuals are Rh+ve, with none having the Rh-ve factor. This suggests a complete absence of Rh-ve factor in the sample population for blood group B.
iii. Blood Group AB: In the case of blood group AB, all 10 individuals are Rh+ve, and there are no individuals with the Rh-ve factor. This emphasizes a uniformity of Rh+ve factor in individuals with blood group AB.
iv. Blood Group O: Among individuals with blood group O, 36 are Rh+ve, while 3 are Rh-ve. This indicates a notable predominance of Rh+ve factor in blood group O, although there is a small presence of the Rh-ve factor as well.
4. Implementation Details
The data also provides insights into the distribution of Rh factors across all blood groups. The overwhelming majority of the sample population possesses the Rh+ve factor making it dominant over others. This holds true across all blood groups (A, B, AB, O). It's worth noting that there is no occurrence of the Rh-ve factor in blood groups B and AB in this particular sample. While the Rh-ve factor is less common, it is present in blood groups A and O. This suggests that individuals with these blood groups may have a slightly higher likelihood of having the Rh-ve factor compared to other blood groups. In summary, this table highlights the significant influence of the Rh+ve factor across all blood groups, reflecting the predominant distribution of this factor within the sample population. Considering the data distribution, the number samples for blood type A-, B-, O- and AB- are very less as these are rare blood types [22].
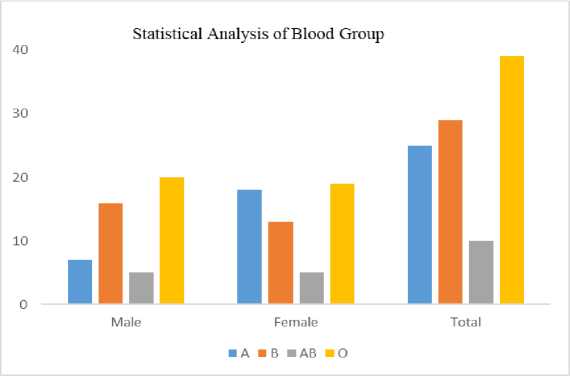
Fig. 6. Distribution of Samples According to Blood Group
To enhance a model's reliability in the presence of a small dataset, it's essential to acknowledge these challenges and take appropriate actions. Employing techniques such as data augmentation, regularization, transfers learning, and feature engineering can help reducing some of the limitations and enhance the model's ability to generate reliable predictions in broader contexts. Typically, data augmentation techniques such as horizontal flipping, random cropping, rotation, zooming, color jittering and translation etc., is especially addresses the problem of small dataset size and useful in computer vision tasks, where small variations in the appearance of objects can greatly impact the model's performance. Moreover, the robust solution is to expanding dataset by additional data collection. Miserably, data collection process exhibits strong resistance by an individual’s when it comes to providing sample data, primarily due to privacy concerns related to personal and demographic details. This necessarily becomes the challenge while dealing with expansion of data collection.
The proposed system includes a device on which the user will place his finger. The user’s finger will directly come in the proximity of a light source which will be a laser light. Below the finger, there will be a camera. When the light is turned on, it will pass through the finger and the camera will capture an image of the scattered light. Camera passes it to a classifier to determine its blood group.
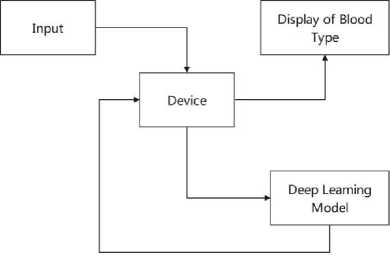
Fig. 7. Block Diagram of System
Our proposed Efficient-Net convolutional neural network design was trained with 30 epochs and meticulously coded in PyTorch 2.0. It provides GPU acceleration for training and offers a range of tools for building, training, and evaluating neural networks. The Core-i5 processor with a clock speed of 3.3 GHz offers a decent level of processing power. The available computing resources can still handle complex training tasks, especially when coupled with GPU acceleration. The 8 GB RAM capacity is reasonable for training EfficientNet models. The memory is used to store intermediate results, model parameters, and data during training. Notably, the hardware configuration is fortified with a robust 4 GB NVIDIA graphics solution, significantly speed up the training process. The EfficientNet architecture is chosen for its efficient design, making the most of the available hardware resources while still achieving high accuracy. With the assistance of the 4 GB GPU and PyTorch's GPU acceleration, training time was significantly reduced during the experimentation. The 8 GB RAM should be sufficient, however, it's important to monitor memory usage, especially when dealing with larger datasets or models. The combination of the CPU and GPU, along with PyTorch's capabilities, provides a well-rounded computing support for training the EfficientNet model. Efficient Net’s architecture aligns well with the available resources. Notably we found that effectiveness of the computing resources also depends on the specific task, dataset characteristics, and training strategy. In summary, the available computing resources, choice of Efficient-Net model and the small size of dataset made the favorable conditions for training process.
-
A. Modeling with EfficientNet Deep Learning Architecture
Input: labeled image data set as Z= {xt/yt }
Output: Blood group prediction
-
1. Let I ^ input image with shape (32, 32, 3)
-
2. lorn vi ^ Conv2D (I, 32) = (32, 32, 32)
-
3. I normi ^ BatchNorm2D (Icon vi )
-
4. for (i =1 to 15),
-
4.1 Let f t = activation function for i t block
-
4.2 Let St be the output of the i h block
-
4.3 S tcomn ^ Conv2D (S t-i , 32) = S t-i
-
4.4 St™ — BatchNormID (Si convl )
-
4.5 S t act — f t ( S t norml )
-
4.6 St ex — SqueezeExcitation (St ct)
-
-
4. 7 SZ X™2 ' Conv2D ( St sqex , 16) = (3 2, 32, 16).
-
4.8 St .orm2 - Batc h Norm 2D ( St co^2 )
-
4.9 end for
-
-
5. let S15 be the output of 15th block with shape (1, 320, 2, 2).
-
6. Spool — Adaptive AvgPool2D (S 15 )
-
7. S f lat — Flatten ( Spool) of size (1, 320, 1,1)
-
8. Sltnear — Linear (Sf iat )
-
9. returns result
Data preprocessing is a critical step before training a deep learning model. In this context, input sample images are first resized to a dimension of 32x32 pixels. Following this resizing, the resulting image is transposed using the order (2, 0, 1). The preprocessed input image, denoted as “I”, has a shape of (32, 32, 3), representing a 32x32 image with 3 color channels (RGB). A Convolutional Layer with 32 filters of size 3×3 is applied to the input image “I”, which is further given to activation function ReLU with learning parameter α = 0.001. The output shape of this Convolutional Layer is (32, 32, 32), denoted as “I_conv1”. Normalization on batch size of 32 is applied to the output of the Convolutional Layer “I_conv1”. The normalized output is denoted as “I_norm1”. In the next stage, algorithm iterates through 15 blocks, each containing the following operations:
-
i. Convolutional Layer 1 within the block: Same as the input of the block.
-
ii. Batch Normalization after Conv1.
-
iii. Activation function, sigmoid (specified by f_i) applied to the normalized output.
-
iv. Squeeze-and-Excitation (SE) operation applied to the activated output
-
v. Convolutional Layer 2 within the block with 16 filters of size 3×3.
-
vi. Batch Normalization of size after Conv2.
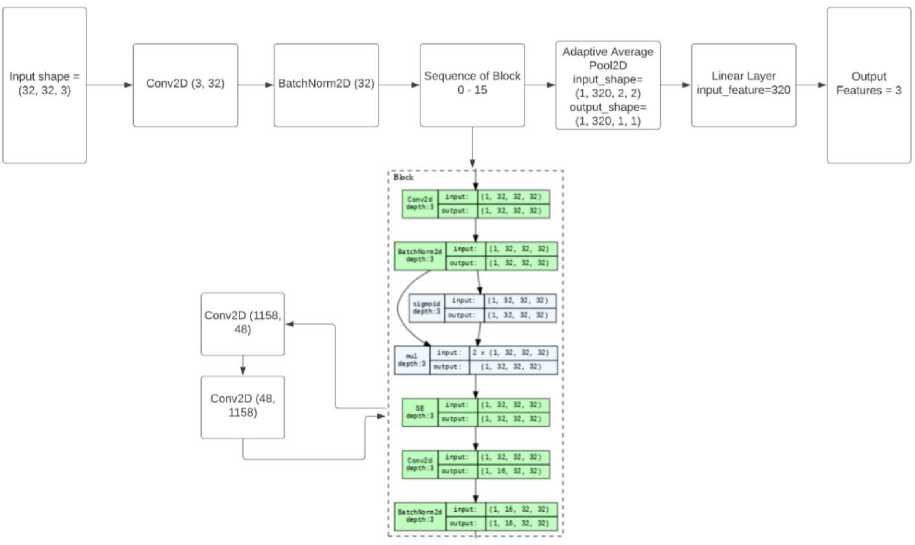
Fig. 8. Optimized EfficientNet Architecture
This research work is an attempt to predict the blood group of persons by using the proposed deep learning approach.
381t [00:04. 9.20it/S]
loss: 0.1589, Accuracy: 89.33
Epoch 8 of 18, Training
381t (60:03. 9.81it/s]
loss: 0.2050, Accuracy: 81.33
Epoch 9 Of 18.
Training
38it (00:03. 9.70it/s]
Loss: 0,1151, Accuracy: 89.33
Epoch 10 of 10.
Training
381t [00:03, 9.86it/S]
Loss: 0.1312, Accuracy: 88.00 0.635 minutes
Fig. 9. Training Accuracy of EfficientNet
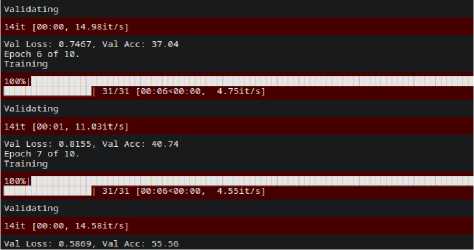
Fig. 10. Validation Accuracy of EfficientNet
The optimized Efficient-Net model performance is evaluated on the four blood group images of input dataset. During performance evaluation, the optimized Efficient-Net architecture was evaluated in terms of training accuracy and validation accuracy. We observed that Efficient-Net outperforms with 84.54% for training dataset. We found the variation in the randomized accuracy of a model for validation data and performed poor with accuracy of 55.56 %.
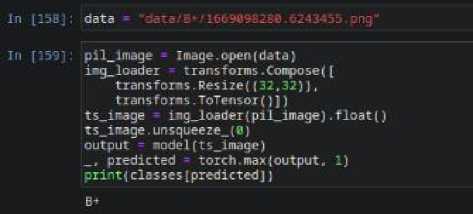
ts_image img_loader(pilimage).float()
ts_image.unsqueeze.(0) output model(ts_image)
predicted torch.i*ax(output, 1)
print(classes[predicted])
Of
Fig. 12. Models Prediction for O+ Sample
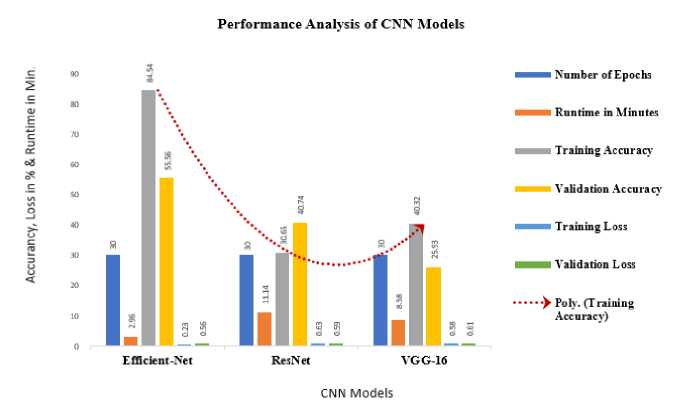
Fig. 13 Model Accuracy, Loss and Run Time for CNN model and Optimized Efficient-Net Model
The efficacy of Res-Net and VGG-16 is compared with proposed optimized Efficient-Net CNN model based on the execution time, validation accuracy and loss parameters. The Table 4. shows the performance analysis statistics of VGG and ResNet model with the optimized Efficient-Net CNN model.
Table 4. The Comparative Statistics of Selected CNN Models with Optimized Efficient-Net Model
|
The Comparative Statistics of Selected CNN Models with Optimized Efficient-Net Model |
||||
|
Classifier |
No. of Epoch |
Run Time in Min. |
Validation Accuracy in % |
Validation Loss in % |
|
Efficient Net |
30 |
2.96 |
55.56 |
56.68 |
|
Res-Net |
30 |
11.14 |
40.74 |
59.73 |
|
VGG-16 |
30 |
8.58 |
25.93 |
61.62 |
All the models are tested with 30 epochs. Run time column represents the time took, in minutes, to train each respective model. The "Efficient Net" model took the least time to train, with a runtime of 2.96 minutes. The "Res-Net" model took more time, 11.14 minutes, and the "VGG-16" model took 8.58 minutes. Validation accuracy indicates how well the model performs on unseen data. The "Efficient Net" model achieved the highest validation accuracy at 55.56%. The "Res-Net" model had a validation accuracy of 40.74%, and the "VGG-16" model had the lowest validation accuracy at 25.93%. Validation loss is a measure of how well the model's predictions match the actual ground truth labels on the validation data. Lower validation loss indicates better performance. The "Efficient Net" model had a validation loss of 56.68%, the "Res-Net" model had a validation loss of 59.73%, and the "VGG-16" model had the highest validation loss at 61.62%. Based on the Table 4, it's evident that the "Efficient Net" model outperformed the other models in terms of both validation accuracy and validation loss. It achieved the highest accuracy and the lowest loss among the three models, despite having the shortest training time. In blood group prediction tasks, various state-of-the-art deep learning models can be utilized to achieve accurate and reliable results. Some of the relevant models commonly employed are DenseNet, CapsNets, GNN’s, and Visual Transformer model. DenseNet architectures connect each layer to every other layer in a feedforward fashion. This dense connectivity helps in feature reuse and gradient flow, leading to improved learning and performance, which could be advantageous in blood group prediction tasks. CapsNets are a novel architecture that aims to address the limitations of CNNs in capturing hierarchical relationships among features. They might be relevant for tasks involving complex spatial structures like blood cell arrangements. GNNs are used when data can be represented as graphs, such as in blood group networks where blood groups interact with each other. GNNs capture relational information and have wide range of applications. Visual transformer model is based on the idea of using the transformer architecture, originally developed for natural language processing tasks, for processing and understanding visual data, such as images. These models can be adapted and fine-tuned for blood group prediction tasks depending on the data type, task complexity, and available resources. Each model brings its unique strengths to the table, and the choice of model depends on the specific characteristics of the data and the task requirements.
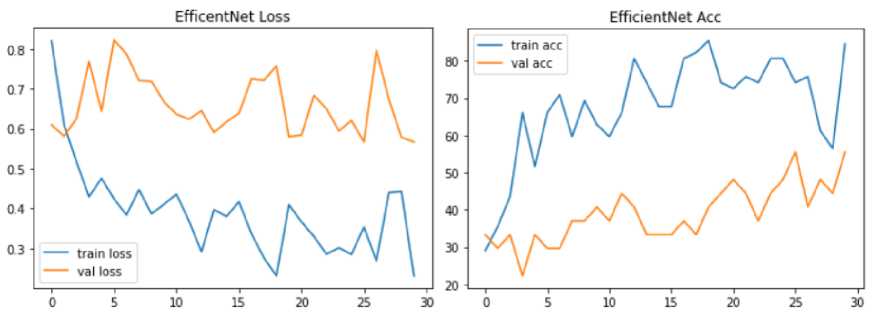
Fig. 14. Model Loss and Accuracy Graph of Optimized Efficient-Net Model
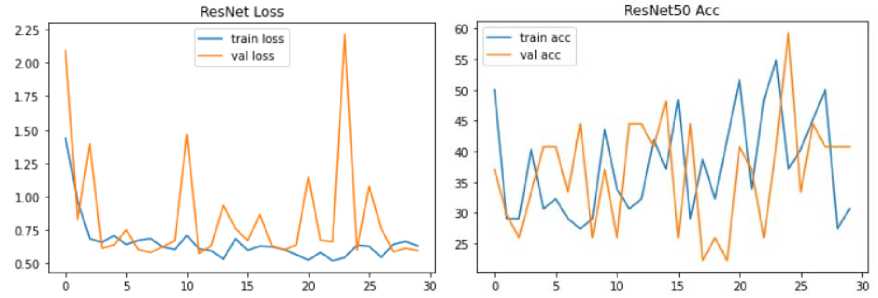
Fig. 15. Model Loss and Accuracy Graph of Res-Net Model
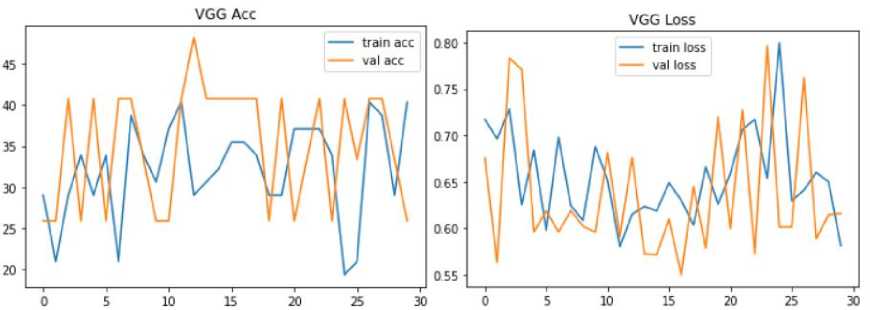
Fig. 16. Model Loss and Accuracy Graph of VGG Model
Fig. 15. shows the model accuracy and loss graph for Res-Net with 40.74 % validation accuracy and 30.65 % training accuracy. However, the model has 59.73 % validation and 63.26% training loss.
Fig.16. shows model accuracy and loss graph of VGG. The VGG has 25.93 % validation accuracy and 40.32 % raining accuracy. However, the model has 61.62 % validation and 58.16% training loss respectively. Accuracy serves as a measure to assess the usefulness of the classifier. It indicates the proportion of correctly predicted instances out of the total number of instances. Precision and recall are important evaluation metrics that provide insights into the model's performance for positive predictions. Precision quantifies the proportion of correctly predicted positive instances out of all positive predictions made by the classifier. Recall, on the other hand, measures the ability of the model to correctly predict positive instances out of all the actual positive instances. It is important to note that neither precision nor recall alone can fully determine the efficiency of the model. Both metrics need to be considered together to get a comprehensive understanding of the model's performance. Depending on the specific application and requirements, different trade-offs between precision and recall may be acceptable. F1-Score can best define both the concerns. It is ultimately the harmonic mean of recall and accuracy. These performance measures are determined using following Equation (1), (2) and (3):
True Positive Precision =
True Positive + False Positive
True Positive
Recall =
True Positive+False Negative
Pr ecision * Re call
F1 - Score = 2 x---------------- Pr ecision + Re call
Precision, recall and F1-Score measures best describe the generalization ability of model and proficient to assess model’s generalization performance.
Table 5. The Precision, Recall and F-1 Score
|
The Precision, Recall and F-1 Score |
|||
|
Class |
Precision |
Recall |
F1-Score |
|
A+ |
0.33 |
0.35 |
0.33 |
|
B+ |
0.80 |
0.66 |
0.72 |
|
AB+ |
0.25 |
0.14 |
0.17 |
|
O+ |
0.90 |
0.69 |
0.78 |
6. Conclusion and Future Work
-
A. Conclusion
In conclusion, there is a global demand for an affordable blood group determination system, particularly in developing countries. The use of deep learning-based image processing has emerged as the dominant approach in both resource-rich and resource-constrained medical applications, making it a suitable choice for implementing the proposed system. The proposed system incorporates the best practices in data collection techniques, input image acquisition processes and use of a rich deep learning architecture. It is designed to be cost-effective, compact, and customizable, making it affordable for commercial use. The system provides fast results, which is crucial, especially in medical emergencies requiring blood transfusion. However, it is important to note that the deep learning algorithm's performance exhibits a discrepancy between the training accuracy and validation accuracy due to the limited size of the sample. Although the proposed system demonstrates validation accuracy for blood types A+, B+, O+, and AB+ but it may not be a comprehensive solution for all blood types within the ABO system. In summary, the proposed non-invasive blood group determination system holds potential for addressing the need for affordable and efficient blood group prediction. It has the capacity to play a vital role in medical emergencies and contribute to improved healthcare outcomes.
-
B. Future Work
In future research, the proposed system can be enhanced by exploring the utilization of other state-of-the-art deep learning architectures such as DenseNet, ResNet-50, Yolo, RCNN, GAN and Visual Transformer. These architectures have shown promising results in various computer vision tasks and may contribute to improving the validation accuracy of the blood group prediction. Expanding the dataset with a larger number of samples for each blood group type is essential. Collecting large number of data samples for each blood group would provide a more comprehensive and diverse dataset for training the deep learning model. This increased dataset size can help address the limitations of the current system, which performed poorly in terms of validation accuracy due to inadequate sample size. Further research and development efforts are encouraged to enhance the system's accuracy and expand its applicability to a wider range of blood types. For future research, we suggest the use data augmentation in case of less or moderate data size which was not incorporated in proposed system.
References Non-Invasive Blood Group Prediction Using Optimized EfficientNet Architecture: A Systematic Approach
- Bhagat, Swarupa Nikhil, et al. "Comparison between conventional and automated techniques for blood grouping and cross matching: experience from a tertiary care centre." Journal of laboratory physicians 7.02 (2015): 096-102.
- Mujahid, Adnan, and Franz L. Dickert. (2015), Blood group typing: from classical strategies to the application of synthetic antibodies generated by molecular imprinting Sensors 16, no. 1, PP: 51.
- Bharadwaja A., Saraswat P.K., Agrawal S.K., Banerji P., Bharadwaj S. Pattern of fingerprints in different ABO blood groups. Journal of Forensic medicine & Toxicology, 2004; 21(2): 49-52.
- Dean L. Blood Groups and Red Cell Antigens [Internet]. Bethesda (MD): National Center for Biotechnology Information (US); 2005. Chapter 2, Blood group antigens are surface markers on the red blood cell membrane. Available from: https://www.ncbi.nlm.nih.gov/books/NBK2264/
- Bai Y, Yang K, Yu W, Xu C, Ma WY, Zhao T. Automatic image dataset construction from click-through logs using deep neural network. In Proceedings of the 23rd ACM international conference on Multimedia 2015 Oct 13 (pp. 441-450).
- Dean L. Blood Groups and Red Cell Antigens [Internet]. Bethesda (MD): National Center for Biotechnology Information (US); 2005. Chapter 2, Blood group antigens are surface markers on the red blood cell membrane. Available from: https://www.ncbi.nlm.nih.gov/books/NBK2264/
- Gayathri, Thozhuthungal Haridasan, M. Rekha, Naizathul Akmha and K. Nithyakalyani. “Non Invasive Blood Group Detection Using Light Emitting Diode.” International Journal of Pure and Applied Mathematics Volume 119, No.15 (2018) 565-574.
- Gaurav S. Mehare1, Chetan G. Pinjarkar2, Anup V. Tembhe3, Prof. Nitin S. Khachane4 “A Non-invasive Way to Determine Blood Type Based on Image Processing” International Research Journal of Engineering and Technology (IRJET), Volume: 05 Issue: 04 | Apr-2018.
- Immaculate Stefi, Dr. Manasa Ravindra Walmiki and Pallavi. K “A Literature Survey on Non Invasive Blood Group Detection” International Research Journal of Education and Technology, Vlo 04, Issue01, January 2022.
- Panjivarna B, Saranya P, Anitha S, “Noninvasive Blood Group Detection”, Journal of Emerging Technologies and Innovative Research, May 2019 Vol: 6, Issue:5
- Bhuvaneswari K, Visithra M, Deepa S K "IoT Based Non-Invasive Approach for Blood Group Detection using Led, International Journal of Engineering Research & Technology (IJERT) ISSN: 2278-0181 Published by, www.ijert.org ETEDM - 2021 Conference Proceedings.
- Raj Bhagat, Snehal Marge, Prathamesh Deshmukh, Siddhesh Khanvilkar” Automatic Detection of Human Blood Group System using Deep Learning and Image Processing” International Research Journal of Engineering and Technology (IRJET), Volume: 08 Issue: 04 | Apr 2021.
- Balaji B, Jeyasakthi R, Julius, Fusic S, Rishwana M, Swathilakshmi P R K, Reshma K K "A novel approach of classifying ABO blood group image dataset using deep learning algorithm," 2021 International Conference on Computational Performance Evaluation (ComPE), 2021, pp.393-398, doi: 10.1109/ComPE53109.2021.9752278.
- G. Ravindran, T. Joby, M. Pravin, and P. Pandiyan, “Determination and Classification of Blood Types using Image Processing Techniques,” International Journal of Computer Applications, vol. 157, no. 1, pp. 12–16, Jan. 2017S.-H.
- Edward jaywalg; William li; Doug Hawkins; Terry Gernsheimer, Colette Norvy-Slycord, Shwetak N. Patel, Hema “Noninvasive Blood Screening of Haemoglobin using Smartphone cameras, (2016)”
- Vijay Kumar Patil, D. R. Ingle “Novel Approach for ABO Blood Group Prediction using Fingerprint through Optimized Convolutional Neural Network” International Journal of Intelligent Systems and Applications in Engineering, IJISAE, 2022, 10(1), 60–68
- Priyadharshini.R, “A Novel Approach in Identification of Blood Group Using Laser Technology,” International Journal of Research in Engineering and Technology (IJRET), vol.3, issue 11, pp 20-24, June 2014.
- https://www.waynesword.net/aniblood.htmhttps://www.brainkart.com/Article/ABOBloodGroup_21871/ [Last Accessed on October, 2022]
- https://www.brainkart.com/article/ABO-Blood-Group_21871 [Last Accessed on October, 2022]
- D. K. Dewangan and S. P. Sahu, "Deep Learning-Based Speed Bump Detection Model for Intelligent Vehicle System Using Raspberry Pi," in IEEE Sensors Journal, vol. 21, no. 3, pp. 3570-3578, 1 Feb.1, 2021, doi: 10.1109/JSEN.2020.3027097.
- Dewangan, D.K., Sahu, S.P., Sairam, B. et al. VLDNet: Vision-based Lane region detection network for intelligent vehicle system using semantic segmentation. Computing 103, 2867–2892 (2021). https://doi.org/10.1007/s00607-021-00974-2
- https://www.blood.co.uk/why-give-blood/blood-types [Last Accessed on October, 2022]
