Nondestructive testing method based on the spin polarization effect template

Author: Bryakin I.V., Bochkarev I.V., Khramshin V.R.
Journal: Вестник Южно-Уральского государственного университета. Серия: Энергетика @vestnik-susu-power
Section: Электроэнергетика
Article in issue: 2 т.20, 2020.
Free access
This paper proposes a novel nondestructive testing method for electrically conductive objects. It is based on applying a fundamentally new physical effect which has not been used before in nondestructive testing systems. The method utilizes spin polarization phenomena that occur when free electrons of conductive materials are exposed to an alternating electric field. Researchers experimented with wire and cable conductors. A tested cable was moving longitudinally and exposed to an alternating electric field, which excited a waveform process, i.e. the polarization of spin magnetic moments of free electrons. An induction sensor registered this process and generated a control signal: induction EMF. Its parameters were compared against that of a reference signal obtained in advance in the same way utilizing spin polarization phenomena. Parametric deviations were then used to detect and classify conductor defects. The paper describes how to generate a reference signal appropriate for the objectives of testing. The developed method enables nondestructive testing of objects made of any conductive para- and diamagnetic materials, while it accuracy and reliability are not affected by the magnitude or evenness of the object movement speed, nor by vibrations or transverse oscillations against the physical field source or the induction sensor.
Nondestructive testing, electrically conductive elements, electric cable, feedthrough two-electrode cylindrical capacitor with a concentrated capacity, induction sensor, intrinsic angular momentum (spin) of an electron, spin magnetic moment, resonance polarization frequency of the spin magnetic moments of free electrons
Short address: https://sciup.org/147234053
IDR: 147234053 | UDC: 620.179.14 | DOI: 10.14529/power200205
Метод неразрушающего контроля на основе спин-поляризационного эффекта
Предложен новый метод неразрушающего контроля электропроводящих объектов. Он основан на применении принципиально нового, не используемого ранее в системах неразрушающего контроля физического эффекта. Для реализации этого метода используются спин-поляризационные явления, возникающие при воздействии переменного электрического поля на свободные электроны электропроводящих материалов. В качестве объекта контроля в статье рассмотрены электропроводящие элементы электрических проводов и кабелей. На продольно перемещающийся контролируемый кабель воздействуют направленным переменным электрическим полем, которым в электропроводящих элементах кабеля возбуждают волновой физический процесс в виде поляризации спиновых магнитных моментов свободных электронов. Индукционным датчиком регистрируют этот процесс и формируют контрольный сигнал в виде ЭДС индукции. Параметры контрольного сигнала сравнивают с параметрами опорного сигнала, полученного заранее аналогичным образом с применением спин-поляризационных явлений. Наличие и вид дефекта электропроводящих элементов определяют по полученным отклонениям указанных параметров. Описан процесс формирования опорного сигнала в зависимости от поставленных целей контроля. Разработанный метод обеспечивает возможность проведения неразрушающего контроля объектов из любых электропроводящих пара- и диамагнитных материалов, причем точность и надежность контроля не зависит от величины и равномерности скорости перемещения объекта контроля, а также от вибрации и его поперечных колебаний относительно источника физического поля и индукционного датчика.
Text of the scientific article Nondestructive testing method based on the spin polarization effect template
The defects that were not found during the manufacturing process and quality control of their constituent elements are, as a rule, the cause of premature failure of various technical objects. Therefore, it is necessary to test these elements, both for their geometric parameters and the quality of the material from which they are made – its structure, chemical composition, nature and distribution of possible internal and surface defects, etc. It is obvious that nondestructive testing (NDT) of materials and products is of the greatest practical interest, which allows to conduct fault location of the studied objects to confirm their structural integrity without causing damage, deterioration of serviceability, violation of the objects integrity, or temporary disabling.
Currently, quantitative nondestructive assessment has become an important tool for modern technology both at the stage of its production and during operation throughout its life cycle. NDT allows checking the components' quality, thereby preventing the further use of defective products, and thus preventing possible accidents and disasters. NDT is particularly important for the inspection of critical facilities and components, the failure of which can lead to serious and even tragic consequences. Therefore, the require- ments of advanced nondestructive testing and facility integrity assessment are very important for production processes and maintenance. In this regard, there is a constant heightened interest in the development of effective and highly informative, fully automated nondestructive testing methods.
Let's choose electrical wires and cables forming the basis of any power supply system as the tested object (TO). Of course, it includes a large number of different elements, the performance of each of which affects the performance of the entire system as a whole, and, accordingly, it requires a comprehensive assessment and use of various measures to ensure high performance of all elements of the power supply system [1, 2]. However, experience shows that a key factor in the event of an emergency or power failure is often a faulty electrical cable.
It is obvious that the quality and operating parameters of the electric cable must be checked before it is laid. It will help avoid quick cable failures and unnecessary power outages in case of poor cable quality. This is especially true when it comes to underground cable lines. They are, of course, less vulnerable to weather effects and mechanical damage, unlike overhead power lines. However, it takes much longer to complete repairs than it is the case with overhead power lines, as not only is it harder to determine the exact location of the damage, but laborious excavation work is also required to open the trench afterwards. Therefore, the development of new methods and devices to monitor the technical condition of electrically conductive elements of an electrical cable or wire during the manufacturing process, as well as immediately prior to its installation, e.g. during unwinding from a reel, is of great relevance. The latter is explained by the fact that the conditions under which cable-conductor products are transported and stored are not always ideal, so defects resulting in a decrease in its performance may appear. Without reliable control of the initial performance characteristics of cables and wires, it is therefore impossible to improve the reliability of the power supply system. This will increase the cost and duration of work, though slightly. But the use of a defected cable during installation will inevitably lead to fundamentally high costs due to power failure, search for the damaged area, removal and repair of the damaged section, etc. It is therefore clear that additional control of the cable prior to its laying will pay off in full with the guaranteed exception of emergencies.
The analysis has shown that known diagnostic systems of cable and wire products are generally aimed at monitoring its insulation. Despite the fact that the insulation is the most vulnerable element of the cable, its main function is performed by electrically conductive elements. Therefore, the activities devoted to the development of new systems for diagnosing the technical condition of these basic elements of the electric cable are very relevant and have practical value.
Analysis of Well-Known Electrical Cable Fault Location Methods
The existing methods and means of NDT of conductive elements of wires and cables are aimed at solving the following tasks: testing geometric parameters, search for defects in the form of the material discontinuity, evaluation of the material's structure, evaluation of physical and mechanical properties of the material.
Currently, a sufficiently large number of different methods and devices for monitoring the parameters of electric cables during their manufacturing process [3–6] have been developed. The necessity of conducting nondestructive diagnostics of the cable, which is done without deterioration of its performance and without violating the technology of its production process is obvious.
In fact, all types of NDT currently used can be divided into three main groups: 1 - based on the interaction of electromagnetic fields and elementary particles with the tested objects; 2 - based on the use of acoustic fields, 3 - based on the interaction of penetrating substances with the tested objects. The basis of each group is a certain physical effect (PE) which re- flects the regularity of manifestation of the results of the interaction of material objects, performed through physical fields. In this case, consistency and repeatability in interaction identity characterize the pattern of manifestation.
In turn, the NDT methods, forming the three above-mentioned main groups, are divided into the following types, depending on their physical effects: optical (visual-optical); acoustic; vibroacoustic; with penetrating substances (e.g. capillary); magnetic; radiation; radio waves; Thermal; electric; eddy currents (or electromagnetic) [7, 8]. It should be noted that, in principle, one of these methods of locating faults could be used in cable control. However, visual-optical, thermal, acoustic, electromagnetic, and induction-thermographic methods of control are most widely used.
Let’s consider the main characteristics of the above-mentioned fault location methods.
-
• Visual-optical inspection methods are among the cheapest, fastest, and, at the same time, quite informative NTD methods. This is a basic method that usually precedes all other fault location methods. It is used for external inspection and is designed to detect visible defects (breaks, dents, burns, influxes, etc.). Such inspection can be performed with the simplest measuring tools, including the naked eye or visual-optical devices. Due to their simplicity, optical measurements play an important role in industrial production. It is obvious that visual inspection fails to detect the defects that are in the subsurface layer or in the depth of TO. At the same time, optical flaw detection methods are widely used to control the diameter and ovality of the outer shell of electrical cable conductors and to measure the current carrying conductor's displacement relative to the center of an insulating material [9]. These methods can be used to monitor the operating parameters of the cable, such as its frequency and transmittance properties, as well as the consumption of insulating materials. To implement visual-optical inspection methods, it is possible not only to use direct visual observation of cable quality by staff (manual optical control), but also to use computer vision-based intelligent control [10–12]. The disadvantage of the visual and optical fault location methods is that their use in implementing full control of parameters of electrically conductive electrical cable elements is significantly limited.
-
• Thermal fault location methods are used in laboratory and workshop conditions to control local inhomogeneities and conductive wire quality [13–15]. They are based on recording processes that occur when passing electrical pulses through a controlled wire section. Electrical resistance increases in the defect area, e.g. in the presence of defects such as cavity, cracks, dissimilarity or violation of the wire structure, which leads to a local increase in temperature on the wire surface in the defect area. When recording the product's temperature field, defects, both external
and internal, are judged to be present. The optimum pulse duration and frequency depend on the wire thickness, while the temperature is controlled by a non-contact pyrometric sensor or any other thermographic system. Thermal flaw detection not only allows detection of a defect (quality thermography), but also enables location of fault parameters, such as size, position, etc. (quantitative thermography) [16].
The general inappropriations of these methods include a low detection reliability of defects in conducting cable elements due to the instability of thermal relief during the reproduction of the defective wire section image and considerable thermal defectoscopy inertia due to thermal process inertia.
-
• Acoustic nondestructive testing methods are based on the parameters of elastic vibrations being recorded in their interaction with a tested item [17, 18]. Acoustic signals are reflected in the control process from the material's defects and inhomogeneities, and their amplitude-time characteristics (arrival time, propagation velocity, and acoustic wave shape) are used to evaluate the quality of a test product [19]. These acoustic signals are recorded by appropriate sensors, usually in contact with the diagnosed wire surface [7]. This method allows mechanical parameters of electrically conducting elements of a cable (cracks, breaks, delaminations) to be revealed, and it is also applied for its structural analysis. The disadvantages of this method include the difficulty of its practical use in manufacturing or laying a long cable and the low accuracy of determining the location of a defect. Moreover, it does not allow monitoring an electrical cable's technical condition in a wide range of monitored parameters.
-
• Electromagnetic eddy current methods are one of the main methods for the fault location of electrically conductive cable elements [7, 20, 21]. They are based on the analysis of the interaction of a primary electromagnetic field created by the eddy current transducer with the secondary electromagnetic field created by eddy currents induced in the cable's conductive elements by a primary field. The nature of eddy currents and, accordingly, the secondary electromagnetic field depend on the parameters of a cable's conductive element. The secondary field affects the transducer's coils by either inducing an EMF (using transformer-type eddy current transducers) or altering its impedance (using parametric transducers). By recording and processing these parameters, they obtain cable properties information [22, 23]. The evaluation of the detected defect parameters is usually performed by comparing the measured defect and standard signals. For example, when a defect appears in the transducer zone, the distribution of eddy currents occurs, the magnetic field of which induces an electrical signal in the transducer measuring winding which parameters can be used to monitor the local physicochemical properties of the wire in the control zone, as well as defects located on the surface or in
the subsurface layer. Eddy current testing allows nondestructive testing of the cable's conductive elements at high speeds and does not require cable-sensor contact [7]. The depth of penetration of the electromagnetic field into the metal is, however, insignificant due to the skin effect, which makes it impossible to detect defects in diamagnetic materials such as copper at a depth of more than 6–8 mm (0.2–0.3 in). Parameters of movement of the tested item such as the magnitude of the speed of movement, uniformity of movement, possible transverse oscillations and arising vibrations, deviation of the orientation of the movement of the tested item from a plane perpendicular to a magnetic field will significantly affect the magnitude of induced eddy currents and, consequently, the accuracy of testing and sensitivity of eddy current methods. In addition, it is possible to ascertain, taking into account the remarks made, that the test methods given are rather difficult to be used for the diagnosis of electrical cables with multicore non-magnetic metal elements that essentially narrow down their scope of application.
-
• Induction thermography (pulsed eddy current thermography), unlike eddy currents testing, has both electromagnetic and thermal aspects and can be used for nondestructive testing of conductive materials [7, 24, 25]. The monitoring in induction thermography is based on electromagnetic and thermal interaction with the defect. In the tested object, eddy currents that generate heat are induced. For testing lengthy objects (wires, pipes, steel rods), ring coils are used. The presence of defects causes local changes in the electric current density of the material due to which a characteristic thermal pattern, that is fixed by the infrared radiation detector and allows detecting the position and parameters of the defect, will be formed on the surface.
The main disadvantage of this nondestructive testing method is that it allows to detect only shallow subsurface defects. Since the temperature change is determined by the ratio of the heat penetration depth to the penetration depth of electromagnetic radiation, the thermal response to inductive heating strongly depends on the material of the tested object. The greatest efficiency takes place for ferromagnetic materials. For example, aluminum alloys have an efficiency of about 30 times lower than that of magnetic steel [7, 26]. This makes it difficult to test electrical cables with this method. This method allows to detect defects in the conductive cable elements under non-conductive coating [27]. However, the effectiveness of the control depends on the extent of how thermally thin this coating is. In addition, this control method can be used only for small diameter wires in which the surface effect will not be manifested.
-
• For electrical cables containing steel conductors, armor coatings, electromagnetic shields, the authors have developed a modified fault location method which has increased accuracy in detecting defects in these ferromagnetic elements [28, 29]. This fault loca-
tion method implies that the monitored cable and the reference cable (without defects) are simultaneously affected by a physical field consisting of alternating electric and permanent magnetic fields. In this case, the magneto-electric and magneto-modulation effects, which are used to, respectively, form the measuring signal in the monitored cable and the reference signal in the reference cable are excited in the ferromagnetic elements of both cables. These signals are compared and the parameters of the comparison result indicate the presence of defects in the cable. The disadvantage of this flaw detection method is its limited scope since this modified fault location method is focused on the structural elements of the cable made only of ferromagnetic materials and does not allow for monitoring the parameters of the conductive elements of the cable made of non-magnetic materials.
The analysis of the known NDT methods of defects in electrical cables has shown that each of them has certain disadvantages caused by those PE that are implemented in them and which determine the properties and capabilities of each method. Summarizing, it can be stated that the existing technological and structural possibilities for increasing the efficiency of the known NDT methods are practically exhausted and have no prospects for further radical improvement. In this regard, it is necessary to develop the NDT methods based on new physical effects.
Justification of the New Electric Cable Fault Location Method
It is known that the registration of any parameter of the tested object is based on a specific physical effect which is manifested on the sensitive element of the corresponding measuring sensor (MS). In this case, the MS practically performs the primary conversion of the corresponding characteristics of the field or material made by the measured parameter of the TO in the measurement information signal (electrical in the overwhelming number of cases) convenient for solving the measurement task.
In accordance with the MS classification, which is based on the type of a measured value of the physical field used for the primary conversion, Fig. 1 illustrates the measuring conversion represented by the diagram in its most general form.
The structural elements of this diagram are the source of the physical field, TO, and MS. Generally, there can be an intermediate medium, i.e. medium of spreading of the physical field, between the TO, the source of the physical field, and the MS performing the primary measuring conversion. The measured parameter of the TO affects either the characteristics of the physical field (for example, its spatial distribution or intensity at any point in space) or the characteristics of the object material in this physical field.
Mutual relations of the source of the physical field, the tested object, and the measuring conversion illustrated in Fig. 1 are generally two-sided in nature, that is determined by the fact that the source of the physical field in general affects not only the tested object, but also directly the primary transducer. Moreover, the source of the physical field is often the transducer itself. In some cases, the tested object may itself affect the source of the physical field, for example, change the intensity or spreading direction of the excited physical field.
The presented structural diagram allows us to formulate the following list of questions that should be considered when studying the physical foundations of the primary measuring conversions: 1 - physical effects underlying sources of physical fields; 2 - physical quantities characterizing the physical field and the properties of materials and objects in a given physical field; 3 - physical effects and laws underlying the interaction of the physical field with the environment, the characteristics of materials and objects in the physical field; 4 - physical effects underlying
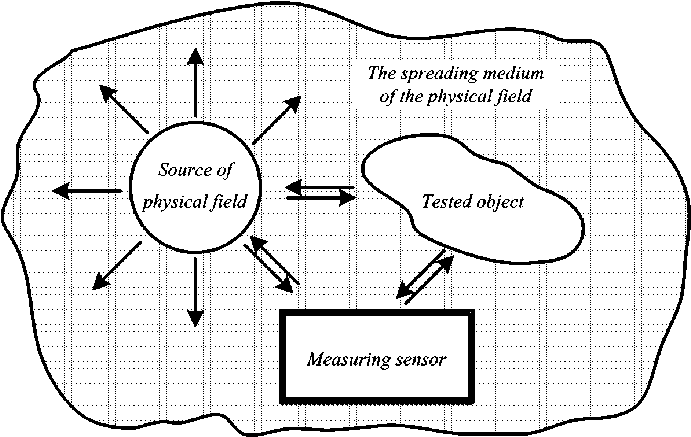
Fig. 1. The generalized diagram of the measuring conversion
the direct and reverse conversions of the characteristics of physical fields, characteristics of materials and objects into an electrical signal.
For a more detailed analysis of the PE, which can become the physical basis of the new NDT methods, we will use the elements of the PE theory which will significantly simplify the problem of choosing a technical solution for the range of tasks under consideration.
The functioning of any technical system is based on the manifestation of certain PE. The set of interconnected PE forms the physical basis of the technical system, i.e. the NDT system for fault location tasks in our case.
It is known that the manifestation of PE is made in three stages: the initial stage associated with the influence application; steady manifestation of the influence result; the final stage associated with the influence removal. This manifestation of PE is based on the following reasons:
-
1 – the reaction to the influence from the physical object that can be manifested both in relation to external influences and in relation to the interactions between the PE, composing, for example, the physical basis of the technical system;
-
2 – the accumulation by the physical object of a certain part of the influence energy that manifests itself after the removal of the influence;
-
3 – the lead time of processes at the level of structural elements of the physical object.
In addition, PE can form certain groups according to the nature of the manifestation: 1) PE - conductors associated with the conductivity of a certain type of energy; 2) PE - modifiers associated with the modification of the influence result with respect to the influence without converting one type of energy into another; 3) PE - energy converters associated with the conversion of one type of energy into another; 4) PE - physical object converters associated with the conversion of the physical object that can be manifested by changes in the physical properties and structure; state of aggregation and composition of structural elements.
In this case, it should be borne in mind that TO (electrical cable) is a complex hierarchical system characterized by several structural elements and connections between them. The functioning of such objects is based on the manifestation of a multitude interconnected PE.
Taking into account that PE, as a rule, have several results of their influence and may depend on a number of additional influence parameters, it is possible to synthesize complex structures of interconnected PE that provide the realization of the tested object with several inputs and outputs, with feedbacks, using PE complexes for implementation of frequently occurring functions. The set of PE will be the physical scheme of the object (PSO), which gives an idea which of the specified input parameters of the tested object are converted into the given output parameters.
The elements of the PSO are the physical objects on which the PE is manifested. Relationships between elements of the PSO characterize the types of physical quantities conversions. By changing the number and composition of structural elements, the necessary results of this influence can be obtained with a given external influence. Since from one influence the PE can be manifested at different hierarchical levels of the object structure, internal influences that correlate with the results of external influences arise.
It should be noted that prior to the application of the exciting influence, the fields of the structural elements do not have external manifestation. Since the influence results in PE, as a rule, differ from each other, it is necessary to use the physical objects that contain structural elements corresponding to these influences to ensure interaction with an external influence. Therefore, the manifestation of PE, which transforms some physical fields into others, is determined by the presence of two types of structural elements as part of physical objects: interacting with external influence or with the physical field corresponding to the result of influence. In this case, the conversion itself of one physical field into another does not occur. There is only the transfer of energy of one physical field through the corresponding structural elements to other structural elements-carriers of another physical field, i.e. changes are made in the relationships between structural elements.
One can cite magnetically modulated EMF in probe-type magnetic-field failure detector resulting from the realization of an acousto-electromagnetic effect when acoustic waves interact with a magnetically ordered structure of ferromagnetic materials or a magnetoelectric effect in structures of composite ferromagnetic materials when exposed to an alternating electric field as an example.
The analysis of the PE used in the known NDT methods has shown that a property of the conduction electrons of crystalline structures such as the polarizability of their spin magnetic moments is not used to solve the fault location problems of nonferromagnetic metal elements when externally influenced to an alternating electric field.
It is known that any substance consists mainly of particles with spin. Traditionally, the Takabayashi-Bloch equation is used for particles with spin:
dS = — [ sh ]+— dt mc m
S -Ja s + 1( 5ap5 “ s ) l , (1) I p J
where е , m - the absolute value of the electron charge and mass respectively; с - the speed of light; S, H - spin vector and external magnetic field vector, respectively; p = у * у = |у| 2 - probability density of finding the material (point) particle at a given point in space at a given time; у - complex wave function.
Equation (1) shows that a change in the spin vector S occurs even in the case when the external field
H is absent, and external spin waves (spin circulators) can be the cause of the change in the spin vector. Thus, it follows from the Takabayashi-Bloch equation that the spin change in a substance can be triggered in three ways: 1 - by the external electromagnetic field, 2 - by changing density p , 3 - by the external spin field.
Based on the phenomenological theory of spin waves in substances, the spin wave in a chain of precessing atoms, resulting from an external field influence can be taken as an example (Fig. 2 а - side view, Fig. 2 b - top view).
Taking advantage of the considered elements of the PE theory and the phenomenological theory of spin waves, we can propose a new method of NDT of electroconductive materials of TO, based on the spin polarization effect of their conduction electrons.
For this purpose, based on the previously made analysis of possible influence mechanisms on TO and choosing the alternating electric field as the main external influence, it is proposed for this case the following version of the physical scheme of the NDT system (Fig. 3), where AEF - alternating electric field, influencing OT; NMC - non-ferromagnetic metallic conductor (tested object); CEL - conduction electrons of TO crystal lattice; LSCL and MSCL - the local and the main segments of the TO crystal lattice respectively; PE1 - physical effect which is manifested on the LSCL CEL; PE2 - physical effect which is manifested on the MSCL CEL; IS - induction sensor in the form of the measuring coil; PE3 - output physical effect.
-
Fig. 3 illustrates that the physical diagram of the NMC itself consists of two segments: 1 - LSCL directly influenced by AEF; 2 - MSCL located outside the zone of direct influence of the AEF and influenced by PE1 which is manifested in LSCL CEL. As a result of the interaction of PE 1 with MSCL CEL, PE 2 is formed.
From the analysis of the physical diagram of the TO, it follows that the necessary condition for the realization of the PE is the presence in the TO of structural elements such as free charge carriers which are, at the same time, the carriers of the electric field and the spin magnetic moment. For this case, such structural elements are the TO CEL.
Based on the considered physical diagrams, it is possible to propose a diagram of the physical basis of the NDT system for the fault location problems of an electric cable illustrated in Fig. 4, where MCC - the movement of charge carriers under the influence of AEF; AMF - alternating magnetic field; SC - spin circulation of LSCL CEL; WPSI - wave process of spin induction of MSCL CEL; EMFI - electromotive force of induction induced in the IS measuring coil and representing the output physical effect of PE3.
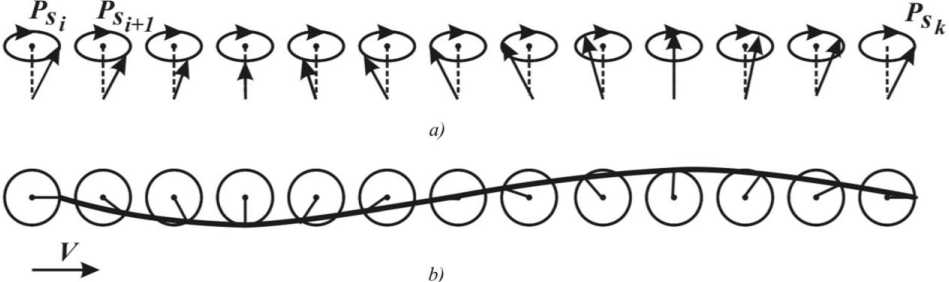
Fig. 2. The spin wave in a chain of precessing atoms
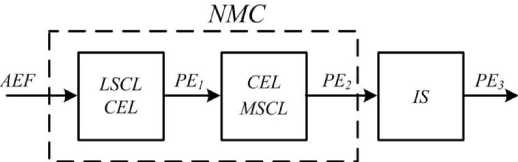
Fig. 3. Physical diagram of the NDT system
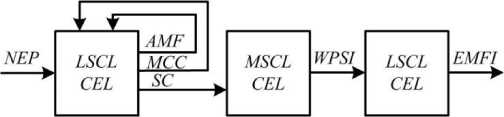
Fig. 4. Physical basis of the NDT system based on the spin-spin interaction
Excitatory AEF (external influence) predetermines the occurrence, interdependence, and close interaction between MCC and AMF in LSCL, which in their totality, being essentially internal influences, provide the appearance of PE 1 -modifier in the form of spin circulation of LSCL CEL in the excitation zone. In its turn, the PE1-modifier, acting on the MSCL CEL, excites the PE2-conductor in the form of evolving WPSI in the crystal structure of TO, that is outside the range of the AEF. In its turn, in the working area of the IS, the PE2-conductor in the form of evolving WPSI interacts with the CEL of the copper wire of the electrical winding of the IS itself, inside which the MSCL is located, and thereby exhibits a PE 3 -energy converter in the form of the EMF induction.
Taking into account the analysis of the physical basis of the possible NDT system variant, a new NDT method of conductive objects, which is based on the use of a fundamentally new physical effect, not specified in [7] – changing the intrinsic angular momentum of an electron in the external electric field, is proposed. This method, as will be shown below, broadens the range of the tested parameters and enhances the reliability of testing, which increases its informativeness and expands the scope of application. At the same time, practical implementation of the developed diagnostic method turns out to be rather simple.
Fig. 5 illustrates a schematic diagram of the implementation of the method developed to determine the location of the fault in the cable conductive elements [29].
Fig. 5 illustrates AEFF - alternating electric field former; IS – induction sensor; SPU – measuring signal processing unit; SCD – signal comparison device.
AEFF is made in the form of a cylindrical capacitor with a concentrated capacitance (spin capacitor SC) which consists of two semi-cylindrical metal electrodes located coaxially to controlled cable (Fig. 6 a ).
The IS induction sensor is made in the form of a cylindrical multilayer inductance coil with a coils turn in the axial direction located coaxially to the cable. Essentially, it is an induction transducer of passive type (Fig. 6 b ). To improve the accuracy of the IS, it must be positioned in a certain way relative to the AEFF. For this purpose, it is shifted to a distance L at which the stray fields of AEFF do not influence the operation of the IS (see Fig. 5). Experimentally, this distance is easily determined.
For the fault location purposes, an alternating voltage U~ must be applied to the electrodes of the spin capacitor SC (Fig. 6a). Thus, an alternating electric field E is created in the control zone be-~ tween the SC electrodes. If a cable is placed in this zone, a physical process of spin polarization of the free electrons magnetic moments will be excited in its electrically conducting elements, and this process occurs in both cable movement and motionless state. This process is recorded by the IS inductive sensor, which generates a measuring signal in the form of the EMF induction eism which parameters are determined by the parameters of the conductive cable elements in the area of the IS location. To confirm this statement, let us consider the physical processes that occur in non-magnetic electrically conductive elements when exposed to an electric field.
Traditionally, only one property of an electron is used to solve various kinds of electrical problems – its charge e . At the same time, an electron has one more property, a purely quantum-mechanical feature – its own angular momentum, or spin s . This intrinsic angular momentum can have two orientations relative to an external magnetic field directed conventionally along the axis z , in such a way that its two possible projections in the direction of this field will assume the following values [30]:
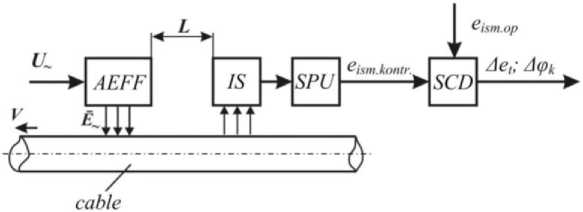
Fig. 5. Schematic diagram of the implementation of the method developed
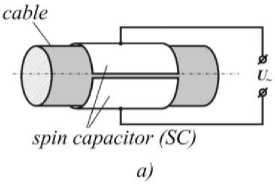
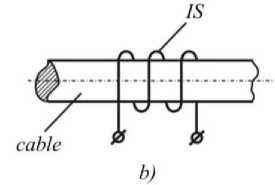
Fig. 6. Designs of AEFF ( a ) and IS ( b )
s z = ± h 4 n , (2)
where h – Plank constant.
The electron spin (1) corresponds to the spin magnetic moment:
ps = g s s , (3)
where g s =- e m – gyromagnetic ratio for the spin moment; e – absolute value of the electron charge; m – electron mass.
Let us demonstrate the possibility of using spin effects of the free electrons in non-magnetic metal conductors to control their physical properties.
It is known that the electric field has a force effect on the electric charge that is at rest or in motion. In fact, the electric field intensity E is a force that acts on a single electric charge
F = - e • E . (4)
Under the action of this force, the electron, which has charge e and a mass m, receives an acceleration that equals to a = e • E / m, (5)
and acquires additional speed A v during the time A t between collisions with the surfaces of the atoms.
Taking into account that λ is the distance traveled by an electron between two collisions and ν t.av is the electron velocity, the value of this time interval will be equal to
Δ t = λ / ν t.av . (6)
The higher the charge concentration per unit volume of metal n e , and the greater the charge e , and the higher the charge mobility µ e , i.e.
σ = n e · е · µ e , (7)
where µ e = Δ ν q /E ; Δ ν q = a ⋅ Δ t = Е ∙ е ∙λ/( m ∙ ν t.av ) – electron displacement velocity in the direction of the intensity vector of the electric field Е , the greater the conductor conductivity σ.
Given the latter, we can write:
σ = n e · e 2·λ/( m∙ ν t.av ), (8)
where е – electron charge equal to 1.6·10–19 C; n e = d ⋅ N A m A – the number of electrons per unit volume of the conductor (the density of conduction electrons); d – substance density; mA – atomic mass of the substance; N A – Avogadro number.
The analysis of the expression (8) shows that the conductor conductivity σ is an integral parameter that expresses the basic physical properties of the conductor material.
In the absence of an electric field, the free electrons in the metal are in chaotic thermal motion, i.e. have an evenly distributed orientation in space. Under the influence of the electric field (4), the chaotic motion of electrons is somewhat arranged in the conductor. It is manifested in the form of two main factors: first, the electrons begin to orientate themselves along the field during free travel, i.e. the direction of their motion trajectories becomes a common component along the electric field; second, electrons acquire some acceleration in the general direction along the field, increasing the speed, and thus their kinetic energy. It should be noted that this process occurs regardless of whether the controlled cable is moving or at rest.
When considering the second property of the electron (3), i.e. the spin magnetic moment, it is necessary to consider the fact that the electron acts like a rotating eddy ring the spin of which is oriented towards the electron's motion.
Under normal conditions, the spins of the free electrons with different orientation compensate each other. However, under the influence of an electric field all electrons unfold their axes in whatever position they are so that some common component of their spin projections is formed on the direction of the electric field intensity vector E = (0, E y ,0) :
eN
Psy =---N "^ (sn • ky X m n=1
where k y - unit vector coinciding with the direction of the electric field intensity vector; N = n e ⋅ V rab ⋅ χ s – effective number of free electrons in the working area Vrab of spin capacitors spins of which are oriented in the direction of a unit vector k y ; x s = | E y|/| E y . еД – spin polarization coefficient for a specific type of conductor material; E y – the value of the influencing electric field strength; | E y e | - the value of the electric field strength at which the maximum spin polarization of all the free electrons occurs in a unit volume of the conductor material in the direction of the unit vector k .
When the electrical voltage of the form U ~ = Um ·cos ω t (see Fig. 6 а ) is applied to the electrodes of the spin capacitor, a source of exciting monochromatic alternating electric field is created:
Е = E m • cos( ® t + ф E ). (10)
Under the influence of the alternating electric field (10) of a certain cyclic frequency ω = ω s (resonant frequency of spin interaction) in the volume of the conductive cable element enclosed in the working space V rab of the spin capacitor 3, oscillatory displacements of the free electrons are excited in the direction of the electric field intensity vector with a certain oscillatory speed:
AV q =-[ eE m cos( to s t + ф e ) dt =
m
e
=---- E m sm( ® s t + ф E ) = Av qm sm( ® s t + Ф E ), (11)
® s m
e where ∆ν = E – modulus of electron oscilla- qm m
®s m tory speed.
In this case, the spin magnetic moments of all the free electrons of the internal structure of the conductive element in the working space Vrab of the spin capacitor 3 are properly synchronized by the frequency of this electric field, i.e. receive the corresponding periodically changing uniform direction. In fact, the oscillatory electrons speed (11) leads to a periodic reorientation of the electron spins sn (n = 1 – N), which ultimately leads to the creation of a spin condenser in the working space Vrab of the corresponding ordered circulation of the total spin magnetic moment of the free conductor electrons. The existence of a similar spin circulation region leads to further successively induced spin polarization of the free electrons in the rest of the conductive material's structure.
It should be noted that the basis of this physical process is the spin-spin interaction, i.e. direct interaction of the spin magnetic moments of the free electrons, proportional to the multiplication of the spin magnetic moments and reversely proportional to the third degree of the distance between them [31]:
rection of the axis x , we make the following equation:
P s 2 =
e
—V--- E < m
• e
m
N
,"1“ s • N • £ ( s n . k x )
n = 1
X
X cos( “ s t + ф s ) = P s 2 m • cos( “ s t + ф s ), (16)
where P s 2 m =
-r — • E m • e "I” s -“ ° • N • £ ( s n . kx ) m n = 1
–
an amplitude value of the total spin magnetic moment of the free electrons in the working space V rab of the spin capacitor; “ 0 - cyclic frequency of the exciting electric field; to 5 - resonant cyclic frequency of spin polarization; p s 2 m ^ max at “ 0 = to s .
With the use of this harmonic oscillator (16), a spin induction wave process with a phase speed и = X • f along the axis x along the entire length of
p si p sj F sisj = —— r , r
where r = r i - r j ; r = | r |.
For example, for the two free electrons with the spin magnetic moments ц = g •^•s located at a distance r ij from each other, the energy of such an interaction can be determined by the formula [32]:
the conductive cable elements is excited. In this case, the process of excitation and spreading of a harmonic plane wave along the coordinate axis x is described by the equation of the form:
d 2 u 1 d 2 u
---1---— •---— a x 2 c 2 d t33
_2. 2
= g ц B g Г^
r ij
( s i s j ) - 3 •
( sr X s j r j )
, 2
ij
,
Taking into account formula (17) in the linear approximation for the spreading of the spin induction wave process, we can write:
where s i and s j – electron spin operators; g -factor-multiplier connecting the gyromagnetic ratio of the particle with the classical value of the gyromagne-tic ratio; ц В - Bohr magneton.
Thus, under the influence of an alternating electric field in the working area of the spin capacitor a special spin circulation area, which functions in harmonic oscillator mode with forced oscillations, is formed in the structure of the cable conductor.
For such a simple harmonic oscillator, we can write the next equation:
d 2 P
/-® 2 s " Ps = Q ( У , t ) , (14)
dt
d 2 B s ,2 d 2 B s d x 2 d t2
= 0.
The following analytical expression is the solution of the wave equation (18):
B s = B smCOs( “ s t - kx + ф B ) ,
where k = i • to w S a -ц a = 1 + i • 4 “ w -Ц a "^
–
spreading coefficient of the wave in the absence of magnetic losses, i.e. ц a = ц a - complex magnetic permeability of the conductor material; s a = s a - i a / “ - - i a / “ - complex dielectric perme
ability of the conductor material, i.e. at a >> “S a ;
e where Q(y, t) = -y---s • Em • sin(to0t + фE) - some
m function that characterizes distributed external influences; у - coefficient of AEF interaction with the spin magnetic moment.
Solving this inhomogeneous differential equation of the second order, taking into account the resonant mode of harmonic oscillator operation, we get the following formula:
P s = -Г — • s • E m • e |w s “ °l • cos( “ s t + ф s ) = m
= P sm • cos( “ s t + ф s )• (15)
In accordance with equations (9) and (15), for the ordered circulation of the total spin magnetic moment of the free electrons of the conductor in the di-
B sm = P s 2 m ' П е - an amplitude value of spin induction vector; n e = F ( E , a , “ ) - evolution coefficient of the spin induction wave process, reflecting the energy conversion efficiency of the harmonic oscillator into the wave process of the spin-spin field interaction; ю w - cyclic frequency of the spin induction wave process at which n = Птяv . e nmaA
In accordance with (19) for the spin induction flow, the following expression is true:
Ф s = B s S = S • B sm • cos( “ s t - kx + ф B ) , (20)
where S – an average cross section of the conductor.
The physical phenomenon under consideration is based on the fact that electrons, interacting with their spin magnetic moments with each other along the entire length of the conductive cable element, form
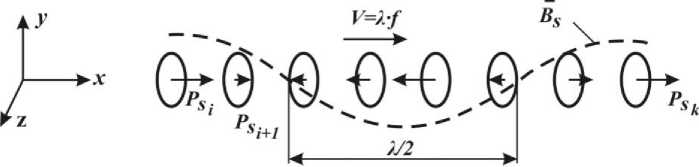
Fig. 7. The spatial distribution of the spin induction flow
a kind of negative charge spatially distributed along this element with a wave-like spin polarization forming a kind of spin induction (Fig. 7) [29].
The spin induction flow (20), influencing the windings of the induction sensor, induces a corresponding EMF in this winding:
ism
d Ф, - w -dt
= w -to s • S ' • B sm • sin( ® s t - kx + ф B ). (21)
Summarizing the above and in accordance with (21), the following can be stated: 1 - alternating electric field creates the area of spin circulation in the working area of the spin capacitor; 2 - the area of circulation of the spin magnetic moments of the free electrons, acting as the harmonic oscillator, excites a traveling polarization wave of the spin magnetic moments of the free electrons (spin induction flow) through the spin-spin interaction in the adjacent structures of the electrically conductive cable element and controls its further evolution in the structure of this element throughout its entire length; 3 - the traveling polarization wave of the spin magnetic moments of the free electrons (spin induction flow), interacting with the induction sensor coil, leads to the appearance of the corresponding output variable EMF at the ends of this coil; 4 - the parameters (amplitude and phase) of the recorded output EMF eism of the induction sensor windings actually carry information not only about the geometric characteristics of the conductive cable elements, but also about the physical and chemical properties of their material.
In other words, one could argue that the exposure of free electrons in the crystalline structure to an altermatic electric field causes them to ‘oscillate’, which results in oscillating spin arrangement where such alternating field has effect. In turn, where it has effect, there emerges a traveling wave of spin polarization that effects free electrons throughout the long-length conductor while not displacing the core charge carriers in space. The spin-wave effect that occurs is picked by the instrumentation winding of the induction sensor, whose output (induction EMF) is in fact a data-carrying signal.
Note that these spin-wave dynamics processes differ drastically from electrodynamic processes that are usually associated with conduction currents and eddy currents emerging in the conductor and causing it to heat and to emit heat. In this case, the energy of the alternating electric field is converted into that of a traveling wave of free-electron spin polarization without side effects such as electromagnetic or heat radiation.
In order to create the necessary conditions for the occurrence of a stable process of polarization of the spin magnetic moments of the free electrons, an alternating electric field is created on resonance frequency of the spin magnetic moments of the free electrons of structures of electrically conducting cable elements. The specified frequency of the alternating electric field is determined by experiments.
Practical Implementationof the Proposed Method
The proposed method should be implemented as follows. First, it is necessary to form a reference signal in the form of the EMF induction eism.op If a faulty cable is rejected, where it is only necessary to record the presence and type of the fault in the cable's conductive elements without defining the specific defect parameters, the reference signal is obtained by placing a section of the reference cable between the spin capacitor's electrodes without defects, similar to the cable to be monitored in the future. By influencing on this reference cable with an alternating electric field, an induction sensor forms a measuring signal in the form of EMF eism.kontr proportional to its technical parameters. This signal is then processed in the SPU, where it is filtered and amplified, its amplitude and phase, which are further digitized and appropriately entered into a personal computer (PC) by a specialized hardware interface installed on the PC motherboard, are determined. In this case, the PC actually performs the functions of SCD.
After that, the monitored electrical cable is placed between the electrodes of the spin capacitor and displaced relative to the spin capacitor and the induction sensor, constantly generating the current control signal in the form of the EMF induction eism.kontr . The parameters of the control signal are constantly compared in SCD with the parameters of the reference signal e ism.op and, according to the deviation of the compared parameters Δ e m and Δφ m , the quality of the conductive cable elements is assessed.
If there is a fault in the electrically conductive elements in a controlled section of the cable at the location of the induction sensor, for example, a break or a significant reduction in the living cross section of these elements, the spin magnetic polarization of the free electrons in this area is disrupted which results in the disappearance of the spin induction flow and in a significant reduction in EMF eism.kontr. In turn, the defects causing abnormal changes in the structure of the monitored conductive cable elements and associated primarily with changes in the composition of the material of this element will be manifested in the form of significant deviations of the phase of the recorded EMF eism.kontr.
Therefore, the difference in control amplitudes and reference signals as a result of comparison is used for detection of defects such as breakage or loss of cross-section, while for detection of defects such as discontinuity or deviation from a particular chemical composition , they use the phase difference between control and reference signals as a result of comparison.
The proposed diagnostic method is easy adaptable for use with multiwire cables. In this case, the rupture of a single or more wires will alter the spin-wave process, reducing its amplitude significantly at the rupture site, as such rupture effectively stops the spin polarization of conduction electrons from evolving further.
When the spin capacitor is disconnected from the exciting alternating voltage, the free electrons in the electrically conductive cable elements return to their original chaotic state in which their spin magnetic moments lose their periodically changing similar orientation, i.e. electrons lose the induced polarization of their spin magnetic moments as a result of which the flow of spin induction disappears.
The described monitoring procedures and their sequence are recommended when it is required to perform the process of rejecting the faulty cable, e.g. directly in the field during the cable laying process when unwinding from the reel.
If you need to rank the detected defects with the determination of specific defect parameters, it is necessary to first of all form a database of reference signal parameters in the form of emoi amplitudes and phases φоi, the EMF induction eism.op obtained experimentally from the results of measurements in cable samples with artificially created fixed defects. In this case, the specific parameters of the defect are recorded when the current values of the parameters of the con- trol signals eism.kontr and the parameters of the reference signals eism.op are the same, i.e. under conditions Δem = 0 and/or Δφm = 0. Such control is expedient, for example, directly in the production process. It will allow direct real-time monitoring of defects in cable products' physical parameters and make the necessary adjustments to their manufacturing technology process.
To confirm the efficiency and effectiveness of the proposed method of testing, experimental research using an appropriate information-measuring system (IMS), which implements the proposed principle of control and consists of the following functional elements (Fig. 5): IS, SPU, and SCD was conducted. In its turn, the SPU contains an active filter, amplitude and phase detectors collected using precision operational amplifiers which form two corresponding measuring channels. The signals, which magnitudes are proportional to the amplitude and phase of the EMF induction eism.kontr , respectively, are taken from the outputs of the SPU measuring channels. The functions of the SCD unit are performed by a personal computer (PC) using the motherboard featuring the PCI-1710HG hardware interface which digitizes the signals from the SPU and then inputs the received digital information into the PC. The connection between the SPU and the PC is made through the PCLD-8710 mounting terminal. The values of the reference signal parameters e ism.op are also entered into the PC via the PCLD-8710 mounting terminal and the PCI-1710HG hardware interface. Table 1 shows some of the selected experimental research results as an example [29].
Fig. 8 also illustrates the separate results of this research in the form of a corresponding graphical interpretation, where U g – spin capacitor excitation voltage; U A ′ l and U A ′′ l – electric voltages from the recording coil of the induction sensor when monitoring aluminum conductive cable elements with different cross sections; U C ′ u and U C ′′ u – electrical voltages from the recording coil of the induction sensor when monitoring copper conductive cable elements with different cross sections.
For illustrative purposes, the results of experimental research obtained for the corresponding sets of
Table 1
The Selected Experimental Research Results
|
Material of the conductor |
Nominal cross section S, mm2 |
Parameters of the recorded electrical signal |
Spin capacitor excitation voltage, V |
|
|
Amplitude, V |
Phase, grad |
|||
|
Copper |
break |
0.001 |
0 |
2 |
|
0.75 |
0.212 |
–19 |
||
|
1.0 |
0.241 |
–20 |
||
|
1.2 |
0.3 |
–21 |
||
|
Aluminum |
break |
0.001 |
0 |
|
|
0.75 |
0.123 |
8 |
||
|
1.0 |
0.132 |
9 |
||
|
1.2 |
0.15 |
10 |
||
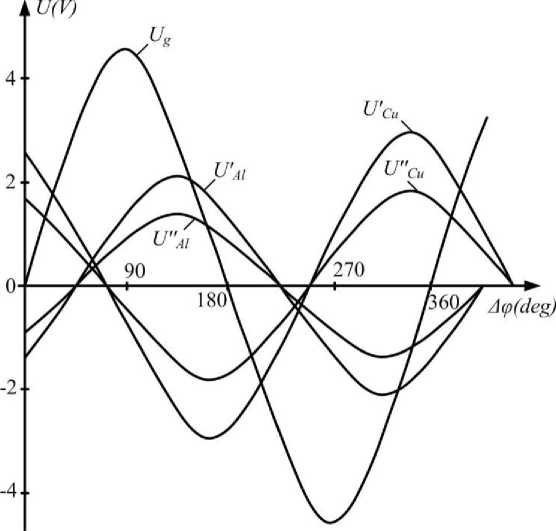
Fig. 8. Graphical interpretation of experimental results
different sections of single-core aluminum and copper wires are given as an example, where the difference between the cross sections of wires of the same type materials was 8–10 %. The graphs clearly show the dependence of the amplitude of the recorded signals on the cross section of homogeneous conductors and significant phase changes in the recorded signals relative to the phase of the excitation voltage of the spin capacitor when changing the material of the conductive elements.
Thus, experimental research of the device that implements the described method has shown high efficiency and accuracy in determining the location of the break of the conductive cable elements and monitoring the physical parameters of the defect, which allows to conduct a comprehensive assessment of the cable ability to perform its functions.
Conclusions
Experiments have proven the theory behind the effects of low-frequency spin-wave processes in the structure of conductive paramagnetic and diamagnetic materials exposed to an alternating electric field.
The use of spin polarization phenomena caused by the presence in electrons of a polarized spin and arising from the action of an alternating electric field on the free electrons of the conductive cable elements allows to conduct comprehensive research of both the structure of the conductive cable elements and their physical properties. The main advantages of this method include the following qualities: 1 - the possibility of monitoring the conductive cable elements (both single- and multiwire) from any conductive para-and diamagnetic materials; 2 - accuracy and reliability of control does not depend on the value and uniformity of the cable movement speed, as well as on the vibration and its transverse oscillations relative to the source of the physical field and the induction sensor; 3 - allows monitoring with fixed cable; 4 - provides nondestructive cable diagnostics without degrading its performance; 5 - easy to use when monitoring parameters, both in the process of cable manufacture and in rejecting the cable when it is unwound from a reel during laying.
In conclusion, it should be noted that the developed method can be used not only to diagnose electrical cables and wires, but also for other lengthy products made from metallic non-magnetic materials in the form of rods, pipes, etc. In comparison with the known monitoring methods, this method provides an increase in the reliability of the monitoring as a whole and expands the scope of its application.
References Nondestructive testing method based on the spin polarization effect template
- Wang P., Qing Xu J., Su J. The research of urban distribution network high-reliability power supply construction. International Conference on Advanced Power System Automation and Protection, 2011, vol. 2, pp. 1497-1500. DOI: 10.1109/APAP.2011.6180744
- Velasco L.N., Silva T.V., Oliveira J.C. et al. An approach to improve power supply continuity throughout the estimation of insulated power cable life expectance indexes. XI Brazilian Power Electronics Conference, 2011. DOI: 10.1109/C0BEP.2011.6085294
- Town W.L. A review of eccentricity, capacitance and diameter gauges for continuous observation and recording of cable quality during manufacture. Power Engineering, 1962, vol. 109, pp. 151-162.
- Jorrens P.P. Advances in computer-controlled measurements of cable parameters. IEEE Transactions on Instrumentation and Measurement, vol. 20 (4), pp. 231-234.
- Cheng Zh., Yang Y. Design of the intelligent monitoring system for wire drawing process. 13th International Computer Conference on Wavelet Active Media Technology and Information Processing, 2016, pp. 418421.
- Benjamin T.L. Power cable diagnostics: field application and case studies. Neta World USA, 2004. Available at: http:// electricityforum.com/td/wire-and-cable/power-cable-diagnostics.
- Ida N., Meyendorf N. Handbook of advanced non-destructive evaluation. Springer Nature Switzerland AG, 2018. DOI: 10.1007/978-3-319-30050-4_13-1
- John V.B. Non-destructive Testing. Testing of Materials. Palgrave London, 1992, pp. 90-125. DOI: 10.1007/978-1-349-21969-8_8
- Fedorov E.M., Koba A.A. Three-axis laser method for measuring the diameter of cylindrical objects. Proc. Dynamics of Systems, Mechanisms and Machines, 2016, pp. 1-4. DOI: 10.1109/Dynamics.2016.7819008
- Lee Shih-Hsiung, Yang Chu-Sing. A simple remote auxiliary inspection system. 10th International Conference on Intelligent Computation Technology and Automation, 2017, pp. 180-183. DOI: 10.1109/ICICTA.2017.47
- Richter J., Streitferdt D., Rozovad E. On the development of intelligent optical inspections. IEEE 7th Annual Computing and Communication Workshop and Conference, 2017, pp. 1-6. DOI: 10.1109/CCWC.2017.7868455
- Yan Tai-Shan, Cui Du-Wu. The method of intelligent inspection of product quality based on computer vision. 7th International Conference on Computer-Aided Industrial Design and Conceptual Design, 2006, pp. 1-6. DOI: 10.1109/CAIDCD.2006.329469
- Zhang H., Yang R., He Y., Foudazi A., Cheng L., Tian G. A review of microwave thermography nondestructive testing and evaluation. Sensors, 2017, vol. 17 (5), p. 1123. DOI: 10.3390/s17051123
- McDonald J.M., Lutz T.J., Ulrickson M.A., Tanaka T.J., Youchison D.L., Nygren R.E. Phase Lag Infrared Thermal Examination (PLITE); A new non-destructive test process. IEEE 22nd Symposium on Fusion Engineering, 2007, pp. 1-4. DOI: 10.1109/FUSION.2007.4337873
- Su Yeong Jeong, Byoung Chul Kim, Young Han Kim. Defect detection in a cylinder using an IR thermographic device and point heating. International Conference on Control, Automation and Systems, 2007, pp. 2389-2392. DOI: 10.1109/ICCAS.2007.4406732
- Chunli Fan, Fengrui Sun, Li Yang. A general quantitative identification algorithm of subsurface defect for infrared thermography. Joint 30th International Conference on Infrared and Millimeter Waves and 13th International Conference on Terahertz Electronics, 2005, vol. 2, pp. 341-342. DOI: 10.1109/ICIMW.2005.1572552
- Ruiz N., Vera P., Curpian J. et al. Matching pursuit-based signal processing method to improve ultrasonic flaw detection in NDT applications. Electronics Letters, 2003, vol. 39 (4), pp. 413-414. DOI: 10.1049/el:20030262
- Sun H.C., Saniie J. Ultrasonic flaw detection using split-spectrum processing combined with adaptive-network-based fuzzy inference system. IEEE Ultrasonics Symposium. International Symposium, 1999, vol. 1, pp. 801-804. DOI: 10.1109/ULTSYM.1999.849518
- Saniie J., Nagle D.T. Robust ultrasonic flaw detection using order statistic CFAR threshold estimators. IEEE Ultrasonics Symposium, 1991, vol. 2, pp. 785-789. DOI: 10.1109/ULTSYM.1991.234083
- Mook G., Hesse O., Uchanin V. Deep Penetrating Eddy Currents and Probes. ECNDT, 2006. Available at: http ://ndt. net/article/ecndt2006/doc/Tu. 3.6.2 .pdf.
- García-Martín J., Gómez-Gil J., Vázquez-Sánchez E. Non-destructive techniques based on eddy current testing. Sensors, 2011, vol. 11 (3), pp. 2525-2565. DOI: 10.3390/s110302525
- Cardelli E., Faba A., Specogna R., Tamburrino A., Trevisan F., Ventre S. Analysis methodologies and experimental benchmarks for eddy current testing. IEEE Transactions on Magnetics, 2005, vol. 41 (5), pp. 13801383. DOI: 10.1109/TMAG.2005.844357
- Janousek L., Smetana M., Strapácová T., Rebican M., Duca A. Advanced procedure for non -destructive diagnosis of real cracks from eddy current testing signals. Elektro, 2014, pp. 567-570. DOI: 10.1109/ELEKTRO.2014.6848961
- Lehtiniemi R., Hartikainen J. An application of induction heating for fast thermal nondestructive evaluation. Review of Scientific Instruments, 1994, vol. 65, pp. 2099-2101. DOI: 10.1063/1.1144818
- Zenzinger G., Bamberg J., Satzger W., Carl V. Thermographic crack detection by eddy current excitation. Nondestructive Testing and Evaluation, 2007, vol. 22 (2), pp. 101-111. DOI: 10.1080/10589750701447920
- Tsopelas N., Siakavellas N. Experimental evaluation of electromagnetic-thermal non-destructive inspection by eddy current thermography in square aluminum plates. NDT & E International, 2011, vol. 44 (7), pp. 609-620. DOI: 10.1016/j.ndteint.2011.06.006
- Wang Y., Gao X., Netzelmann U . Detection of surface cracks in metals under coatings by induction thermography. 14th quantitative infrared thermography conference, 2018, pp. 602-611. DOI: 10.21611/qirt.2018.064
- Bryakin I.V., Bochkarev I.V., Khramshin V.R. The power cables quality diagnostics. International Russian Automation Conf, 2018. DOI: 10.1109/RUSAUTOCON.2018.8501787
- Bryakin I.V., Bochkarev I.V., Khramshin V.R. Diagnostics of electrical wires and cables. International Conference on Industrial Engineering, Applications and Manufacturing, 2019. DOI: 10.1109/ICIEAM.2019.8742967
- Woan G. The Cambridge handbook ofphysics formulas. Cambridge University Press, 2003. 230 p.
- Bozorth R.M. Ferromagnetism. Wiley-IEEE Press, 1978. 968 p.
- Morrish A.H. The physical principles of magnetism. Wiley-IEEE Press, 2001. 700 p.
