Nonlinear allometric equation for crop response to soil salinity

Author: Misle E., Kahlaoui B.
Journal: Журнал стресс-физиологии и биохимии @jspb
Article in issue: 2 т.11, 2015.
Free access
Crop response to soil salinity has been extensively studied, from empirical works to modelling approach, being described by different equations, first as a piecewise linear model. The equation employed can differ with actual response, causing miscalculation in practical situations, particularly at the higher extremes of the curve. The aim of this work is to propose a new equation, which allows determining the full response to salinity of plant species and to provide a verification using different experimental data sets. A new nonlinear equation is exposed supported by the allometric approach, in which the allometric exponent is salinity-dependent and decreases with the increase in relative salinity. A conversion procedure of parameters of the threshold-slope model is presented; also, a simple procedure for estimating the maximum salinity (zero-yield point) when data sets are incomplete is exposed. The equation was tested in a wide range of experimental situations, using data sets from published works, as well as new measurements on seed germination. The statistical indicators of quality (R 2, absolute sum of squares and standard deviation of residuals) showed that the equation accurately fits the tested empirical results. The new equation for determining crop response to soil salinity is able to follow the response curve of any crop with remarkable accuracy and flexibility. Remarkable characteristics are: a maximum at minimum salinity, a maximum salinity point can be found (zero-yield) depending on the data sets, and a meaningful inflection point, as well as the two points at which the slope of the curve equals unity, can be found.
Crop modelling, salinity tolerance, allometry, crop stress, soil salinity
Short address: https://sciup.org/14323921
IDR: 14323921
Text of the scientific article Nonlinear allometric equation for crop response to soil salinity
St Maximum salinity tolerated by a crop without yield reduction (Maas and Hoffman 1977)
c5o Salinity at which the yield is reduced by 50% of van Genuchten (1983)
Y Any structural and functional variables of organisms as height or growth rate m Corporal mass
Yo Allometric constant b Allometric exponent
M Mineral nutrient accumulated by a crop
MT Total nutrient accumulated in the total biomass
В Crop biomass
BT Total crop biomass
Mo Allometric constant for the specific M to В relationship
Bs Biomass under saline condition
Bx Maximum total biomass production without saline restriction
S Salinity in soil under actual growing conditions
Sx Maximum salinity tolerated by the crop (or measured).
bs Allometric exponent of salinity to biomass/yield relationship bs' Allometric constant of the salinity-dependent bs bsd Exponent of the salinity-dependent bs a Allometric constant of the salinity response curve c Constant fixing the starting point of the salinity curve
R2 Coefficient of determination
Sy.x Standard deviation of residuals
CV Coefficient of variation n Number of points/sample
Among concerns in agricultural sciences soil salinization has long been identified as a major problem (Alam, 1999). It has been estimated that about 10% of the total land surface of the world have salt affected soils, a magnitude close to one billion hectares, and one third of all agricultural lands are also becoming saline (Pessarakli and Szablocs, 1999; Sen et al ., 2002). Globally, about 20% of the irrigated land is salt affected (FAO, 2014). Thus, salinity response in plants has been considered of main importance and it is the core of the study on this agricultural problem.
The quantitative approach to the salinity response was first focused as a piecewise linear function by Maas and Hoffman (1977). This function established an extremely practical method, since it is determined by just two independent parameters: the soil salinity threshold, S t (maximum salinity tolerated by a crop without yield reduction compared to the same crop under non-saline conditions) and the slope that determines the yield reduction per unit of salinity increase. In the next decade van Genuchten (1983) introduced a non-linear equation in a study which included various mathematical expressions, while van Genuchten and Gupta (1993) exposed the weaknesses of the linear approach, showing evidence of the strength of the s-shaped asymptotic function of van Genuchten (1983). In this equation he added the c 50 parameter, the salinity at which the yield is reduced by 50%.
On the other hand, Misle (2013) supported that the allometric approach is a synthetic but powerful tool in crop ecophysiology. Although allometric theory is debated among scientists (West et al., 1997; Enquist, 2002), well-founded reasons sustain to include allometric relationships in a systemic approach to practical applications as crop mineral nutrition under stress (Misle and Garrido, 2008).
Hence in this work we hypothesize, supported by the allometric approach, that salinity in soil can interfere the acquiring of resources such as water, mineral nutrients and oxygen, so that a power equation can describe the crop response in growth or other measure. Thus, the aim of this study was to propose a new equation, which allows determining the full response to salinity of plant species and to provide a verification using different experimental data sets.
THEORY
Allometry in biological sciences is the study of size correlated variations in organic form and process (Niklas, 1994). It was first applied by Pearsall (1927) to plants. However, the modern terminology was adopted by Huxley and Teissier (1936). Currently, it has been sustained that in many structural and functional variables of organisms as height or growth rate, Y , a power relationship with the corporal mass, m , or with measures as length or diameter can be found:
Y = Y o m b [1]
where Yo is a constant associated to the variable and organism type and b is the allometric exponent (Niklas, 1994; West et al., 1997; Enquist, 2002). In similar terms, Misle (2006, 2013) has proposed that mineral nutrients accumulation is allometrically related with the total biomass in crops:
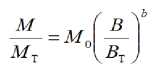
where M is the nutrient accumulated at any time associated to a biomass, B ; M T is the total nutrient in the total biomass, B T , both accumulated by the crop at the end of the growing period; M 0 is a normalization constant usually expected to be equal to unity.
West et al . (1997) and Enquist (2002) have explained the basis of allometry, which are particularly relevant when functional relationships are considered. They have been supporting for long that the occurrence of allometric relationships constitutes the condition for “ maximizing the scaling of surfaces where resources are exchanged with the environment (e.g. roots area, leaf area, lungs or gut surfaces) ”. If “ physiological rates must match the ability of vascular networks to obtain and deliver resources ” it is plausible that salinity in soil can interfere the acquiring of resources as water, mineral nutrients and oxygen in such a way that a power relationship can describe the response in growth or other measure. In fact, it is well known that abiotic stress modulates plant root development (Sánchez-Calderón et al ., 2013). Moreover, an oxygen deficient soil environment can interfere with nutrient uptake and translocation of water and ions (Hodge et al ., 2009).
Kahlaoui et al. (2011) studied the response of three tomato cultivars to water regime using saline water (6.57 dS m-1) and found that mineral nutrients decrease as water levels decrease, while Na+ and Cl-increase. It is well-known that salinity inhibits water uptake due to osmotic effect, also disturbs the normal metabolism caused by high Na+ concentration in plant tissues and inhibits the absorption of other essential cations (Alam, 1999); furthermore, soil aeration is diminished due to deterioration in the physical structure of soils (Yadav et al., 2011). Thus, conversely to the relationship of any mineral nutrient to the biomass in Eq. 2 and taking into account the reduction in biomass caused by the salinity increase, the following expression was proposed by Misle and Garrido (2008):
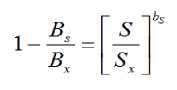
where S is the salinity of the soil under actual conditions between 0 - Sx , Bx is the maximum total biomass production without saline restriction and Bs is the estimate of biomass under saline condition S, usually the unknown quantity. Sx is the maximum salinity tolerated by the crop (measured) or ideally, the zero-yield point.
Eq. 3 is a simple and sound hypothesis, functional enough, which is easy to couple with the other components in the simulation work of Misle and Garrido (2008), but it is not realistic enough. To illustrate this point, in Fig. 1 a linear fit and the power equation (Eq. 3) are compared to a more realistic s-shaped curve. As can be observed, a power equation first underestimates and then overestimates compared to the s-shaped curve, as well as the linear fit.
While considering the above arguments it can be questioned whether any additional effect is needed to take into account in the allometric equation that makes this response a non-linear allometry. If the independent variable, to get:
something like this can be postulated for the salinity response, some evidence should be presented for the new proposed b s . Here, an example is useful. When a simple allometric relationship is considered, the plot of the allometric exponent against the variable selected to be set on the abscise axis (i.e. leaf width, biomass, etc.) results in an almost constant value, with some experimental variability around a mean value (Fig. 2a). But when the hypothetical b s is calculated from empirical data on the salinity response as b s = ln(1- B / B x )/ln( S / S x ) a power-like shaped curve is obtained
(Fig. 2b).
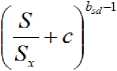
Therefore, a new hypothesis is plausible: the allometric exponent b s is also salinity-dependent and should decrease with the increase in the relative salinity ( S / S x ) by a power function with a negative allometric exponent, b sd (decreasing rate):
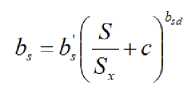
b s ’ is the constant of this allometric relationship associated to the intercept on the y-axis (maximum bs) . So that this new equation is proposed:
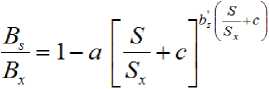
The constant c , locates the starting point of the curve. The constant a is associated to the strength of the decline of the curve with the increase in relative salinity, whose meaning refers to salinity tolerance.
Derivatives : The equation for the allometric exponent (Eq. 4) can easily be derived, taking S / S x as
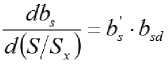
Experimental data can be analyzed to compare the data sets by discrete intervals as Δ b s with the equation [6]. In Fig. 3 yield response data from McElgunn and Lawrence (1973) were transformed to be compared with the fit of the derivative Eq. 6. Similarly, Eq. 5 can be derived to get:
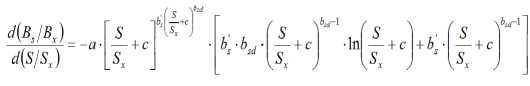
Δ (Y/Y x ) points (as approximation to the derivative of B s / B x ) were calculated from data of McElgunn and Lawrence (1973) in bromegrass and plotted in Fig. 3 with the regression curve of the fit of the derivative Eq. 7.
The insets in Figs. 3a and 3b show the theoretical shapes of both derivatives. Thus consistency is presented for Eq. 5 regarding its logical coherence. In addition, Eq. 7 can be used to obtain the inflection point of the curve, which can be a much more meaningful point than the classical St or c50 at the time of comparing species and cultivars. The minimum in Fig. 3b reveals the inflection point. Two additional points can also be considered as characteristics: the two points at which the slope of the response curve (first derivative) equals unity. In general, the first of these points occurring when growth/yield response begin to diminish at increasing salinity will indicate the point from which the next unity of salinity increase causes a decrease of growth/yield in more than the previous unity, indicating the salinity from which growth/yield is more seriously affected and may be not convenient for cash crops. Thus, this point is a more refined criteria for defining a St . In the dataset of alfalfa (Fig 4 b) for instance, these two points occur approximately at 45.9 mM (0.092 as S/Sx) and 286.4 mM (0.574 as S/Sx). The interval between these points is the mostly linear part of the curve.
APPLICABILITY OF THE NEW EQUATION PROPOSED
Examples of fit quality in different crops
Eq. 5 has been tested with different experimental results, covering published works and new data sets from the authors. Regarding our own datasets three species were selected: tomato, muskmelon and quinoa. Emergency until full cotyledon expansion, in pots with quartz sand inside a controlled temperature and light chamber was recorded for tomato and muskmelon, while the emergency in pots under greenhouse conditions was recorded for quinoa. The treatments were defined by irrigating the pots with NaCl solutions at different electrical conductivities: 2 to 16 dS m-1 in tomato and muskmelon and 0 to 45 dS m-1 in quinoa.
In Fig. 4a we fitted experimental results on wheat (Rengasamy, 2010) to Eq. 5 (see Table 1) while the estimated points for the response curves of six different species published in a review by Munns and Tester (2008) are shown in Fig. 4b. Notably, curves full overlap with the simulated points and exhibit the accuracy and flexibility of Eq. 5.
For additional verification the equation was tested in a wider range of crops. In Table 1 parameters of Eq. 5 for different species are listed. The indicators of fit quality (R2, absolute sum of squares and standard deviation of residues) showed that the equation related properly to the tested results (Table 1). However, when considering published results we handled only a single pool of data. As apparent benefit high R2 was obtained due to the smooth s-shape in the series of points with 6 or more salinity treatments. But Rengasamy (2010) published a table with all replicates, enabling us for additional demand to Eq. 5 which resulted in accurate fits also (Table 1, Figure 4a). Conversely, in our results with muskmelon and tomato, regressions did not score the high R2 of the first examples due to the space limitation inside the growth chamber, which restricted treatments to only 5 electrical conductivities, despite having 4 and 5 replicates (Fig. 4).
In general, this new equation fits similarly to van Genuchten equation as shown in Figure 5 using other known dataset from Steppuhn and Wall (1997) but has the advantages early exposed.
Conversion of parameters from the piecewise linear method
Data available in tables that summarize the parameters (St and the slope) in the piecewise linear method for different crops can be easily converted to the allometric equation presented here. It is just needed to create a data set in relative magnitudes using the two parameters of the linear method and adding points between the St and the zero-yield point; then this data set can be fit to the allometric Eq. 5. This way, a crop with St = 2.5 and slope = 0.08, similar to Solanum or cucurbit species (Ayers and Westcot, 1985, Grieve et al., 2012) will result in a conversion with R2 = 0.9988 using the following parameters of Eq. 5: a = 0.9840, bs’ = 4.211e-008, c = 1.041 and bsd = -0.3333.
Procedure for estimating a zero-yield point when data sets are incomplete
Frequently available good experimental results do not test crop responses at extreme salinity, close to the zero-yield point. This makes desirable to have additional points because sometimes regressions could not converge to estimate the parameters or the fit is ambiguous.
In these cases we propose to perform a linear regression for estimating a zero-yield point prior to the regression with Eq. 5. For performing this procedure the experimental points at the lower salinity treatments should be eliminated in order to consider just the descending part as in the linear method. Then, an estimative zero-yield point can be added to the data set to proceed with the fit of Eq. 5.
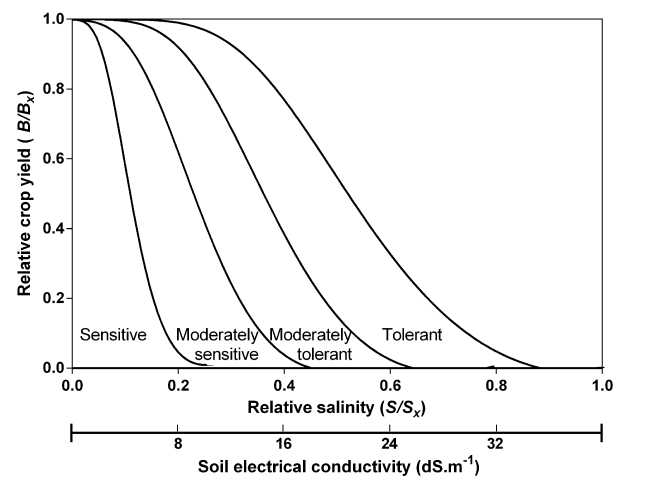
Divisions for classifying crop tolerance to salinity using the allometric method
The classification of crop salinity tolerance is usually graphed by the piecewise linear method (Maas and Hoffman, 1977). Similar divisions can be made by the method exposed here (Fig. 6).
Table 1 : Estimated parameters and goodness of fit using the allometric Eq. 5 in 16 different cases. Maximum used for relative S were: 27.9; 20.0; 39.6; 18.0; 14; 44.2; n/a; n/a; n/a; n/a; n/a; n/a; 14.1; 16.0; 16.0 and 45.0 dS m-1, respectively.
: numbers in brackets means that original data were not available and points were selected from the curve.
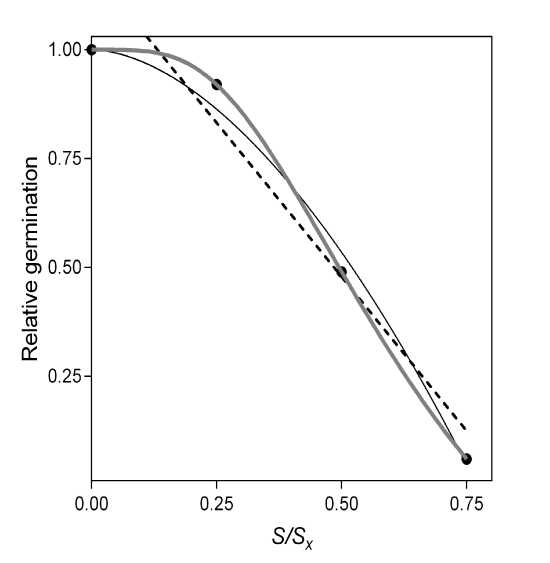
Figure 1: General shapes for hypothetical salinity response curves, linear, sigmoid (in grey) and power (Eq. 3) shapes. R2 for power equation: 0.991. Original data of germination percentage at 20°C from Belaqziz et al . 2009 (0.75 = 150 mM NaCl).
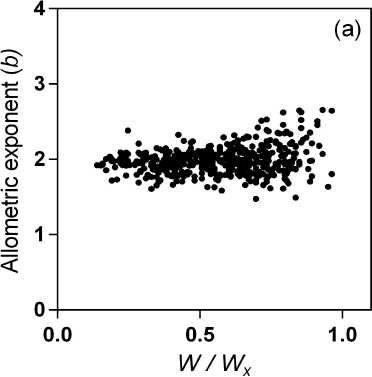
Figure 2: Plot of calculated (a) allometric exponent b in the relationship between leaf width and leaf area of muskmelon (elaborated from data of Misle et al . 2013) and (b) the hypothetical allometric exponent b s in the relationship between biomass and salinity reveals a non-linear allometry (elaborated from salinity response data of McElgunn and Lawrence, 1973 in bromegrass).
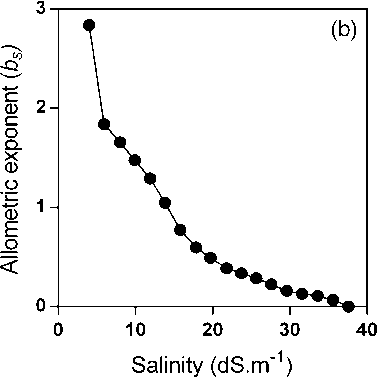
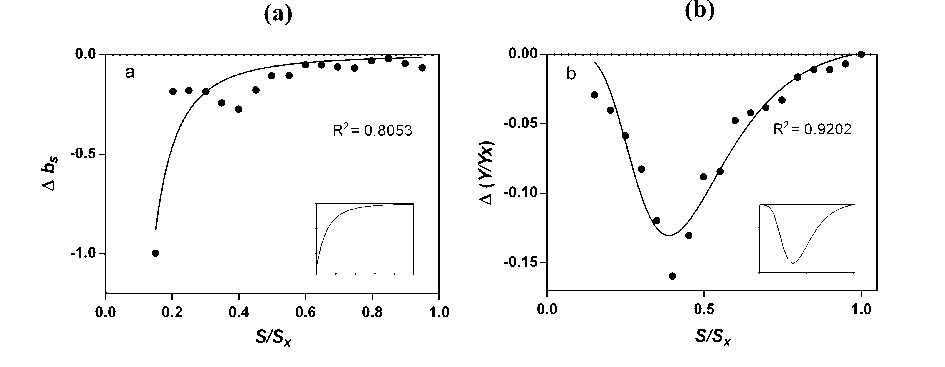
Figure 3: Derivatives of (a) the equation of the hypothetical allometric exponent b s fitted (curve) to the calculated points Δ b s by Eq. 6 and (b) Eq. 5 fitted (curve) to the Δ (Y/Yx) points by Eq. 7. The insets show the theoretical shapes of both derivatives. Original data of salinity response in bromegrass, from McElgunn and Lawrence (1973).
Relative biomass
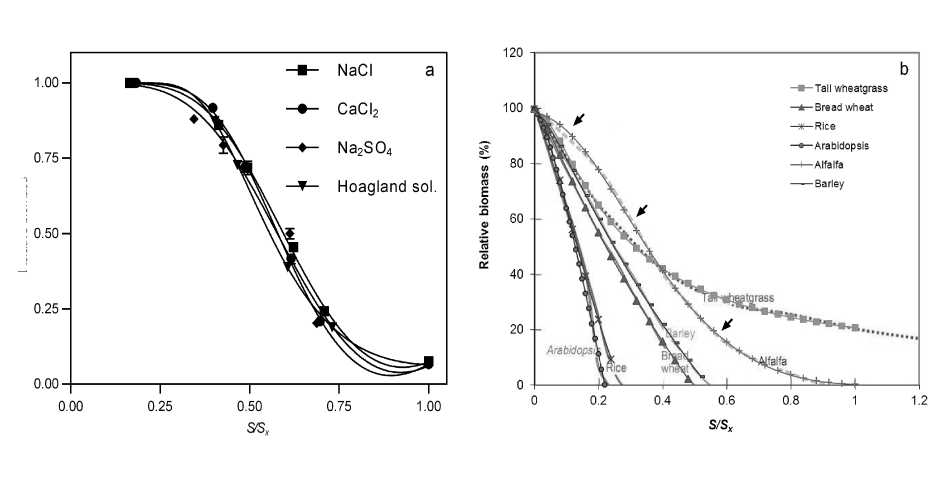
Figure 4: Salinity response curves of relative biomass in (a) wheat plants grown in pots irrigated with different solutions (Rengasamy, 2010; the curve is the fit of Eq. 5, vertical bars indicate the standard error using 4 replicates) and (b) an overlapping of Fig. 1 in Munns and Tester (2008) with our plot of the estimated points by Eq. 5 (Two species were not included to avoid the excess of curves). Arrows along the curve of alfalfa indicate the approximate location of the inflection point (central arrow) and points at which the slope equals unity.
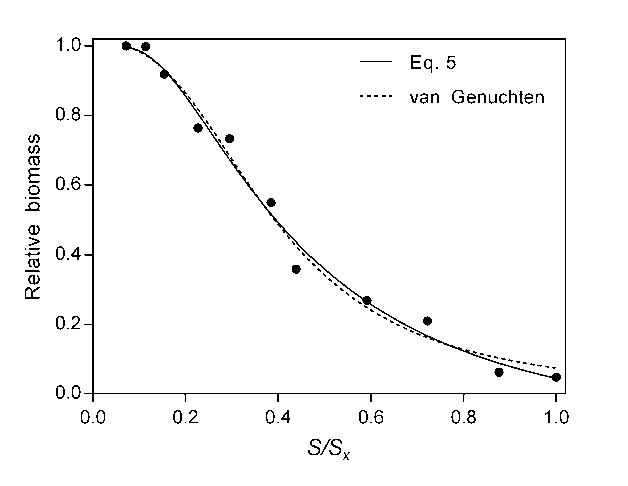
Figure 5: Fit of Eq. 5 and van Genuchten equation to results obtained by Steppuhn and Wall (1997) in Biggar spring wheat.
|
Parameter |
Border curve by crop category |
|||
|
Sensitive |
Moderately sensitive |
Moderately tolerant |
Tolerant |
|
|
a |
0.8713 |
0.4922 |
0.3433 |
0.2432 |
|
c |
0.8315 |
0.7729 |
0.6899 |
0.5942 |
|
b’ s |
4.2970 |
8.2930 |
8.7970 |
8.4230 |
|
b sd |
-12.270 |
-4.262 |
-2.995 |
-2.162 |
Figure 6: Divisions for classifying crops tolerance to salinity using the allometric Eq. 5 and according to Maas and Hoffman (1977). The table below the figure contains the fit values for the parameters required to define the border curve by crop category. Each curve in the graph was drawn by these parameters.
DISCUSSION
The piecewise linear method continues to be a very useful way to easily characterize crop response to salinity (Grieve et al., 2012). But as research is focusing in a wider range of the response curve in plants, the tailing phenomenon analyzed by van Genuchten and Gupta (1993) becomes more important since, in their words, this part of the curve cannot be described with the linear threshold-slope model. In other terms, the region of validity of this model ends in the descendent quasi-linear part of the curve. The situation is comparable with the temperature response function in biological processes, a subject in which the degree-day method (linear) has coexisted with non-linear models for decades. The minimum of biological activity in poikilotherms by the linear method is the zero-point of the regression line on the x-axis, being so called the “base temperature” (Bonhomme, 2000). But physiological activity continues even at lower temperatures (Sharpe and DeMichele, 1977). This way, the linear method is still used for practical purposes but it is widely accepted that the nature of the biological response is non-linear (Sharpe and DeMichele, 1977; Yan and Hunt, 1999). As regards to salinity response at high salinities a comparable situation has been accepted from the work of van Genuchten (1983). However, in this equation an arbitrary criterion is needed for defining a zero-yield point since the curve is asymptotic regarding the salinity axis. Mathematically, in our equation a true zero point can be found, depending on the data sets. Each time an hypothetically true Sx at zero- yield/growth (Bs/Bx= 0) is taken, obviously S/Sx = 1; but when experimental data are used directly for regression a Bs/Bx > 0 is obtained for S/Sx=1 (Figure 3a); however the curve can be extrapolated to zero at a point S/Sx > 1, meaning that a non-true zero-yield point was formerly used as Sx. For illustrating the relevance of this aspect we analysed three works in which different cultivars were considered: Khan et al. (1997) in nine cultivars of rice; Essa (2002) in three cultivars of soybean and Chilo et al. (2009) in two cultivars of quinoa. The coefficient of variation (CV) among cultivars for the lowest and the highest salinity used was calculated for 4, 3 and 6 plant parameters, respectively. The mean CV for the lowest salinities was 9.4% while the mean CV for the highest salinities was 46.9%. This clearly highlights the importance of taking into account the final part of the curve when comparing cultivars, since their differences are accentuated. Of course, against our proposal is the need of just two parameters additionally to the maximum yield/growth in the earlier equations (Maas and Hoffman, 1977; van Genuchten, 1983) while we require four, but currently processing regressions for equations with two or more constants does not make a difference in time. As can be observed in Figs. 4 to 6 valuable aspects of Eq. 5 are i) that a maximum salinity point can be found (zero-yield) depending on the data sets ii) mathematically the curve will always have a maximum (or 100%) at minimum salinity (expected c =0), when using relative salinity response, and iii) there is a meaningful inflection point. Some doubt regarding how to compare different datasets (species, cultivars) can emerge when offering figures in relative magnitudes (S/Sx) but this was done for the analytical convenience of this proposal and when including the equation in any programmed media, even a spreadsheet, results can be directly calculated according to Sx.
Salinity affects plants in different ways such as osmotic effects, specific-ion toxicity and nutritional disorders (Lauchli and Epstein, 1990). The extent by which one mechanism affects plants over the others depends upon many factors including the species, genotypes, plant age, ionic strength and composition of the salinizing solution. When considering the characteristic curve, the response at low salinities decreases at increasing rates while salinity is increased until the inflection point, probably due to the increasing osmotic effect. As well known, the effect of salinity at low to moderate concentrations is due to the osmotic effect (Yadav et al ., 2011). Despite this effect continues progressively with higher salinity, the specific ionic effect would become relevant from the inflection point, causing the response curve to decrease exponentially with new increases in salinity, but as the growth is lesser, additional increase in ionic concentrations could be slowed down, giving an apparent relief to the increasing damages, until the death of plants. Munns (2004) highlighted that when relative growth rate is decreased, the ion concentration in shoot increases and whenever the ion uptake rate is decreased the ion concentration in shoot can decrease. Experiments using NaCl and PEG or mannitol at the same osmotic potential have demonstrated the higher harmful effects of saline treatments, revealing the ionic effect (Bernstein, 1975;
Shabala, 2000; Zhang et al ., 2012). Indeed, Munns and Tester (2008) summarized the characteristics of the osmotic and ionic effects, being the former fast and involved in the decrease of new growth, while the latter is slow and leads to the senescence of older leaves; according to them, at high salinity levels the ionic effect dominates over the osmotic effect. Moreover, Shabala (2000) concluded that the perception of the ionic and osmotic components of salt stress is probably associated to different ionic mechanisms. Recently, Zhang et al . (2012) confirmed these observations in a study on barley germination by which they determined in general that at low salinities the osmotic effect is mainly involved; at medium salinities the two effects act together, while at high salinities the ionic effect dominates the harmful action on the germination process. This sequence of observations indicates the gradual change from osmotic to ionic-dominated effects which should match, turning at the inflection point. Thus, evidence in the literature supports us in our proposition on the meaning and utility of the inflection point.
Despite the fascinating parallelism of the c50 (van Genuchten 1983) (B/Bx=0.5) with the inflection point criteria in some results such as in McElgunn and Lawrence (1973) where symmetry is evidenced by relativizing measures, in other cases such as the curve of alfalfa in Munns and Tester (2008) the inflection point occurs at Bs/Bx ≈ 0.6. As analyzed in detail by Munns and Tester (2008), variations in osmotic tolerance and ionic tolerance can produce different patterns in the growth response to salinity stress. Thus, the inflection point criteria can have more applicability in crop breeding as well as in crop management compared to the c50. Some works have exposed the convenience of the c50 being more useful for the comparison between genotypes than the linear approach (Royo et al., 2000; Steppuhn et al., 2005). But the c50 is arbitrary, while the inflection point is a characteristic mathematical point of the curve, suggesting us that the same utility of c50 can be better fulfilled by our proposal.
The parameters of Eq. 5 can be subject of further study to test their dependence from external factors. The same species and cultivar has frequently been studied under different environmental conditions as soil or temperature (Paliwal and Maliwal, 1975; El-Dardiry, 2007; Gorai and Neffati, 2007; Belaqziz et al ., 2009). Usually apparent changes in the curve are revealed in these studies but it is necessary to separate the differing yield/growth observed at the lower salinities (different B x ’s) from the changes in the coefficients a , c , b s ’ and b sd themself. For instance, two cultivars differing in salinity tolerance may differ mainly in a , while two different species differing in salinity tolerance may differ mainly in c . For determining such differences, salinity treatments should be increased (6 or more) in order to have reliable curves. This kind of studies can help to understand the relationships of the parameters in the Eq. 5 with the underlying mechanisms.
CONCLUSION
A new equation for determining the salinity response in crops was proposed sustained by the allometric approach. The function overpasses the linear allometry found in Misle and Garrido (2008) as our analysis showed that if an allometric exponent exists, it is also salinity-dependent. Remarkable characteristics are: a maximum at minimum salinity, a maximum salinity point can be found (zero-yield) depending on the data sets and a meaningful inflection point, as well as the two points at which the slope of the curve equals unity. Thus, we propose a function able to follow the response curve of any crop with remarkable accuracy and flexibility. Our verification covered 16 examples of good fit; however, additional research is needed for further validation and inquiry on the physiological meaning of the parameters of Eq. 5.
References Nonlinear allometric equation for crop response to soil salinity
- Alam SM (1999) Nutrient uptake by plants under stress conditions. In: Handbook of plant and crop stress. (eds) Pessarakli, M. 2d Edition. Marcel Deker, Inc., New York
- Ayers RS, Westcot DW (1985) Water Quality for Agriculture. FAO Irrigation and Drainage Paper 29. Rome
- Belaqziz R, Romane A, Abbad A (2009) Salt stress effects on germination, growth and essential oil content of an endemic thyme species in Morocco (Thymus maroccanus Ball.). J Appl Sci Res 5: 858-863
- Bernstein L (1975) Effects of salinity and sodicity on plant growth. Annu Rev Phytopathol 13: 295-312
- Bonhomme R (2000) Review Bases and limits to using ‘degree.day’ units. Eur J Agron 13: 1-10
- Chilo G, Vacca Molina M, Carabajal R, Ochoa M (2009) Efecto de la temperatura y salinidad sobre la germinación y crecimiento de plántulas de dos variedades de Chenopodium quinoa. Agriscientia 26: 15-22
- Díaz-López L, Gimeno V, Lidón V, Simón I, Martínez V, García-Sánchez F (2012) The tolerance of Jatropha curcas seedlings to NaCl: an ecophysiological analysis. Plant Physiol Biochem 54: 34-42
- El-Dardiry EI (2007) Effect of soil and water salinity on barley grains germination under some amendments. World J Agric Sci 3: 329-338
- Enquist B (2002) Universal scaling in tree and vascular plant allometry: toward a general quantitative theory linking plant form and function from cells to ecosystems. Tree Physiol 22: 1045-1064
- Essa TA (2002) Effect of Salinity Stress on Growth and Nutrient Composition of Three Soybean (Glycine max L. Merrill) Cultivars J. Agron & Crop Sci 188: 86-93
- FAO (2014) Soils Portal. http://www.fao.org/soils-portal/en/. Accessed 4 July 2014
- Gorai M, Neffati M (2007) Germination responses of Reaumuria vermiculata to salinity and temperature. Ann Appl Biol 151: 53-59
- Grieve CM, Grattan SR, Maas EV (2012) Plant salt tolerance. In: W.W. Wallender and K.K. Tanji (eds.) ASCE Manual and Reports on Engineering Practice No. 71 Agricultural Salinity Assessment and Management (2nd Ed.). ASCE, Reston, VA. Chapter 13 pp: 405-459
- Hodge A, Berta G, Doussan C, Merchan F, Crespi M (2009) Plant root growth, architecture and function. Plant Soil 321: 153-187
- Huxley JS, Teissier G (1936) Terminology of relative growth. Nature 137: 780-781
- Kahlaoui B, Hachicha M, Rejeb S, Rejeb MN, Hanchi B, Misle E (2011) Effect of saline water on tomato under subsurface drip irrigation: nutritional and foliar aspects. J Soil Sci Plant Nutr 11: 69-86
- Khan MSA, Hamid A, Salahuddin ABM, Quasem A, Karim MA (1997) Effect of sodium chloride on growth, photosynthesis and mineral ions accumulation of different types of rice (Oryza sativa L.) J. Agron & Crop Sci 179: 149-161
- Lauchli A, Epstein E (1990) Plant responses to saline and sodic conditions. In K.K Tanji (ed). Agricultural salinity assessment and management. ASCE manuals No,71 pp 113-137 ASCE New York
- Maas EV, Hoffman GJ (1977) Crop salt tolerance -current assessment. J Irr Drain Div-ASCE 103: 114-134
- McElgunn JD, Lawrence T (1973) Salinity tolerance of Altai wild rye-grass and other forage grasses. Can J Plant Sci 53: 303-307
- Misle E (2006) Allometric determination between mineral absorption and biomass in different cultivated species. Lat Am J Agric Environ Sci 33: 67-71
- Misle E, Garrido E (2008) Determination of crop nutrient accumulation under water or saline stress through an allometric model. In: Proceedings of 17th International Symposium of the International Scientific Centre for Fertilizers (CIEC). El-Fouly MM, Haneklaus S, Hera C, Rietz RM, Schung E, Abdel-Magid, AA (eds). Nov 24-27 2008. CIEC and National Research Center, El-Zaiem Press, Cairo, Egypt, pp 401-409
- Misle E (2013) Simulating the accumulation of mineral nutrients by crops: an allometric proposal for fertigation. J Plant Nutr 36: 1327-1343
- Misle E, Kahlaoui B, Hachicha M, Alvarado P (2013) Leaf area estimation in muskmelon by allometry. Photosynthetica 51: 613-620
- Munns R (2004) Salinity stress and its impact. Plant Stress Website. Blum A (ed). http://www.plantstress.com/Articles/index.asp
- Munns R, Tester M (2008) Mechanisms of salinity tolerance. Annu Rev Plant Biol 59: 651-81
- Niklas K (1994) Plant Allometry. (1st ed.) The Univ. of Chicago Press, Chicago
- Osawa T (1965) Studies on the salt tolerance of vegetable crops with special reference to mineral nutrition. Bull Univ Osaka Prefect, B, 16: 13-57
- Paliwal KV, Maliwal GL (1975) Effect of salts on the growth and mineral nutrition of cabbage (Brassica oleracea) in soils and sand culture. Proc Indian Natl Sci Acad, B 41: 155-160
- Pearsall WH (1927) Growth studies. VI. On the relative size of plant organs. Ann Bot 41: 549-556
- Pessarakli M, Szabolcs I (1999) Soil Salinity and Sodicity as Particular Plant/Crop Stress Factors. In: Pessarakli M (Ed.). Handbook of Plant and Crop Stress 2nd Ed., Revised and Expanded. Marcel Dekker, Inc. New York
- Rengasamy P (2010). Osmotic and ionic effects of various electrolytes on the growth of wheat. Austr J Soil Res 48: 120-124
- Royo A, Aragüés R, Playán E, Ortiz R. 2000. Salinity-grain yield response functions of barley cultivars assessed with a drip-injection irrigation system. Soil Sci Soc Am J 64: 359-365
- Saini GR (1972) Seed germination and salt tolerance of crops in coastal alluvial soils of New Brunswick, Canada. Ecology 53: 524-525
- Sánchez-Calderón L, Ibarra-Cortés ME, Zepeda-Jazo I (2013) Root Development and Abiotic Stress Adaptation. In: Abiotic Stress -Plant Responses and Applications in Agriculture. Ed. Vahdati K, Leslie C, Publisher: InTech
- Sen DN, Kasera PK, Mohammed S (2002) Biology and physiology of saline plants. In: Pessarakli M (ed) Handbook of Plant and Crop Physiology. 2d Ed. Revised and Expanded. Marcel Dekker, Inc. New York
- Shabala S (2000) Ionic and osmotic components of salt stress specifically modulate net ion fluxes from bean leaf mesophyll. Plant Cell Environ 23: 825-837
- Sharpe PJH, De Michele DW (1977) Reaction kinetics of poikilotherm development. J Theor Biol 64: 649-670
- Steppuhn H, Wall KG (1997) Grain yields from spring-sown Canadian wheats grown in saline rooting media. Can J Plant Sci 77: 63-68
- Steppuhn H, van Genuchten MT, Grieve CM (2005) Root-zone salinity. I. Selecting a product-yield index and response functions for crop tolerance. Crop Science 45: 209-220
- van Genuchten MT (1983) Analyzing crop salt tolerance data: model description and user's manual. Research Report 120. USDA-ARS-USSL, Riverside, California
- van Genuchten MT, Gupta SK (1993) A reassessment of the crop tolerance response function. J Indian Soc Soil Sci 41: 730-737
- West G, Brown J, Enquist B (1997) A general model for the origin of allometric scaling laws in biology. Science 276: 122-126
- Yadav S, Irfan M, Ahmad A, Hayat H (2011) Causes of salinity and plant manifestations to salt stress: A review. J Environ Biol 32: 667-685
- Yan W, Hunt LA (1999) An equation for modelling the temperature response of plants using only the cardinal temperatures. Ann Bot 84: 607-614
- Zhang H-X, Tian Y, Zhou D-W, Zheng W, Wang M-L (2012) Research on modeling germination response to salinity of barley seeds. Chinese Journal of Plant Ecology 36: 849-858
