Nonlinear analysis of EEG dynamics in different epilepsy states using lagged Poincaré maps

Author: Seyyed Abed Hosseini
Journal: International Journal of Image, Graphics and Signal Processing @ijigsp
Article in issue: 8 vol.10, 2018.
Free access
The Poincaré map and its width and length are known as a criterion for short-term variations of electroencephalogram (EEG) signals. This study evaluates the effect of time delay on changes in the width of the Poincaré map in the EEG signal during different epilepsy states. The Poincaré map is quantified by measuring the standard deviation over (SD1) and the standard deviation over (SD2). Poincaré maps are drawn with one to six delay in three sets, including normal, inter-ictal, and ictal. The results indicate that the width of the Poincaré map increases with increasing latency in the ictal state. During ictal state, the width of the Poincaré map is achieved by applying a unit delay of 102 ± 8.7 and a six-unit delay of 305 ± 13.6. The Poincaré map is shifted to lower values during ictal state. Also, the results indicate that with increasing delay in the ictal state, the increasing rate of SD1 value is higher than the previous ones, such as inter-ictal and normal. The Poincaré map of the EEG signal can discover the meaningful changes in the different epilepsy states.
Electroencephalogram, Epilepsy, Lagged Poincaré map, Nonlinear analysis
Short address: https://sciup.org/15015989
IDR: 15015989 | DOI: 10.5815/ijigsp.2018.08.07
Text of the scientific article Nonlinear analysis of EEG dynamics in different epilepsy states using lagged Poincaré maps
Published Online August 2018 in MECS
Epilepsy, also known as seizure disorder, is a fairly common neurological disorder and is ranked second after stroke, which affects over 50 million people worldwide [1]. The diagnosis of epilepsy or seizure allows the choice of surgical treatment or medicine [2]. The electroencephalogram (EEG) signal is a non-invasive approach and widely available biomedical modality that can provide valuable information about epilepsy-related disorders [3], [4]. The identification of epileptic seizures in the EEG signals is an important part of today’s research [5], [6]. The features derived from EEG signals [3], [4], [7], [8] can be used for discrimination of epileptic seizures.
The representation of the phase-space is one of methods that provides an approach to analyze the dynamic behavior of a system. The standard Poincaré map (first-return map) is an interesting and simple nonlinear method, where a signal is plotted against itself after a time delay [9]. A lagged Poincaré map (multiple lag correlation) is a scatter plot where a timed signal is plotted against itself after lag samples.
Various nonlinear approaches have been used to understand the dynamical changes in the information processing [3], [8], [10]. Goit et al. proposed [11] a Poincaré map analysis of heart rate variability (HRV) in control subjects in comparison with patients with diagnosed epilepsy. Ali et al. based on Poincaré analysis presented [12] children with epilepsy may be particularly susceptible to seizure-induced arrhythmias. Moridani and Farhadi used [13] HRV signal as a biomarker for epilepsy seizure prediction using Poincaré map. The results show that the HRV contains valuable information and can be used as an epilepsy seizure predictor.
Selvakumari and Mahalakshmi proposed [14] a seizure recognition by analyzing high dimensional phase-space using Poincaré section. The CHB-MIT database is used for 23 subjects of different age groups. Their results obtained 96.77% accuracy, 95.011% sensitivity, and 97.97% selectivity. Sharif and Jafari proposed [15] an optimum Poincaré map for extracting significant samples from EEG signals in different epilepsy states. The optimum Poincaré plane is achieved with more than 99% data information transferred.
Kamalizonouzi proposed [16] an optimal inertial sensor placement to detect seizure episodes in patients. The results show that the modified Poincaré map can be an effective method for seizure detection. Amiri et al. proposed [1] a bifurcation analysis of intracranial EEG signals in patients with temporal lobe epilepsy (TLE) using Poincaré map. They proposed that the Poincaré map is a suitable candidate for evaluating the dynamics of neural tissue.
Zabihi et al. [17] proposed an EEG phase space representation via time-delay embedding approach and Poincaré section for patient-specific seizure detection. The phase spaces were reduced by principal component analysis (PCA) before being fed to Naive Bayesian and linear discriminant analysis (LDA). Their results showed 93.21% specificity and 88.27% sensitivity in seizure detection. Sharif and Jafari proposed [18] an epileptic seizures prediction from EEG signal using analysis of ictal rules on a Poincaré map. Their proposed method had an ability in extracting good features from EEG signal.
Ronkainen et al. proposed [19] a measurement of inter-ictal circadian heart rate (HR) dynamics in patients with TLE. The results show that TLE is associated with diminished HR variability. Kamath proposed [20] an approach based on Hilbert transform scatter plots (HTSPs) for the analysis of EEG dynamics in normal subjects and epileptic patients. The results showed the appropriateness of applying the nonlinear method for data analysis. Jeppesen et al. proposed [21] an algorithm for epileptic seizures detection with a modified HR variability based on Lorenz/Poincaré plot. Suorsa et al. proposed [22] long-term changes in inter-ictal HRV dynamics in patients with TLE using Poincaré map. The results show that after the follow-up, the standard deviation over X 1 (SD1) and the standard deviation over X 2 (SD2)
features were decreased in refractory TLE patients compared to baseline.
This paper employs a lagged Poincaré map for detection of different epilepsy states. The Poincaré map and its width and length are known as a criterion for short-term variations of EEG signals. This study evaluates the effect of time-delay on changes in the width of the Poincaré map in the EEG signal during different epilepsy states.
The organization of the paper is as follows. In Section II, the EEG dataset description and the proposed approach based on lagged Poincaré map are explained. In Section III, the qualitative results are presented. In Section IV, the discussions are presented. Finally, the conclusion is given in the last section.
-
II. Materials and Methods
The proposed approach includes the description of data and lagged Poincaré Mapping. In the following, these two steps are briefly described.
-
A. Data description
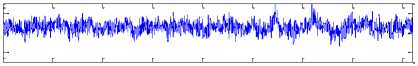
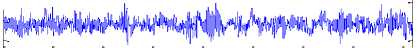
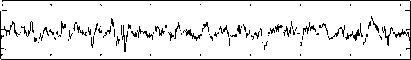
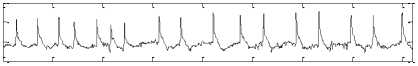
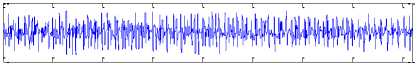
The Bonn University EEG database, described by Andrzejak et al. [23], is from three states: normal, inter-ictal, and ictal (epileptic). Fig. 1 shows sample normal, inter-ictal, and ictal EEG signals. The EEG database is categorized into five sets (denoted A-E) that each of them contains 100 single channel EEG segments of 23.6 s duration and sampled at 173.61 Hz (each data segment has 4096 samples).
The participants were in awake and relaxed states with their eyes open for set A and eyes closed for set B, respectively. Sets C and D contained only activity measured during inter-ictal state. Finally, set E contained only seizure attack activity (ictal state). For more details refer to [9], [23].
Set A
-200
0 500 1000 1500 2000 2500 3000 3500 4000
Set B
-200
0 500 1000 1500 2000 2500 3000 3500 4000
Set C
-200
0 500 1000 1500 2000 2500 3000 3500 4000
Set D
-500
0 500 1000 1500 2000 2500 3000 3500 4000
Set E
B.
0 500 1000 1500 2000 2500 3000 3500 4000
Samples
Fig.l. Illustration of the EEG signals.
-2000
Lagged Poincaré map
Henri Poincaré developed a set of system states defined over time [24]. Poincaré map is a well-known approach for analyzing the type of attractors. The Poincaré map is a nonlinear representation of a signal in a Cartesian plane [25] and used to quantify self-similarity [26]. The Poincaré map is known as a criterion for shortterm variations of the biomedical signal. A phase space allows studying variations in a signal only with respect to itself.
A standard Poincaré map (first-return one-dimensional map) is a scatter plot (two- or three-dimensional graphical representation) in which a timed signal X is plotted against its delayed version X [20]. The line-of-identity (the diagonal line) is the 0 = n /4rad imaginary diagonal line on the Poincaré map and the points falling on this line has the property X = X P A lagged Poincaré map (multiple lag correlation) is a scatter plot where a timed signal X is plotted against its delayed version X [20]. The lagged Poincaré map can prepare more information about the behavior of signal than the standard Poincaré map [27]. This coordinate system is transformed by a two-dimensional rotation with the same angle 0 with respect to X -axis. The transform is given by x1
x 2
cos 9 - sin 9 xn sin9 cos9 J_xn+lag
SD1 and SD2 parameters represent the magnitude of the width (minor axis) and length (major axis) axes of the ellipse, respectively. SD1 and SD2 can be defined as (3),
For 9 =
n
4 :
SD 1 = 7 var( X 1)
SD 2 = 4 var( X 2)
x 1
x
i i
V2 _ i
-i
x n + lag
where var( X ) is the variance of X [29]. For more details see [30].
The scatter pattern of Poincaré map reflects the randomness and variability in the signals. To construct the phase space, one of the most interesting representations is allowing a signal to be analyzed along with its evolution in time as shown in Fig. 2.
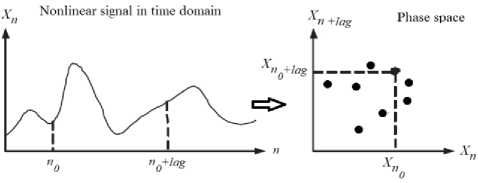
Fig.2. Phase space construction example. The lagged Poincaré map is a nonlinear analytical approach in which a timed signal is plotted against itself after lag samples.
The Poincaré map of a random signal shows around oval pattern [28]. Poincaré maps of EEG signals are constructed from 6 s epochs of the signal. The time lag is set to 1/173.61 s (i.e. 1/173.61 s, about 6 ms). The Poincaré map is evaluated quantitatively through the computation of the SD indexes of the map, which can be obtained by best-fitting an oval to the plot shape as shown in Fig. 3. The extracted parameters are the intersection of the lines X 1 and X 2 (centroid), SD1, SD2, and SD1/SD2.
-
III. Results
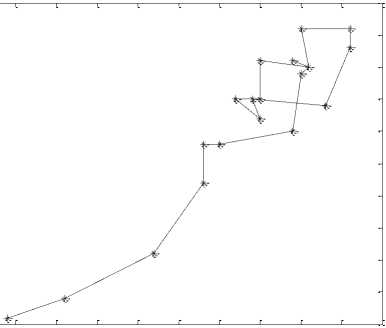
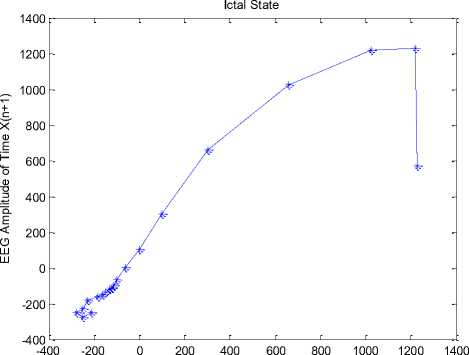
Simulations have been done in MATLAB. Fig. 4 shows the temporal dynamic of 20 points of similar intervals of a record in (a) normal, (b) inter-ictal, and (c) ictal. Fig. 4(a) shows the chaotic behavior of the EEG signal in the normal state. Figs. 4(b) and 4(c) show the behavior of EEG signals in inter-ictal and ictal, respectively, as well as the movement towards the order.
-50
-100
-150
-150
D2
E
E
О
Inter-ictal State
-15
-20
-25
-30
-35
-40
-45
-50
-55
-60
(b) Inter-ictal state
-65 -60 -55 -50 -45 -40 -35 -30 -25 -20 -15
EEG Amplitude of Time X(n)
-65
-100 -50 0
50 100 150 200 250
EEG Amplitude of Time X(n)
Fig.3. Standard Poincaré map with a unit delay (lag-1) from a sample EEG signal. The values of SD1 and SD2 indicate the distribution of points on the width and length elliptical axis, respectively.
(a) Normal state
EEG Amplitude of Time X(n)
(c) Ictal state
Fig.4. The temporal dynamic of 20 points from similar intervals of a record in (a) normal state, (b) inter-ictal state, and (c) ictal state.
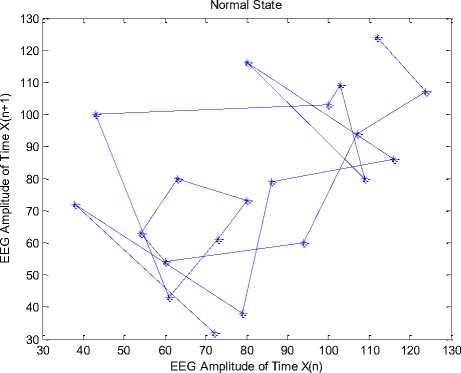
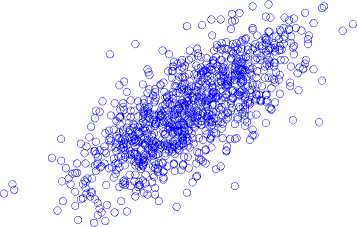
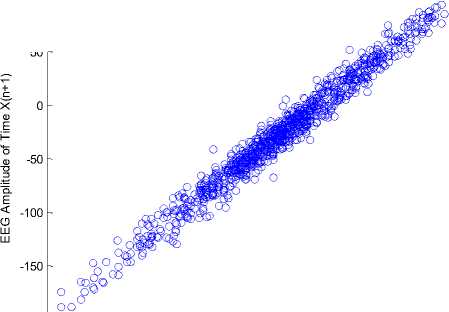
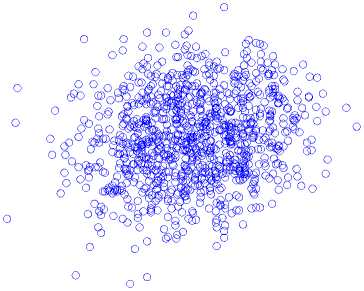
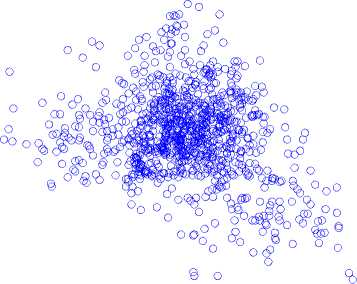
The standard Poincaré map with a unit delay of a record for a single brain signal segment is presented in Fig. 5, for (a) normal state, (b) inter-ictal state, and (c) ictal state. During ictal state, the width of the Poincaré map is achieved by applying a unit delay of 8.1 ± 1.2 and a six-unit delay of 15.9 ± 0.8. The results indicate that the width of the Poincaré map increases with increasing latency during the ictal state.
-50
Normal State
8 °
-100
-150
-150
-100 -50 0 50 100 150 200
EEG Amplitude of Time X(n)
(a) Normal state
Inter-ictal State
-50
-100
-150
-100
-50
EEG Amplitude of Time X(n)
(b) Inter-ictal state
-200
-200
X
Е
-500
Е
-1000
Ictal State
-1500
-2000 -1500 -1000 -500 0 500 1000 1500
EEG Amplitude of Time X(n)
(c) Ictal state
Fig.5. Standard Poincaré map with a unit delay from an EEG segment, (a) normal state, (b) inter-ictal state, and (c) ictal state.
As shown in Fig. 5, there are significant differences between Poincaré maps in terms of width and length of the plan. Also, during the ictal state, the shape points of the Poincaré map have been reduced to lesser values. The Poincaré map with a delay of one to six (1-6) for the EEG signals is calculated, and the width of Poincaré maps in each delay is calculated.
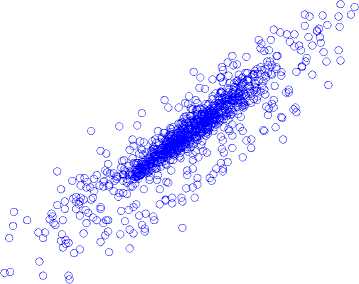
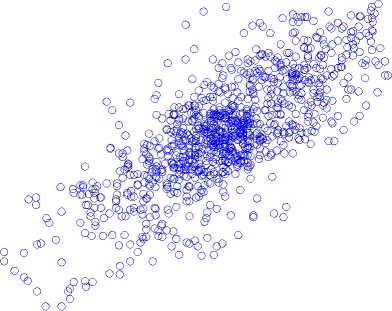
Poincaré map with lag-6 in (a) normal state, (b) inter-ictal state, and (c) ictal state is shown in Fig. 6.
-50
-100
Normal State
150 200
calculated. During ictal, the width of the Poincaré map is achieved by applying a unit delay of 102 ± 8.7 and a six-unit delay of 305 ± 13.6.
-150 -100 -50 0 50 100
EEG Amplitude of Time X(n)
(a) Normal state
Inter-ictal State
-50
-100
-150
-200 -150 -100 -50 0 50 100
EEG Amplitude of Time X(n)
The Poincaré map idea is interesting because it describes a global perspective on the dynamics of neural tissue, which may make more accurate models [1]. We performed geometrical analysis that is commonly used in neuroscience. When the state-space method is used to analyze the EEG signal, the suitable embedding dimension should be selected to achieve the useful information. Although some approaches for estimating the embedding dimension have been proposed, it is not possible to accurately determine the optimal dimensions because the dimensionality of the attractor is not constant and is usually unknown for experimental data, which follows the dynamic of the time course.
Researchers have shown interest in maps with different time-delays to achieve a better view into the signal. Usually, the time-delay is multiple of the sampling time or the cycle length of the signal [31]. This research has investigated the effect of increasing the delay in the Poincaré map on EEG signal in different epileptic states. In the Poincaré map, SD1 and SD2 are significantly less in patients with epilepsy. The width of the Poincaré map increases with increasing latency. The results show that in various epileptic states, Poincaré maps with different delays have different shapes. The Poincaré map is also shifted to lower values during ictal state. It is also shown that with increasing delay in the ictal state, the increasing rate of SD1 value is higher than the previous ones, such as inter-ictal and normal.
X
Е
0 ъ
-500
Е
-1000
(b) Inter-ictal state
Ictal State
-1500
-2000 t,-------------[-------------[-------------[-------------Е-------------Е-------------Е-------------[
-2000 -1500 -1000 -500 0 500 1000 1500
EEG Amplitude of Time X(n)
(c) Ictal state
Fig.6. A Poincaré map with lag-6 in (a) normal state, (b) inter-ictal state, and (c) ictal state.
The quantitative descriptors SD1 and SD2 are used to compare the results obtained from the different epilepsy states. Poincaré maps with six lags (1-6) are constructed, and the width of the Poincaré map for each lag is
The simplicity of calculating the width of the Poincaré map and its adaptation to the chaotic nature of vital signals can be useful for evaluating the brain signal in different states of epilepsy. During ictal, the width of the Poincaré map is achieved by applying a unit delay of 102 ± 8.7 and a six-unit delay of 305 ± 13.6. Specifically, the analysis of data has shown that the proposed lagged Poincaré map can be an effective tool for detecting different epilepsy states.
-
[1] M. Amiri, E. Davoodi-Bojd, F. Bahrami, and M. Raza, “Bifurcation analysis of the Poincaré map function of intracranial EEG signals in temporal lobe epilepsy patients,” Mathematics and Computers in Simulation , vol. 81, no. 11, pp. 2471–2491, 2011.
-
[2] S. Dehuri, A. K. Jagadev, and S.-B. Cho, “Epileptic seizure identification from electroencephalography signal using DE-RBFNs ensemble,” Procedia Computer Science , vol. 23, pp. 84–95, 2013.
-
[3] S. A. Hosseini, M. R. Akbarzadeh-T, and M. B. Naghibi-Sistani, “Qualitative and Quantitative Evaluation of EEG Signals in Epileptic Seizure Recognition,” International
Journal of Intelligent Systems and Applications , vol. 6, pp. 41–46, 2013.
-
[4] S. A. Hosseini, “Epilepsy Recognition by Higher Order Spectra Analysis of EEG Signals,” In M. Khosrow-Pour (Ed.), Encyclopedia of Information Science and Technology, Third Edition, 2015.
-
[5] R. B. Pachori and S. Patidar, “Epileptic seizure classification in EEG signals using second-order difference plot of intrinsic mode functions,” Computer methods and programs in biomedicine , vol. 113, no. 2, pp. 494–502, 2014.
-
[6] S. A. Hosseini, M.-R. Akbarzadeh-T, and M.-B. Naghibi-Sistani, “Methodology for Epilepsy and Epileptic Seizure Recognition using Chaos Analysis of Brain Signals,” In K. Kolomvatsos, C. Anagnostopoulos, and S. Hadjiefthymiades (Eds.), Intelligent Technologies and Techniques for Pervasive Computing , p. 20, 2013.
-
[7] S. A. Hosseini, “Quantification of EEG signals for evaluation of emotional stress level,” MSc Thesis, Biomedical Department, Faculty of Engineering, Mashhad Branch, Islamic Azad University, 2009.
-
[8] S. A. Hosseini, “Epilepsy recognition using chaotic analysis of EEG signals based on qualitative and quantitative evaluation,” Advances in Cognitive Science , pp. 43–55, 2015.
-
[9] J. D. Bolaños et al. , “Assessment of sedation-analgesia by means of poincaré analysis of the electroencephalogram,” in Engineering in Medicine and Biology Society (EMBC), 2016 IEEE 38th Annual International Conference of the , 2016, pp. 6425–6428.
-
[10] S. A. Hosseini and M. A. Khalilzadeh, “Emotional stress recognition system using EEG and psychophysiological signals: Using new labelling process of EEG signals in emotional stress state,” International Conference on in Biomedical Engineering and Computer Science ( ICBECS ), pp. 1–6, 2010.
-
[11] R. K. Goit, S. K. Jha, and B. N. Pant, “Alteration of cardiac autonomic function in patients with newly diagnosed epilepsy,” Physiological reports , vol. 4, no. 11, p. e12826, 2016.
-
[12] W. Ali, B. A. Bubolz, L. Nguyen, D. Castro, J. Coss-Bu, M. M. Quach, C. E. Kennedy, A. E. Anderson, and Y. C. Lai, “Epilepsy is associated with ventricular alterations following convulsive status epilepticus in children,” Epilepsia Open , vol. 2, no. 4, pp. 432-440, 2017 .
-
[13] M. K. Moridani and H. Farhadi, “Heart rate variability as a biomarker for epilepsy seizure prediction,” Clinical Study , vol. 3, p. 8, 2017.
-
[14] R. S. Selvakumari and M. Mahalakshmi, “Epileptic seizure detection by analyzing high dimensional phase space via Poincaré section,” Multidimensional Systems and Signal Processing , pp. 1–11, 2018.
-
[15] B. Sharif and A. H. Jafari, “Design of an optimum Poincaré plane for extracting meaningful samples from EEG signals,” Australasian physical & engineering sciences in medicine , vol. 41, no. 1, pp. 13–20, 2018.
-
[16] B. Kamalizonouzi, “Optimal Inertial Sensor Placement and Motion Detection for Epileptic Seizure Patient Monitoring,” MSc thesis, The University of Western Ontario, 2012.
-
[17] M. Zabihi, S. Kiranyaz, A. B. Rad, A. K. Katsaggelos, M. Gabbouj, and T. Ince, “Analysis of high-dimensional phase space via Poincaré section for patient-specific
seizure detection,” IEEE Transactions on Neural Systems and Rehabilitation Engineering , vol. 24, no. 3, pp. 386– 398, 2016.
-
[18] B. Sharif and A. H. Jafari, “Prediction of epileptic seizures from EEG using analysis of ictal rules on Poincaré plane,” Computer Methods and Programs in Biomedicine , vol. 145, pp. 11–22, 2017.
-
[19] E. Ronkainen, H. Ansakorpi, H. V. Huikuri, V. V. Myllylä, J. I. T. Isojärvi, and J. T. Korpelainen,
“Suppressed circadian heart rate dynamics in temporal lobe epilepsy,” Journal of Neurology, Neurosurgery & Psychiatry , vol. 76, no. 10, pp. 1382–1386, 2005.
-
[20] C. Kamath, “Analysis of EEG Dynamics in Epileptic Patients and Healthy Subjects Using Hilbert Transform Scatter Plots,” Open Access Library Journal , vol. 2, no. 1, p. 1, 2015.
-
[21] J. Jeppesen, S. Beniczky, P. Johansen, P. Sidenius, and A. Fuglsang-Frederiksen, “Detection of epileptic seizures with a modified heart rate variability algorithm based on Lorenz plot,” Seizure , vol. 24, pp. 1–7, 2015.
-
[22] E. Suorsa et al. , “Heart rate dynamics in temporal lobe epilepsy—a long-term follow-up study,” Epilepsy Research , vol. 93, no. 1, pp. 80–83, 2011.
-
[23] R. G. Andrzejak, K. Lehnertz, F. Mormann, C. Rieke, P. David, and C. E. Elger, “Indications of nonlinear deterministic and finite-dimensional structures in time series of brain electrical activity: Dependence on recording region and brain state,” Physical Review E , vol. 64, no. 6, p. 061907, 2001.
-
[24] H. Poincaré, New methods of celestial mechanics , vol. 13. Springer Science & Business Media, 1992.
-
[25] C. K. Karmakar, A. H. Khandoker, J. Gubbi, and M. Palaniswami, “Complex Correlation Measure: a novel descriptor for Poincaré plot,” Biomedical engineering online , vol. 8, no. 1, p. 17, 2009.
-
[26] P. Castiglioni, C. Cerutti, M. di Rienzo, J. L. Elghozi, and N. Honzikova, “Glossary of terms used in time series analysis of cardiovascular data,” Working Group on Blood Pressure and Heart Rate Variability of the European Society of Hypertension , 2005.
-
[27] A. Brignol, T. Al-Ani, and X. Drouot, “Phase space and power spectral approaches for EEG-based automatic sleep–wake classification in humans: A comparative study using short and standard epoch lengths,” Computer methods and programs in biomedicine , vol. 109, no. 3, pp. 227–238, 2013.
-
[28] K. Hayashi, N. Mukai, and T. Sawa, “Poincaré analysis of the electroencephalogram during sevoflurane anesthesia,” Clinical Neurophysiology , vol. 126, no. 2, pp. 404–411, 2015.
-
[29] M. Rhaman, A. H. M. Karim, M. Hasan, and J. Sultana, “Successive RR Interval Analysis of PVC with Sinus Rhythm Using Fractal Dimension, Poincaré plot and Sample Entropy Method‖,” IJ Image, Graphics and Signal Processing , vol. 2, pp. 17–24, 2013.
-
[30] M. Fishman et al. , “A method for analyzing temporal patterns of variability of a time series from Poincare plots,” Journal of Applied Physiology , vol. 113, no. 2, pp. 297– 306, 2012.
-
[31] M. Brennan, M. Palaniswami, and P. Kamen, “Do existing measures of Poincare plot geometry reflect nonlinear features of heart rate variability?,” IEEE transactions on biomedical engineering , vol. 48, no. 11, pp. 1342–1347, 2001.
References Nonlinear analysis of EEG dynamics in different epilepsy states using lagged Poincaré maps
- M. Amiri, E. Davoodi-Bojd, F. Bahrami, and M. Raza, “Bifurcation analysis of the Poincaré map function of intracranial EEG signals in temporal lobe epilepsy patients,” Mathematics and Computers in Simulation, vol. 81, no. 11, pp. 2471–2491, 2011.
- S. Dehuri, A. K. Jagadev, and S.-B. Cho, “Epileptic seizure identification from electroencephalography signal using DE-RBFNs ensemble,” Procedia Computer Science, vol. 23, pp. 84–95, 2013.
- S. A. Hosseini, M. R. Akbarzadeh-T, and M. B. Naghibi-Sistani, “Qualitative and Quantitative Evaluation of EEG Signals in Epileptic Seizure Recognition,” International Journal of Intelligent Systems and Applications, vol. 6, pp. 41–46, 2013.
- S. A. Hosseini, “Epilepsy Recognition by Higher Order Spectra Analysis of EEG Signals,” In M. Khosrow-Pour (Ed.), Encyclopedia of Information Science and Technology, Third Edition, 2015.
- R. B. Pachori and S. Patidar, “Epileptic seizure classification in EEG signals using second-order difference plot of intrinsic mode functions,” Computer methods and programs in biomedicine, vol. 113, no. 2, pp. 494–502, 2014.
- S. A. Hosseini, M.-R. Akbarzadeh-T, and M.-B. Naghibi-Sistani, “Methodology for Epilepsy and Epileptic Seizure Recognition using Chaos Analysis of Brain Signals,” In K. Kolomvatsos, C. Anagnostopoulos, and S. Hadjiefthymiades (Eds.), Intelligent Technologies and Techniques for Pervasive Computing, p. 20, 2013.
- S. A. Hosseini, “Quantification of EEG signals for evaluation of emotional stress level,” MSc Thesis, Biomedical Department, Faculty of Engineering, Mashhad Branch, Islamic Azad University, 2009.
- S. A. Hosseini, “Epilepsy recognition using chaotic analysis of EEG signals based on qualitative and quantitative evaluation,” Advances in Cognitive Science, pp. 43–55, 2015.
- J. D. Bolaños et al., “Assessment of sedation-analgesia by means of poincaré analysis of the electroencephalogram,” in Engineering in Medicine and Biology Society (EMBC), 2016 IEEE 38th Annual International Conference of the, 2016, pp. 6425–6428.
- S. A. Hosseini and M. A. Khalilzadeh, “Emotional stress recognition system using EEG and psychophysiological signals: Using new labelling process of EEG signals in emotional stress state,” International Conference on in Biomedical Engineering and Computer Science (ICBECS), pp. 1–6, 2010.
- R. K. Goit, S. K. Jha, and B. N. Pant, “Alteration of cardiac autonomic function in patients with newly diagnosed epilepsy,” Physiological reports, vol. 4, no. 11, p. e12826, 2016.
- W. Ali, B. A. Bubolz, L. Nguyen, D. Castro, J. Coss-Bu, M. M. Quach, C. E. Kennedy, A. E. Anderson, and Y. C. Lai, “Epilepsy is associated with ventricular alterations following convulsive status epilepticus in children,” Epilepsia Open, vol. 2, no. 4, pp. 432-440, 2017.
- M. K. Moridani and H. Farhadi, “Heart rate variability as a biomarker for epilepsy seizure prediction,” Clinical Study, vol. 3, p. 8, 2017.
- R. S. Selvakumari and M. Mahalakshmi, “Epileptic seizure detection by analyzing high dimensional phase space via Poincaré section,” Multidimensional Systems and Signal Processing, pp. 1–11, 2018.
- B. Sharif and A. H. Jafari, “Design of an optimum Poincaré plane for extracting meaningful samples from EEG signals,” Australasian physical & engineering sciences in medicine, vol. 41, no. 1, pp. 13–20, 2018.
- B. Kamalizonouzi, “Optimal Inertial Sensor Placement and Motion Detection for Epileptic Seizure Patient Monitoring,” MSc thesis, The University of Western Ontario, 2012.
- M. Zabihi, S. Kiranyaz, A. B. Rad, A. K. Katsaggelos, M. Gabbouj, and T. Ince, “Analysis of high-dimensional phase space via Poincaré section for patient-specific seizure detection,” IEEE Transactions on Neural Systems and Rehabilitation Engineering, vol. 24, no. 3, pp. 386–398, 2016.
- B. Sharif and A. H. Jafari, “Prediction of epileptic seizures from EEG using analysis of ictal rules on Poincaré plane,” Computer Methods and Programs in Biomedicine, vol. 145, pp. 11–22, 2017.
- E. Ronkainen, H. Ansakorpi, H. V. Huikuri, V. V. Myllylä, J. I. T. Isojärvi, and J. T. Korpelainen, “Suppressed circadian heart rate dynamics in temporal lobe epilepsy,” Journal of Neurology, Neurosurgery & Psychiatry, vol. 76, no. 10, pp. 1382–1386, 2005.
- C. Kamath, “Analysis of EEG Dynamics in Epileptic Patients and Healthy Subjects Using Hilbert Transform Scatter Plots,” Open Access Library Journal, vol. 2, no. 1, p. 1, 2015.
- J. Jeppesen, S. Beniczky, P. Johansen, P. Sidenius, and A. Fuglsang-Frederiksen, “Detection of epileptic seizures with a modified heart rate variability algorithm based on Lorenz plot,” Seizure, vol. 24, pp. 1–7, 2015.
- E. Suorsa et al., “Heart rate dynamics in temporal lobe epilepsy—a long-term follow-up study,” Epilepsy Research, vol. 93, no. 1, pp. 80–83, 2011.
- R. G. Andrzejak, K. Lehnertz, F. Mormann, C. Rieke, P. David, and C. E. Elger, “Indications of nonlinear deterministic and finite-dimensional structures in time series of brain electrical activity: Dependence on recording region and brain state,” Physical Review E, vol. 64, no. 6, p. 061907, 2001.
- H. Poincaré, New methods of celestial mechanics, vol. 13. Springer Science & Business Media, 1992.
- C. K. Karmakar, A. H. Khandoker, J. Gubbi, and M. Palaniswami, “Complex Correlation Measure: a novel descriptor for Poincaré plot,” Biomedical engineering online, vol. 8, no. 1, p. 17, 2009.
- P. Castiglioni, C. Cerutti, M. di Rienzo, J. L. Elghozi, and N. Honzikova, “Glossary of terms used in time series analysis of cardiovascular data,” Working Group on Blood Pressure and Heart Rate Variability of the European Society of Hypertension, 2005.
- A. Brignol, T. Al-Ani, and X. Drouot, “Phase space and power spectral approaches for EEG-based automatic sleep–wake classification in humans: A comparative study using short and standard epoch lengths,” Computer methods and programs in biomedicine, vol. 109, no. 3, pp. 227–238, 2013.
- K. Hayashi, N. Mukai, and T. Sawa, “Poincaré analysis of the electroencephalogram during sevoflurane anesthesia,” Clinical Neurophysiology, vol. 126, no. 2, pp. 404–411, 2015.
- M. Rhaman, A. H. M. Karim, M. Hasan, and J. Sultana, “Successive RR Interval Analysis of PVC with Sinus Rhythm Using Fractal Dimension, Poincaré plot and Sample Entropy Method‖,” IJ Image, Graphics and Signal Processing, vol. 2, pp. 17–24, 2013.
- M. Fishman et al., “A method for analyzing temporal patterns of variability of a time series from Poincare plots,” Journal of Applied Physiology, vol. 113, no. 2, pp. 297–306, 2012.
- M. Brennan, M. Palaniswami, and P. Kamen, “Do existing measures of Poincare plot geometry reflect nonlinear features of heart rate variability?,” IEEE transactions on biomedical engineering, vol. 48, no. 11, pp. 1342–1347, 2001.
