Nonlinear Analysis of Human Gait Signals

Author: Atefeh Goshvarpour, Ateke Goshvarpour
Journal: International Journal of Information Engineering and Electronic Business(IJIEEB) @ijieeb
Article in issue: 2 vol.4, 2012.
Free access
Nonlinear dynamics has been introduced to the analysis of biological data and increasingly recognized to be functionally relevant. The aim of this study is to evaluate nonlinear and chaotic dynamics of gait signals. For this purpose, we analyzed gait data in ten healthy subjects who walked for an hour at their usual, slow and fast paces. Poincare plots, Hurst Exponents and the Lyapunov Exponents of gait signals were calculated. The results show that the Hurst Exponents are significantly increased during slow and fast paces. For all subjects, the Lyapunov Exponents are increased during normal gait, which indicates that signals are more chaotic. This can be due to decreased nonlinear interaction of variables in slow and fast paces. The finite values of Hurst Exponents and positive values of Lyapunov Exponents suggest that all of gait signals have low dimensional chaos. In addition, the complexity of signals is decreased during slow and fast gait. Results are useful for the early diagnosis of common gait pathologies.
Gait cycles, Hurst Exponent, Lyapunov Exponent, Nonlinear Dynamics, Poincare Plots
Short address: https://sciup.org/15013118
IDR: 15013118
Text of the scientific article Nonlinear Analysis of Human Gait Signals
Published Online April 2012 in MECS
Gait analysis is the systematic measurement, description, and assessment of quantities that characterize human locomotion; more simply put, it is the evaluation of a subject's walking pattern. A standard physical examination cannot provide a complete description of the complex pathology of abnormal human gait. Gait analysis can. In the treatment of neuromuscular disorders such as cerebral palsy, precise assessment enables the surgeon to assess all the pathological components of gait and to carry out all the operations required for their correction during the same anesthesia session. This saves money, avoids unnecessary pain and inconvenience, and eliminates the need for more than one postoperative period of rehabilitation [1].
The walking pattern is studied as a gait cycle,
Heel Strike Toe Off Heel Strike
-
Figure 1. The gait cycle extended from heel strike to heel strike of one leg. It consists of stance phase and swing phase.
In healthy adults, gait appears to be relatively unvarying. That is, during steady-state walking, each stride looks like an identical copy of the one before. To a large degree, this is correct. However, closer examination reveals small and subtle stride-to-stride changes in the gait pattern, even in healthy young adults [3].
Walking is a complex process which we have only recently begun to understand through the application of nonlinear data processing techniques [2-7] to study interval data.
Human locomotion is known to be a voluntary process, but it is also regulated through a network of neurons called a central pattern generator (CPG) [8], capable of producing a syncopated output.
The assessment of gait cycles can provide valuable information about locomotion systems and control systems involved in their complex regulation.
Time series analysis of physiological parameters is usually performed in time and frequency domains by so called linear methods. In these methods, the nonperiodic oscillations are ignored and usually regarded as a noise [9].
Biological system components interact in a complex manner [10-12]. These interactions are not linear. Therefore, there is an effort to apply nonlinear analysis. In the work by Campbell and Bobick [13], phase space is employed to characterize body movements using a matching criterion to identify the motion. Van Emmerik et al. [14] in a tutorial overview, discuss how various seemingly simple human actions are the result of the interaction of complex systems. West and Scafetta [15] analyze the stride length of humans, which have been shown to be slightly multifractal, which can be modeled using nonlinear oscillators. Dingwell and Cusumano attempt to quantify local dynamic stability of human walking to identify subjects who were prone to falling [16]. This was done using chaotic measures.
Labini et al. [17] developed a new method for walking balance assessment measuring the complexity of head, trunk and pelvis three-dimensional accelerations and angular velocities during normal over ground locomotion by means of recurrence quantification analysis (RQA) in normal subjects and unilateral vestibular hypofunction (UVH) patients. Chang et al. [18] tested the hypothesis that treadmill walking without handrails would diminish the statistical persistence in an individual’s stride interval time series. The scaling exponent was employed in their study as a measure of the statistical persistence of the stride interval time series. Scafetta et al. [19] showed that the CPG of human locomotion can be modeled as a system of coupled nonlinear oscillators by estimating the local Holder exponents of the stride interval.
Nonlinear analysis such as Hurst Exponents, Lyapunov Exponents and phase space are able to provide information about a normal dynamical system and its clinically important applications (diagnosis, prognosis).
Basically, the largest Lyapunov exponent estimates the mean exponential divergence or convergence of nearby trajectories in phase space, expressing the well-known sensitive dependence to initial conditions in a nonlinear phenomenon [20-21]. Hurst Exponent is pointed to the self similar property of a system. Hence, they may serve as a good estimate of the chaoticity of a dynamical system. Therefore, in this study, we attempted to use important nonlinear quantities, phase space, the largest Lyapunov exponent and Hurst Exponent, to quantify gait signals.
In this study, the effects of several experimental conditions (normal, slow and fast paces) on gait properties are examined in order to probe common and feature-specific responses to these different gait properties.
The outline of this study is as follows. At first, we briefly describe the sets of data, which are used for this study. Then, we explain the phase space, Hurst Exponent and Lyapunov Exponents. Finally, we present the results of analysis of these features on data set, and we conclude the study.
-
II. Background
-
A. Data collection
To study the nonlinear properties, we analyzed gait data in ten subjects who walked for an hour at their usual, slow and fast paces [22]. Stride interval fluctuations were studied in ten young, healthy men. Participants had no history of any neuromuscular, respiratory or cardiovascular disorders, and were taking no medications.
Mean age was 21.7 years (range: 18-29 years). Height was 1.77 ± 0.08 meters (mean ± S.D.) and weight was 71.8 ± 10.7 kg. All subjects provided informed written consent.
Subjects walked continuously on level ground around an obstacle free, long (either 225 or 400 meters), approximately oval path and the stride interval was measured using ultra-thin, force sensitive switches taped inside one shoe.
-
B. Poincare Plot
A Poincare plot, named after Henri Poincare, is used to quantify a self-similarity in processes. Poincare plot is a geometrical representation of a time series in a Cartesian plane. A two dimensional plot constructed by plotting consecutive points is a representation of time series on phase space or Cartesian plane [23].
It shows variability of data and describes performance of the loco-motors system in controlling the foot at a critical event. Poincare plot with high correlation coefficients is attributed to a high level of control between strides; where as a low correlation shows less control since one stride is loosely affected by the previous stride. These plots were used to extract indexes such as length and width of the long and short axes of Poincare plots. The length of this plot corresponds to the level of long term variability, while the width of the plot indicates the level of short term variability [10,24]. A standard Poincare plot is shown in Fig. 2.
Two basic descriptors of the plot are SD 1 and SD 2 . The line of identity is the 45° imaginary diagonal line on the Poincare plot and the points falling on the imaginary line has the property X n = X n+1 . SD 1 measures the dispersion of points perpendicular to the line of identity, whereas SD 2 measures the dispersion along the line of identity.
Fundamentally, SD 1 and SD 2 of Poincare plot is directly related to the basic statistical measures, standard deviation of time series (SDX), and standard deviation of the successive difference of time series (SDSD), which is given by the relation shown in equation (1) and equation (2).
Sd 1 = -2 SDSD 2 = y x (0) - Y X (1)
SD 2 = 2 SDX 2 - 1 SDSD 2 = Y X (0) + Y X (1) - 2 X 2
Where γ X (0) and γ X (1) is the autocorrelation function for lag 0 and lag 1 data interval and X is the mean of time series intervals. From equations (1) and (2), it is clear that the measures SD 1 and SD 2 are actually derived from the correlation and mean of the time series with lag 0 and lag 1.
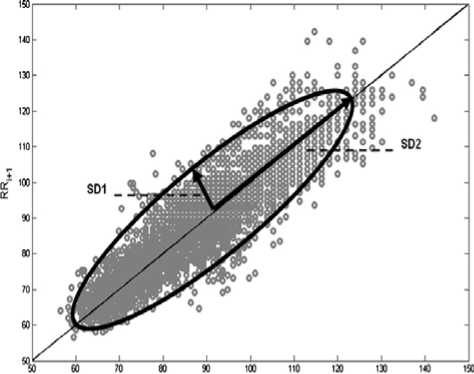
Figure 2. A standard Poincare plot (lag-1) SD 1 and SD 2 represent the dispersion along minor and major axis of the fitted ellipse [24].
The above equation sets are derived for unit time delay Poincare plot. Researchers have shown interest in plots with different time delays to get a better insight in the time-series signal. Usually the time delay is multiple of the cycle length or the sampling time of the signal [25]. The dependency among the variables is controlled by the choice of time delay, and the most conventional analysis is performed with higher order linear correlation between points.
In case of plotting the 2D phase space with lag m the equations for SD 1 and SD 2 can be represented as:
SD 1 = Y x (0) - Y x ( m )
^ SD 1 = F ( Y x (0) , Y x ( m )) SD 2 = Y x (0) + Y x ( m ) - 2 X" ^ SD 2 = F ( y x (0), Y x ( m ))
where γX (m) is the autocorrelation function for lag m time series. This implies that the standard descriptors for any arbitrary m lag Poincare plot is a function of autocorrelation of the signal at lag 0 and lag m.
-
C. Hurst exponent
The Hurst exponent is used as a measure of the long term memory of time series. It relates to the autocorrelations of the time series and the rate at which these decrease as the lag between pairs of values increases. Studies involving the Hurst exponent were originally developed in hydrology for the practical matter of determining optimum dam sizing for the Nile River's volatile rain and drought conditions that had been observed over a long period of time [26]. The name "Hurst exponent" or Hurst coefficient derives from Harold Edwin Hurst (1880–1978), who was the lead researcher in these studies, and the use of the standard notation H for the coefficient relates to this name also.
The Hurst exponent is a measure that has been widely used to evaluate the self-similarity and correlation properties of fractional Brownian noise and the time series produced by a fractional (fractal) Gaussian process.
Hurst exponent is used to evaluate the presence or absence of long-range dependence and its degree in a time series. However, local trends (nonstationarities) are often present in physiological data and may compromise the ability of some methods to measure self-similarity. Hurst exponent is the measure of the smoothness of a fractal time series based on the asymptotic behavior of the rescaled range of the process.
The autocorrelation function of a fractal noise {ξ i } is related to the Hurst exponent (H) via the equation (5):
LF- c(r) = ' 1 2+r ^ r2H
L 2
Or, equivalently, in the power spectrum representation:
S ( f ) = 1 ^ ( f )|2 = j -m c ( r ) e 2 n fr dTr = f^ e ■ c (6)
в = 2 H + 1 (7)
1/f corresponds to chaotic behavior, and it is characterized by Fractal properties not by Euclidean properties. The harmonics of chaotic signals are fractions of the main frequency of signal. The corresponding spectral density of 1/f is continued and described by power law. It suggests that the process is self similar.
Hurst exponent of 0.5 represents a signal with the characteristics of ordinary random walk or Brownian motion. Values for H<0.5, reflect the negative correlation between the increments or anti persistent time series, and H>0.5, show the positive correlation between the increments or persistent natural series.
In this study, we use Kaiser Window to calculate the Hurst Exponent. The window size is 100, and its beta parameter is 0.5.
-
D. Lyapunov exponent
Consider two (usually the nearest) neighboring points in phase space at time 0 and at time t, distances of the points in the ith direction being || & i (o)| and || & i ( t )| , respectively. The Lyapunov Exponent is then defined by the average growth rate λ i of the initial distance

II 5 x i ( 0 )|
= 2 Л ’
( t ^ да )
X i = lim1 log2 t ^M t
15 x i (t )l 15x i ( 0 )|
The existence of a positive Lyapunov Exponent indicates chaos. This shows that any neighboring points with infinitesimal differences at the initial state abruptly separate from each other in the ith direction [27].
An exponential divergence of initially nearby trajectories in phase space coupled with folding of trajectories, ensures that the solutions will remain finite, and is the general mechanism for generating deterministic randomness and unpredictability. Therefore, the existence of a positive λ for almost all initial conditions in a bounded dynamical system is widely used.
To discriminate between chaotic dynamics and periodic signals Lyapunov exponent (λ) is often used. It is a measure of the rate at which the trajectories separate one from other. The trajectories of chaotic signals in phase space follow typical patterns. Closely spaced trajectories converge and diverge exponentially, relative to each other. For dynamical systems, sensitivity to initial conditions is quantified by the Lyapunov exponent (λ). They characterize the average rate of divergence of these neighboring trajectories.
-
• A negative exponent implies that the orbits approach a common fixed point. These systems are non conservative (dissipative). The absolute value of the exponent indicates the degree of stability.
-
• A zero exponent means the orbits maintain their relative positions on a stable attractor. Such systems are conservative and in a steady state mode.
-
• Finally, a positive exponent implies the orbits are on a chaotic attractor [28-29]. The magnitude of the Lyapunov exponent is a measure of the sensitivity to initial conditions, the primary characteristic of a chaotic system.
-
E. Statistical Analysis
In this study, the t-test of the null hypothesis that data in the vector x are a random sample from a normal distribution with mean 0 and unknown variance, against the alternative that the mean is not 0 is performed. The result of the test is returned in p-value. P-value→0 indicates a rejection of the null hypothesis at the 5% significance level ( p <0.05). P-value→1 indicates a failure to reject the null hypothesis at the 5% significance level.
-
III. Results
Poincare plots, Hurst Exponent and Lyapunov Exponents of human gait were calculated. Then the results of analysis of signals in normal walking were compared to slow and fast gaits.
In order to compare the gait patterns of slow, normal and fast stride intervals, representative example of time series is shown in Fig. 3.
As shown in Fig. 3, different paces of walking (normal, slow and fast paces) affect the pattern of gait time series. The mean stride intervals are about 1.35, 1.25 and 1.07 for, respectively, unconstrained slow, normal, and fast paces.
The period of time over which measurements were done is approximately one hour. The concept of phasespace analysis of chaotic systems is extended here for gait signals.
Fig. 4 shows the width of the Poincare plots of gait signals for all records in three states: Fast, normal and slow gait.
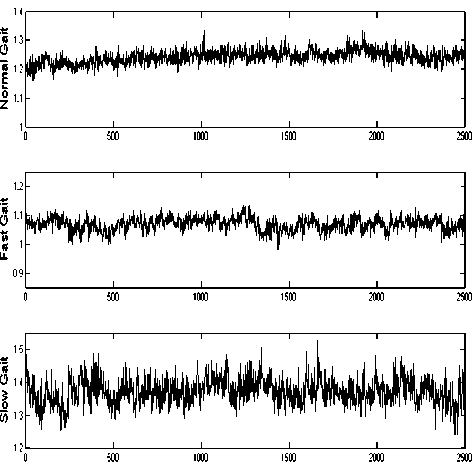
Figure 3. Typical stride interval time series (second) of human gait. top: normal gait, middle: fast gait, bottom: slow gait.
According to Fig. 4, the width of Poincare plots of gait signals is increased significantly during slow gait.
The Lyapunov Exponents of signals were analyzed. All the Lyapunov Exponents are positive, which confirm the chaotic nature of the signals recorded in slow, fast and normal gait. Maximum values of the Lyapunov Exponents are given in Fig. 5.
Fig. 5 demonstrates that the average value of the Lyapunov Exponents is about 0.945 during normal gait, while it is about 0.907 during fast gait, and about 0.9 during slow gait. In addition, the results indicate that the maximum Lyapunov Exponents are decreased during slow and fast gaits ( p <0.05 ). It shows that gait signals in normal walking are more chaotic than that two other stages.
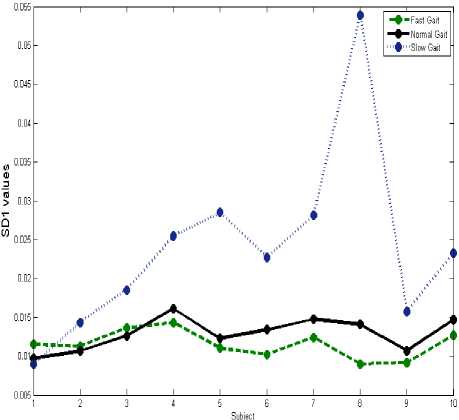
Figure 4. he width of the Poincare plots of human gait signals: Fast gait (- • -), normal gait (-• ) and slow gait (• ••• •).
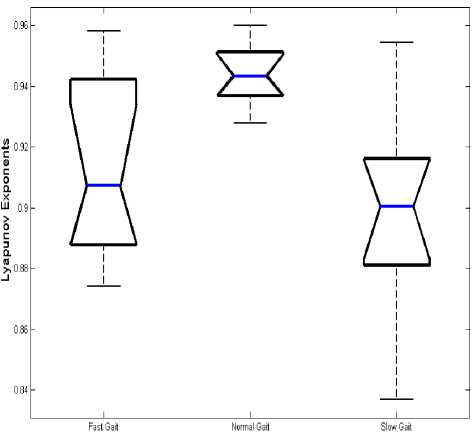
Figure 5. Box plot of Lyapunov Exponents of human gait signals: Fast gait, normal gait and slow gait.
Fig. 6 depicts values of the Hurst Exponents of signals for all subjects.
According to Fig. 6, the average value of the Hurst Exponent is about -1.12 during normal gait, but it is increased during fast gait (-1.06) and slow gait (-0.92). Therefore, the average value of Hurst Exponents is increased significantly during slow gait ( p <0.05).
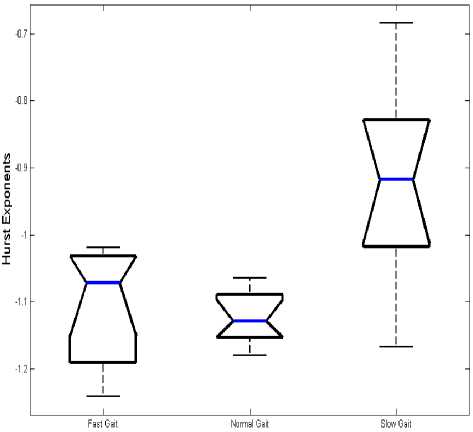
Figure 6. Box plot of Hurst Exponents of human gait signals: Fast gait, normal gait and slow gait.
-
IV. Discussion
The assessment of gait cycles can provide valuable information about locomotion systems and control systems involved in their complex regulation.
In this study, we examined the dynamic effects of slow, fast and normal gait in ten healthy men. The main goal of this study was to investigate the nonlinear dynamics of gait signals in the three specific states.
Features play an important role in study dynamics of biological signals. Some measures may be more attuned than others. The framework of the theory of nonlinear dynamics provides new concepts and powerful algorithms to analyze such time series. By applying nonlinear data processing techniques to stride interval sequences, we can begin to disclose the intrinsic complexity of the process of walking, which is not just a simple cyclical periodic phenomenon.
The discovery that locomotion is a complex cyclical phenomenon involving both order and randomness in different degrees has suggested the development of nonlinear analysis for the purpose of capturing the dynamical properties of the inter stride interval sequences.
Stride time interval sequences are characterized by different features. These features can be used as a measure of the degree of maturation or degeneration of the network that regulates human movement. In addition, a different kind of stress, for example, walking faster or slower than normal, or following a given frequency of a metronome, alters the characteristics of stride intervals. The dynamics of the spontaneous stride interval are normally quite robust and intrinsic to the locomotor system. Furthermore, this property of neural output may be related to the higher nervous centers responsible for control of walking rhythm.
The results of present study demonstrate that different paces of walking (normal, slow and fast paces) affect the pattern of gait time series (Fig. 3). In addition, it is evident from Fig. 3 that the stride interval of humans fluctuates in time. Movement behavior often appears irregular and without any structure.
It is found that human gaits are chaotic in all three states, as suggested by the positive Lyapunov Exponents in either state. In addition, it suggests that gait signals have low dimensional chaos, and the complexity of signals is decreased during fast and slow gaits. Decrease in Lyapunov Exponents ( p <0.05) during slow and fast gait indicates that signals are less chaotic than that in normal gait. This can be due to decreased nonlinear interaction of variables in fast and slow gaits.
For all subjects, the Hurst Exponents is significantly increased during slow and fast gaits ( p <0.05). Analysis of Hurst Exponents shows that the chaotic behavior of signal is decreased during slow and fast gait.
In a previous study involving gait, Costa et al. [30] applied Multi-Scale Entropy (MSE) for analyzing gait with different speeds and studied the scaling effect on Sample Entropy for different walking rates. The results of Khandoker et al. [31] suggest that gait pathologies with falls and balance problems are reflected in Poincare plots and features extracted from these plots are effective in differentiating between healthy and falls-prone gaits. In another study, Stansfield et al. [32] applied linear regression analysis of the relationships between speed of walking and related kinetic and kinematic parameters. They have quantified significant trends in gait parameters with normalized speed.
-
V. Conclusion
The nonlinear dynamics of the stride interval fluctuations is different under faster or slower paced frequencies relative to the normal paced frequency of a subject.
The results show that nonlinear analysis of time series has a potential to find the exact and hidden changes of signals, which cannot be found in linear methods. These methods are predominantly used for analyzing an irregular behavior in complex systems, since they enable the introduction of basic concepts directly from the experimental data, thus guaranteeing a better link between real-life phenomena and the theory.
In summary, this study shows that analysis of Poincare plots, Hurst Exponent and Lyapunov Exponents can be useful in analyzing the human gait signals in different states.
There is a huge but unexplored potential for discovering additional relationships in gait signal fluctuations. Furthermore, the present study examined only a small subset of the potentially relevant gait parameters and a few dynamical measures. Many different aspects of gait could be examined with other dynamical approaches.
Hopefully, the present work will motivate additional studies and analyses of gait in different paces of walking and variety types of walking problems.
References Nonlinear Analysis of Human Gait Signals
- Gage, J. R., Minnesota, ST. P., Deluca, P. A., Renshaw, T.S., 1995. Gait Analysis: Principles and Applications. The Journal of Bone and Joint Surgery, 77-A (10), 1607-1623.
- Gage, J. R., 1991. Gait Analysis in Cerebral Palsy. London. MacKeith Press.
- Hausdorff J.M. 2009. Gait dynamics in Parkinson's disease: Common and distinct behavior among stride length, gait variability, and fractal-like scaling. Chaos. 19(2), 026113.
- Hausdorff J.M., Peng C.K., Ladin Z., Wei J.Y., Goldberger A.L., 1995. Is walking a random walk? Evidence for long-range correlations in stride interval of human gait. J Appl Physiol, 78, 349-358.
- Hausdorff J.M., Zemany L., Peng C.-K., Goldberger,A.L. 1999. Maturation of gait dynamics: stride-to-stride variability and its temporal organization in children. J. Appl. Physiol. 86, 1040.
- West B.J., Griffin L. 1999. Allometric control, inverse power laws and human gait. Chaos, Solitons & Fractals. 10, 1519–1527.
- West B.J., Griffin L. 1998. Allometric control of human gait. Fractals. 6, 101–108.
- Collins J.J., Richmond S.A., 1994, Hard-wired central pattern generators for quadrupedal locomotion. Biological-Cybernetics, 71, 375–385.
- Henry A., Lovell N., 1999. Nonlinear dynamics time series analysis. in: M. Akay (Eds.), Nonlinear biomedical signal processing - dynamic analysis and modeling, John Wiley & Sons-IEEE Press, Hanover, New Hampshire, pp. 1-39.
- Goshvarpour A., Goshvarpour A., Rahati S., Saadatian V., Morvarid M. 2011. Phase space in EEG signals of women referred to meditation clinic. JBiSE, 4, 479-482.
- Goshvarpour A., Goshvarpour A. 2012. Classification of heart rate signals during meditation using Lyapunov exponents and Entropy, I.J. Intelligent Systems and Applications, 4(2), 35-41.
- Goshvarpour A., Goshvarpour A. 2012. Chaotic Behavior of Heart Rate Signals during Chi and Kundalini Meditation, I.J. Image, Graphics and Signal Processing, 4(2), 23-29.
- Campbell L., Bobick A., 1995. Recognition of Human Body Motion using Phase Space Constraints. Fifth International Conference on Computer Vision, Cambridge, MA.
- Van Emmerik, R.E.A., Rosenstein, M.T., McDermott, W.J., Hamill, J., 2004. Nonlinear Dynamical Approaches to Human Movement, Journal of Applied Biomechanics, 20.
- West, B. J., Scafetta, N., 2003. Nonlinear dynamical model of human gait. Physical Review E, 67.
- Dingwell, J.B., Cusumano, J.P., 2000. Nonlinear Time Series Analysis of Normal and Pathological Human Walking. Chaos, 10 (4), 848-863.
- Labini F.S., Meli A., Ivanenko Y.P., Tufarelli D. 2012. Recurrence quantification analysis of gait in normal and hypovestibular subjects. Gait & Posture, 35(1), 48-55.
- Chang M.D., Shaikh S., Chau T. 2009. Effect of treadmill walking on the stride interval dynamics of human gait. Gait & Posture, 30 (4), 431-435.
- Scafetta N., Griffin L., West B.J. 2003. Holder exponent spectra for human gait. Physica A, 328, 561- 583.
- Wolf, A., Swift, J.B., Swinney, H.L., Vastano, J.A., 1985. Determining Lyapunov exponents from a time-series. Physica D. 16285-317.
- Kantz, H., Schreiber, T., 1997. Nonlinear Time Series Analysis. Cambridge University Press, Cambridge, United Kingdom.
- Hausdorff, J.M., Purdon, P.L., Peng, C.K., Ladin, Z., Wei, J.Y., Goldberger A.L., 1996. Fractal dynamics of human gait: stability of long-range correlations in stride interval fluctuations. J Appl Physiol 80, 1448-1457.
- Karmakar, C., Khandoker, A., Gubbi, J., Palaniswami, M., 2009. Complex correlation measure: a novel descriptor for Poincare plot. Biomed. Eng. 8, 17.
- Goshvarpour, A., Goshvarpour, A., Rahati, S., 2011. Analysis of lagged Poincare plots in heart rate signals during meditation. Digital Signal Processing, 21, 208–214.
- Brennan M., Palaniswami M., Kamen P. 2001. Do existing measures of Poincare plot geometry reflect nonlinear features of heart rate variability? IEEE Trans Biomed Eng, 48, 1342-1347.
- Hurst H.E., Black R.P., Simaika Y.M. 1965. Long-term storage: an experimental study Constable, London.
- Roschke J., Fell J., Beckmann P. 1993. The calculation of the first positive Lyapunov exponent in sleep EEG data, Electroencephalogram. Clin Neurophysiol, 86, 348-352.
- Haykin S., Li X.B. 1995. Detection of signals in chaos, Proc IEEE, 83(1), 95–122.
- Abarbanel H.D.I., Brown R., Kennel M.B. 1991. Lyapunov exponents in chaotic systems: their importance and their evaluation using observed data, Int J Mod Phys B, 5(9), 1347–1375.
- Costa M., Peng C-K., Goldberger A.L., Hausdorff J.M. 2003. Multiscale entropy analysis of human gait dynamics. Physica A, 330, 53-60.
- Khandoker A.H., Palaniswami M., Begg R.K. 2006. Comparison of Approximate Entropy Measure and Poincare Plot Indexes for the Study of Gait Characteristics in the Elderly. ICINCO, 144-151.
- [32Stansfield B.W., Hillman S.J., Hazlewood M.E., Robb J.E. 2006. Regression analysis of gait parameters with speed in normal children walking at self-selected speeds. Gait & Posture, 23, 288–294.
