Novel approach of simplification detected contours on X-ray medical images

Author: Al-Temimi Ammar Mudheher Sadeq, Pilidi Vladimir Stavrovich, Ibraheem Murooj Khalid Ibraheem
Journal: Компьютерная оптика @computer-optics
Section: Обработка изображений, распознавание образов
Article in issue: 3 т.46, 2022.
Free access
This paper gives description of a method for simplifying the number of points representing detected contours of the bones on digital X-ray images. Such simplification permits simplify way for correction the location of these points in the cases, if the analyzed image has poor quality, and to reduces the time of analysis it to get the reference lines and angles for diagnosis purposes of the area under investigation.
Object recognition, digital x-ray image, reference lines and angles, contour simplification, medicine diagnosis system
Short address: https://sciup.org/140295001
IDR: 140295001 | DOI: 10.18287/2412-6179-CO-1014
Text of the scientific article Novel approach of simplification detected contours on X-ray medical images
X-ray diagnostics has a long history of development and is a field of medicine that has accumulated considerable experience, on the one hand, and on the other hand, developing as a result of new approaches and new technical means, including equipment for obtaining information, as well as algorithms and means for processing this information [1 –5].
In [6–8], a method was developed for determining the boundaries of contours in medical radiographs using a complex of algorithms (Canny boundary detector, watershed algorithm, morphological operations, etc.).
These methods were used to detect deformities of human limbs by analyzing X-ray images using the so-called method of reference characteristics, anatomical and mechanical axes and angles, which allow the specialist to conclude that there are no deviations from the norm determined using expert estimates, or the presence of such deviations and in this case, suggest a treatment regimen [9– 14].
Main part
The analysis scheme described in [6, 7] was used to create an application [15] that allows to obtain the above characteristics automatically. The selection of the bone contour to be analyzed is an important processing step. Here the result is previously obtained as a sequence of points representing the contour of the bone under analysis. The points are set by their coordinates on the lattice being the domain of definition of the image.
Experiments conducted using a large amount of real data have shown that in a relatively small number of cases it is impossible to obtain the reference characteristics in automatic mode. In all these cases, the reason was the poor quality of the original images due to the features of the diagnostic study or significant deviations in the analyzed areas.
To process images in such cases, the ability to manually adjust the contour was added to the software product. The image of the automatically obtained boundaries of the contours on the screen is superimposed on the obtained radiograph in the form of a piecewise-linear contour determined by the found points, and the user, taking into account the radiograph itself, can move several of these points. (The user defines incorrect result of detected boundary, by visual way). It turned out that with a large number of points representing the contour, the correction mentioned above is very difficult or even impossible (see Fig. 1.).
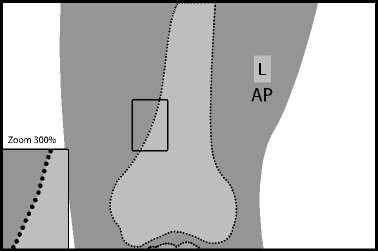
Fig. 1. The number of points on the border of bone
In connection with this problem, a method for reducing the number of points representing the contours of the bone was additionally developed and added to the software product. On the analyzed bone contour, sections that are approximately rectilinear are selected sequentially, and all points of each of these sections, except the extreme ones, are discarded. In this case, a natural restriction arises: simplification does not affect the quality of determining the reference characteristics.
To determine the possibility of replacing the image of a part of the bone contour with a segment, a numerical characteristic is used - the maximum deviation of this fragment from a straight line, allowing this operation to be performed. These characteristics were found for individual fragments of the contours of each of the bones under consideration as a result of experiments. In critical areas, which in some cases carry important information for diagnostic purposes, additional analysis is carried out to prevent the loss of significant data.
We consider the coordinate plane and the discrete lattice of points with integer coordinates on which the contour points are plotted.
Let M 0 , M 1 ,…, M k , M 0 ≠ M k be a sequence of points on the coordinate plane. We introduce the concept of deviation of this sequence from the segment: it is the largest of the distances of points M 1 , M 2 ,…, M k –1 from segment M 0 M k . There is obtained a formula expressing this value using the coordinates of points.
Let us first consider a special case: M i ( x i , y i ), i =0, 1,…, k , the start point M 0 and the end point M k lie on the axis Ox , so y 0 = 0, y k = 0, let p denote the deviation of this sequence from the segment M 0 M k . It's obvious that p = max y i (see fig. 2.).
1 < i < k - 1
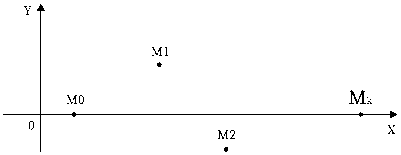
Fig. 2. Deviation from a segment in a particular case
The general case is reduced to the previous one. Suppose that the points have the coordinates: M i ( x i , y i ), i = 0,1, ..., k , ф -the angle between the ray having the vertex at the point M 0 and passing through the point M k and the axis Ox .
We consider the new coordinate system, taking the point M 0 as its origin and assuming that the new abscissa axis Ox ' forms the angle ф with the original abscissa axis. Then the point M k will also be on the axis Ox ' (see fig. 3.)
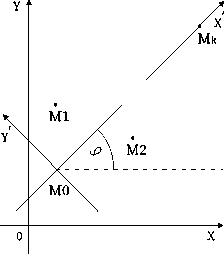
Fig. 3. Rotation of the plane.
Then:
cos ф - .
V( X k - X о )2 + ( У к - У o )2
sin ф - У к У 0 . (2)
V( X k - X 0 )2 + ( У к - У 0 )2
Suppose that the points M in the original coordinate system had coordinates ( x , y ), and in the new system it has the coordinates ( x ', y ' ), There hold the following relations:
x' - (x - x 0) cos ф+( y - y 0) sin ф. y '=-( x - x0) sin ф+( y - y 0) cos ф
yi --(xi-x0)sinф+(y-y0), or:
y i - - x i sin ф + y i cos ф + ( x 0 sin ф - y 0 cos ф ) .
Therefore the deviation p can be found by the following formula:
p - max ( ( - x i sin ф+ y i cos ф- ( - x 0 sin ф+ y 0 cos ф ) ) . (4)
Here the values cos ф and sin ф are defined above.
The algorithm of reducing the number of points works as follows.
In accordance with the location of the considered part of the contour, the value of the maximum deviation p 0 is selected.
Starting from point M 0 , the following contour points are added sequentially until the deviation p of these points from the line satisfies the inequality p < p 0.
When the last point M k for which this condition is satisfied is found, the intermediate points M 1 , ..., M k –1 are discarded, and the process continues from the starting point Mk . The default value of p 0 is found as a result of experiments and can be changed in the settings of the software product.
The fig. 4 shows the result of detecting the boundary for the femur in the X-ray image after using the proposed algorithm with the value p 0 = 3 . In this case, the number of points is reduced by about 13 times. After such simplification, the correction of borders becomes much simpler and more reliable.
Although in the case of a successful boundary detection result, there is no need to adjust the boundary, such a fragment of the algorithm reduces the number of further calculations when searching for the required reference characteristics, which ultimately leads to program acceleration.
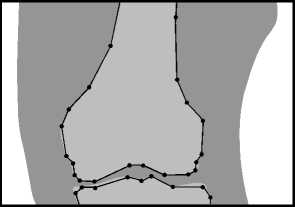
Fig. 4. Boundary detection by proposed algorithm
Experiments
The experiments were carried out on 20 images of the knee joint, in each of these attempts there were found two contours, the upper of which was the femur, and the lower tibia. The data given in the table 1 allow us to compare the initial number of contour points and the results of applying the proposed contour simplification algorithm; the mentioned above p0 = 3 was obtained as a default value after applying the new method on these images.
Table. 1 Data experiments.
|
No. |
Before Simplification |
After Simplification |
||
|
No. points of femur |
No. points of tibia |
No. points of femur |
No. points of tibia |
|
|
1 |
324 |
358 |
26 |
19 |
|
2 |
348 |
345 |
21 |
21 |
|
3 |
308 |
357 |
25 |
20 |
|
4 |
352 |
426 |
24 |
25 |
|
5 |
311 |
331 |
24 |
24 |
|
6 |
339 |
418 |
26 |
23 |
|
7 |
261 |
378 |
23 |
19 |
|
8 |
299 |
368 |
26 |
25 |
|
9 |
407 |
422 |
26 |
33 |
|
10 |
336 |
411 |
26 |
23 |
|
11 |
432 |
493 |
31 |
21 |
|
12 |
351 |
377 |
26 |
24 |
|
13 |
446 |
449 |
22 |
22 |
|
14 |
361 |
451 |
27 |
21 |
|
15 |
387 |
409 |
26 |
21 |
|
16 |
323 |
376 |
27 |
22 |
|
17 |
235 |
256 |
19 |
20 |
|
18 |
337 |
379 |
25 |
22 |
|
19 |
298 |
383 |
27 |
23 |
|
20 |
319 |
373 |
23 |
23 |
The user can change the value of ρ 0 in software settings. We mentioned here that the threshold value of the maximum deviation ρ 0 was determined experimentally, and it is no more than five. (As not to influence on the result of diagnosis, which depends on the detected boundary of bone).
The experimental results show that in case of an error in determining the boundary of the contour, incorrectly found points are in a relatively small neighborhood of the boundary. Then, with manual adjustment, the user should only move points that are not on a visually defined border. This means that such a correction does not take much time to fix the boundary detection error. The fig. 5 shows the result of the detection of boundaries, the error region is represented by 4 points. In this case, the user must move these points to the correct places, which should lie on the boundary of the contour.
It should be noted that in the software product for greater flexibility of its use, functions for adding and deleting points are provided
Testing in medical institutions has shown the effectiveness of a software product developed using the pro- posed algorithm, both in terms of the reliability of the results and in terms of processing speed (less than 0.4 seconds for a standard size image in cases where an additional setting is not used). Users also noted the simplicity of the additional settings required in a fairly small number of cases. Experiments confirm that the proposed simplification of contours doesn’t effect on the diagnosis accuracy results.
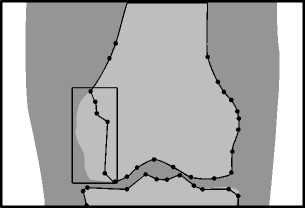
Fig. 5. The domain of the error region
Conclusion
Simplifying the contour using the proposed algorithm reduces the total amount of calculations, significantly reduces the time required for analyzing the x-ray image in most cases, when the analysis can be done in fully automatic mode, simplifies visual correction if necessary, allowing to get the desired result in this case, eliminating the need for repeated radiography.
This algorithm has significantly improved the performance of the software product in various cases, both in the case of analysis of individual x-ray images, and in the case of analysis for a series of the same type images.
The proposed and successfully tested algorithm makes it possible to significantly simplify information about the analyzed geometric objects in cases when eliminating redundant data allows to solve problems of saving memory, speeding up the program, and simplifying visual analysis. An insignificant modification allows to use the proposed method in the case of analyzing surfaces in three-dimensional space.
References Novel approach of simplification detected contours on X-ray medical images
- Shivanand SG, Pooja UP, Ramesh RM. Detection of osteoarthritis using knee X-ray image analyses: A machine vision based approach. Int J Comput Appl 2016; 145(1): 20-26.
- Gornale SS, Patravali PU, Manza RR. A Survey on Exploration and Classification of Osteoarthritis Using Image Processing Technique. International Journal of Scientific and Engineering 2016; 7(6): 334-355.
- Shivpuje VB, Sable GS. A review on digital dental radiographic images for disease identification and classification. Int J Eng Res Appl 2016; 6(7): 38-42.
- Candemir S, Jaeger S, Palaniappan K, Musco JP, Singh RK, Xue Z, Karargyris A, Antani S, Thoma G, McDonald CJ. Lung segmentation in chest radiographs using anatomical atlases with nonrigid registration. IEEE Trans Med Imaging 2014; 33(2): 577-590.
- Ilyasova NYu, Kupriyanov AV, Ustinov AV. Intraocular foreign body characteristics study on the basis of skull radiograph-ical images analysis. Computer Optics 2011; 35(2): 268-274.
- Al-Temimi AMS, Pilidi VS. Automating the process of determining the reference lines on the X-ray medical images. Engineering Journal of Don 2oi7; i. Source: (http://ivdon.ru/en/magazine/archive/niy2oi7/4oo7).
- Al-Temimi AMS, Pilidi VS. On an algorithm for analyzing the structure of radiographic medical images [In Russian]. University News. North-Caucasian Region. Technical Sciences Series 2oi8; i(i97): 23-28.
- Al-Temimi AMS, Pilidi VS. Improvements of programming methods for finding reference lines on X-Ray images. Computer Optics 2oi9; 43(3): 397-4oi.
- Solomin LN, Shchepkina EA. Determination of reference lines and angles for the long bones [In Russian]. Saint-Petersburg: "RNIITO imeni R.R. Vredena" Publisher; 2oio: 2i.
- Paley D. Principles of deformity correction. New York: Springer-Verlag; 2005.
- Morrey B. The elbow and its disorders. Philadelphia: Saunders; 2000.
- Cooke TD, Li J, Scudamore RA. Radiographic assessment of bony contributions to knee deformity. Orthop Clin North Am 1994; 25(3): 387-393.
- Chao EY, Neluheni EV, Hsu RW, Paley B. Biomechanics of malalignment. Orthop Clin Noth Am 1994; 25(3): 379-386.
- Glimet T, Masse JP, Kuntz D. Obesity and arthritis of the knee. Rev Rhum Mal Osteoartic 1990; 57(3): 207-209.
- Al-Temimi AMS. System for the analysis of radiographic images of the knee joint. Certificate of state registration of the computer program No. 2018610378. Date of state registration in the Register of Computer Programs January 10, 2018.
