Nowcasting migration using statistics of online queries

Author: Tsapenko Irina P., Yurevich Maksim A.
Journal: Economic and Social Changes: Facts, Trends, Forecast @volnc-esc-en
Section: Theoretical and methodological issues
Article in issue: 1 т.15, 2022.
Free access
Due to international migration’s growing importance in modern countries’ lives, there is an increasing need for reliable and relevant forecasts of this process, especially in today’s turbulent world. However, established migration forecasting procedures suffer from a number of limitations, against which innovative approaches based on big data, notably online searches made by potential migrants, offer many advantages. Because of their novelty, such tools have not yet revealed their full explanatory and predictive properties. The work explores the possibility of using these tools to predict the population flows within the post-Soviet space. We hypothesize that there is a statistical relationship between online queries about migration to Russia made by residents of Kyrgyzstan, Tajikistan and Uzbekistan and subsequent human flows from these countries to Russia. The hypothesis was tested using the migration statistics of Rosstat, the Federal State Statistics Service of the Russian Federation, Google Trends data on search intensity, and Yandex Wordstat service of word matching for validation of search images. As a result of correlation and regression, we found a moderate dependence of the dynamics of human flows on previous queries, which is most evident at a lag of 6-9 months and at zero lag. Obtaining more accurate results in this and similar studies is hindered by the initial limited predictability of migration behavior due to its contextual, sometimes situational and irrational nature, as well as “noisiness” of statistics of queries and often the flows themselves. The search for universal algorithms of determination of relations between queries and migration flows is seen as the main direction of research in this field.
Migration, forecasting, big data, online queries, search images, modeling, Russia, central asia
Short address: https://sciup.org/147237318
IDR: 147237318 | UDC: 314.748
Text of the scientific article Nowcasting migration using statistics of online queries
Acknowledgments.
The article was prepared within the project “Post-crisis world order: Challenges and technologies, competition and cooperation” supported by the grant from Ministry of Science and Higher Education of the Russian Federation program for research projects in priority areas of scientific and technological development (Agreement no. 075-15-2020-783).
The growing scale1 and importance of crossborder migration (involving temporary or permanent change of country of habitual residence) in the life of societies increases their need for relevant, reliable and realistic forecasts of people’s movements, especially in the context of political and environmental (including epidemic) instability on the planet. Such forecasts are necessary for visionary, proactive, “smart” migration management; for improving the preparedness of rapid response systems to more frequent migration crises and developing effective solutions to emerging problems; and for improving the planning of various spheres and institutions of society, such as health care, education, etc.
At the same time, forecasting migration faces serious difficulties due to the specifics of this behavioral phenomenon, namely the high uncertainty associated with it. Some researchers, in particular J. Bijak and M. Czaika, categorically state that “migration is not predictable in the strict sense” (Bijak, Czaika, 2020, p. 14). Nevertheless, the use of a wider range of statistical sources, the coordination of different types of information, and the development of a methodology appropriate to new types and combinations of data promises progress toward relevant forecast results.
The emergence of innovative, data-driven approaches to the study of migration offers great opportunities in the field of migration forecasting. The emerging trend of migration research, which relies on statistics of online inquiries from potential migrants, is very promising from the point of view of nowcasting and short-term forecasting of human flows.
Such set of tools for analyzing and forecasting migration have not yet been developed in Russia. The purpose of our work is to explore the possibilities of applying the new methodology for anticipating migration flows in the post-Soviet space, on the material of which no such studies have been carried out before. We formulate and test the hypothesis that there is a link between search queries about migration to Russia made on the Internet by residents of Kyrgyzstan, Tajikistan and Uzbekistan, and subsequent migration flows from these countries to Russia. In order to achieve the goal, we used the tools of search pattern validation, correlation, regression and theoretical analysis.
The work focuses on the following tasks: to show the limitations and problems in the application of conventional procedures on the basis of a review of generally accepted forecasting methods and data sources; to analyze foreign experience in the use of different types of big data, including online queries, to study and predict migration, to characterize their advantages and disadvantages; to adapt such a set of tools to the conditions of migration in the post-Soviet space and to test the methodology of anticipating migration from Kyrgyzstan, Tajikistan and Uzbekistan to Russia using the statistical material of online inquiries from the Central Asian population and monthly data from Rosstat on the number of migrants arriving from there to Russia; to present and try to explain the results obtained; to assess the possibilities of their practical use and in general the prospects of this approach to the prediction of migration in Russia.
Limitations of established migration forecasting procedures
The 21st century has seen a dramatic increase in migration foresight activities around the world. A large group of scientists and institutions engaged in migration forecasting has been formed. The number of works, including major ones, devoted to quantitative assessments and foresight of future migration, issues of methodology and forecasting techniques, is growing rapidly (see, for example, (Szczepanikova, Van Criekinge, 2018; Acostamadiedo et al., 2020; Sohst et al., 2020; Carammia, Dumont, 2018; Bijak, 2016; Lifshits, 2016; Tkachenko, Ginoyan, 2018; Malysheva, 2017) et al.2).
However, when comparing forecast assessments and actual migration figures, it turns out that a significant part of the forecasts did not come true. Often the dynamics of migration were underestimated. Australian demographer T. Wilson states that large error values have actually become the norm in forecasting both long-term flows and shortterm fluctuations (Wilson, 2017).
The main reason for these inaccuracies is the objective difficulties of predicting migration. These include the multiplicity of interacting drivers of migration and the variability of their influence, especially in the context of contemporary societal and environmental (including epidemic) instability, external shocks, deep, time-compressed and multidimensional transformations that make it difficult to recognize future signals3; the complex nature of migration behavior, which is often contextual and situational, bears the stamp of place and time in the formation of migration intentions and the decision to move, and is sometimes irrational. Thus, migration forecasting is currently stochastic because of the objective unpredictability of the “black swans” inherent in this process and the large variability of the final outcomes of the modeled object. Limited and incomplete information and the lack of knowledge about migration itself also contribute to the increase in uncertainty (Bijak, Czaika, 2020).
Statistical data traditionally developed and collected by national and international organizations (censuses and sample population surveys, administrative data on entry into and leaving the country, residence and work permits, etc.) have significant drawbacks such as resource intensity, incompleteness, flaws in quality, significant delay in reporting, limitations in accessibility, comparability and disaggregation, etc. Data from sociological services, in particular the results of the Gallup World Poll on the migration intentions of the population, are available and internationally comparable. However, such information is costly to obtain, subject to the risks of unrepresentative sampling, dependence of their predictive power on the timing and location of the survey, question wording (Tjaden et al., 2019), etc.
While the methodology is constantly improving, none of the methods used can be unequivocally preferred in all respects (Sohst, Tjaden, 2020). Scenarios outlining possible options for long-term migration prospects have increased uncertainty. And since the horizons of such projections extend beyond the voting cycle, it is not easy to translate their results into policy decisions. The Delphi method, despite multiple rounds of examination of selected expert groups, is often unable to iron out significant differences in expert judgment (Acostamadiedo et al., 2020).
Econometric methods also have their weaknesses. They are vulnerable to unreliable or incomplete statistics, national differences in data sources and collection methods, they cannot account for the diversity of explanatory factors, they sometimes rely on questionable assumptions, inappropriate historical or country analogies, and they face difficulties in operationalizing drivers that contain elements of uncertainty. In addition, processing and analyzing large amounts of information requires complementing regression set of tools with other more sophisticated machine learning techniques, including neural networks.
The turbulence of the world, which makes the prediction of migration very difficult, encourages the search for non-standard sources of information and innovative methods of its application. Opportunities for this are opening up with the development of digital technologies. In particular, such prospects are possible with the use of big data and corresponding new methodological approaches to nowcasting and migration forecasting.
Foreign experience in the use of big data in migration forecasting
Alternative sources of information, taking the form of big data, and new ways of analyzing it, including machine learning, are increasingly being used in migration forecasting (Sirbu et al., 2021). This is facilitated by the increasing use of mobile phones and Internet-connected digital devices by migrants in the planning and implementation of migration, etc. The digital footprint left by migrants can be used to identify patterns and trends in migratory behavior.
Big data have a number of undoubted advantages: immediacy and timeliness, relative ease and low cost of obtaining information, relevance of information, the reflection of real, current processes, the coverage of huge arrays of population and territories.
A lot of research has been done based on the use of geolocalized Twitter and Facebook user data, IP logins when accessing websites, email messages sent from Yahoo servers, and call detail records from mobile phones. These works have demonstrated the serious potential of big data for predicting the scale and routes of population movements, identifying typical patterns of movements in emergency situations, changes in the number of migrants, the degree of their assimilation by language, musical and literary preferences of network users, etc. (Zagheni et al., 2017; Zagheni, Weber, 2012; Hawelka et al., 2014). The application of such data has predicted the growth of Venezuelan migrants in Colombia and Spain (Spyratos et al., 2019), and assessed the cultural integration of Mexicans in the USA (Stewart et al., 2019). They have been used to track human flows after natural disasters in Haiti and to anticipate their routes in New Zealand: to places familiar to victims (where many calls had previously come from) and major cities (Bengtsson et al., 2011), and to monitor mobility in epidemics, including COVID-19.
The results were consistent with official statistics and the research findings published much later. At the same time, the application of such big data revealed limitations and posed serious challenges. The level of Internet connectivity and mobile connection significantly influenced the representativeness of the sample and, accordingly, the accuracy of the results. The intensity of the digital services use by different social groups also varied, depending on their age and gender characteristics, the level of socio-economic development of the territory, the type of settlement, etc. Features such as the young age of Twitter users or the older age of Facebook audiences, for example, limit the ability to generalize such results to identify common migration patterns. The instability of the use of social networks, the unreliability of the information provided by users about themselves, the existence of fake and double accounts also have an impact. Problems arise with accessing data from networks and services and ensuring the constant flow of information. It is difficult to obtain information from the networks about the period of stay of a visitor in the country of destination, which is used in official statistics as a criterion for determining a migrant.
When such data is used to track an individual’s whereabouts, there are risks of human rights violations regarding the privacy and security of personal information, as well as ethical standards. In the worst case, this could lead to a possible increase in repression of persecuted people, the creation of obstacles to their refugee status abroad or their expulsion from the country of asylum sought, etc. (Beduschi, 2018).
Studies of migration and other forms of mobility based on online inquiry statistics lack most of these disadvantages. Such studies are becoming increasingly popular. Since Google is the main search engine of the world’s population, which is used by more than 1 billion people, the queries in this browser, measured by Google Trends4, can be considered generally representative of the Internet audience and used as a forecasting tool. The application of this type of big data is based on the notion that the aggregate query intensity of migration-related search words serves as a direct measure of migration intentions (Bohme et al., 2020). As empirical studies show, potential migrants gather information about opportunities to move, including online, so fluctuations in the number of requests can indicate a variation of interest in migration and, all other things being equal, are suitable as a proxy (analogue indicator) of changes in the number of potential migrants and the attractiveness of certain countries for them, which allows using of such data to predict the dynamics of human flows5.
The prediction of cross-border population movements based on such an approach was initiated by Google analysts in the 2000s. H. Choi and H. Varian, having analyzed the monthly intensity of search queries for the word “Hong Kong” performed in certain countries for 2005–2011 and the number of tourists arriving from these countries to Hong Kong, concluded that Google Trends data reflects the planning of trips and allows anticipating future tourist flows (Choi, Varian, 2012). The use of monthly data, to which this pioneering work was addressed, has become the most common statistical practice of further research.
The study of international migration (the criterion of which is a temporary or permanent change of country of usual residence) in this innovative way began only in the 2010s. In order to better identify migration flows and distinguish them from tourism and business trips, the search images were based on keywords related to work, study, and asylum. Global Pulse6 and the United Nations Population Fund staff assumed that people interested in migration make inquiries about employment opportunities abroad before they leave. When comparing statistics on foreign arrivals to Australia, including its individual cities, with aggregated requests from different countries for 2008–2013 by the key English-language words “jobs in Melbourne”, “jobs in Australia”, and “work visa”, a link between these indicators was found. The correlation between flows from Italy to Australia and requests for “jobs in Australia” was particularly strong7.
An important result of subsequent research was the identification of the time lag between the expression and embodiment of intentions. Such a timing effect in migration is due to the need to prepare for the trip. This was shown by a study of Spanish-language query statistics from Peru, Colombia and Argentina in 2005–2010 for the keywords “jobs in Spain”, “embassy in Spain” and “Spain”. The researchers found a strong correlation between the 7–8-month lag of such requests in Peru and Colombia and the number of migrants from these countries registered as migrants in Spain. For Argentina, whose flows consisted of 40– 50% European nationals, the results were mixed (Wladyka, 2017).
Matching the language used in migrants’ countries of origin and destination makes it easier to handle search queries. However, linguistic discrepancies are more typical. The study of migration to Switzerland relied on search data in four languages: German, French, Italian, and Spanish. We have processed queries for the keyword “work in Switzerland” from Germany, France, Italy, and Spain, respectively, from 2004–2018. The researchers found that among potential migrants from the four countries in question, natives of Spain and Italy showed the greatest interest in working in Switzerland and showed the strongest correlation between requests and subsequent arrival, which allows predicting in the short term the flows of adult migrants from these states. In contrast, the corresponding indicators for France show a weak relationship, occurring with a lag of two years. This fact can be explained by the predominance of family immigration in movements from France, as well as by fact that the flows contain a large number of migrants who have already worked in Switzerland before, i.e. do not need to seek such information (Wanner, 2021).
The first steps toward short-term forecasting of forced migration based on search queries have been taken. A Pew Center study found a strong correlation between the intensity of requests from Turkey with the word “Greece” in Arabic and fluctuations in the number of Iraqi and Syrian refugees crossing the Aegean Sea toward Greece in 2015–2016 (Connor, 2017).
Compared to all the above-mentioned studies, which were limited to the use of a small number of search words in relation to individual countries, the works of German scientist M. Bohme and his colleagues are distinguished by the scope and a new algorithm of analysis. To build search patterns, the authors selected 67 words related to economics and migration in three languages: English, French and Spanish, and collected statistics on relevant queries made in 101 countries of origin of migrants in relation to 35 host OECD countries. Constructed time series of aggregated annual data for 2004– 2015 for each search word from each sending country allowed judging the level and dynamics of emigration potential of the population, as well as the orientation of emigration intentions towards particular destination countries. The significance of the results increased when the sample was restricted to states with high Internet connectivity and more common languages (Bohme et al., 2020).
These research findings suggest that migration-related query data can be used as a proxy for migration intentions and complement official information, compensating for the lack of relevant and comparable statistics and allowing for new combinations of data that add value to each type of data (Struijs et al., 2014). At the same time, the inclusion of words related to study, asylum, etc. in such search images can highlight intentions with respect to study, humanitarian migration, etc., respectively.
At the same time, the use of such alternative sources of information is subject to certain limitations. The vast amount, complexity, and “noisiness” of the data create methodological and analytical problems (Rango, 2015). There is no single universal approach to the use of queries for forecasting migration. There are differences in the closeness of connection between the statistics of typical queries and subsequent movements of the population, depending on the routes, mass and composition of flows. Perhaps each migration corridor (migration between two particular countries) has a unique query (Tjaden et al., 2021). Query data is often not very informative in cases of small-scale migratory flows, movements from countries with rare languages, limited internet access, etc. (Wladyka, 2017). Distortions can arise because people put different meanings into the same words and use them for different, including nonmigration-related, search purposes. In addition, when verifying the accuracy of predictions made on the basis of alternative sources of information by correlating them with official migration statistics, it is necessary to take into account the imperfections of the latter (Tjaden et al., 2021).
Obviously, the as yet poorly understood explanatory and predictive properties of query statistics complicate the correct use of big data for migration prediction, which in turn gives rise to the need for further research in this area.
Research methodology and variable calibration
Migration flows from Kyrgyzstan, Tajikistan, and Uzbekistan to Russia were chosen for study because of the mass and stable routes of such movements generated by the socio-economic differences and migratory interdependence of these countries. The movements are favored by the common historical past, geographic proximity, economic integration, cultural ties, etc.
These Central Asian states are among the main donors of population and labor in the post-Soviet space. In 2020 they accounted for 32% of the inflow of migrants to the RF and 43% of its population growth; in turn, Russia as the main recipient of human flows in 2020 accounted for 76% of all Kyrgyz natives living abroad (in 2000 – 81%), 79% – for Tajikistan (70%) and 57% – for Uzbekistan (58%)8. These indicators show that Tajikistan is the only country in this group that clearly demonstrates a long-term, least susceptible to negative external influences, increase in the orientation of migration flows toward Russia.
Two types of data from different sources were considered in determining the most appropriate reference statistical information on migration flows for the study. First, these are quarterly data from the Russian Ministry of Internal Affairs on the number of foreign nationals registered for migration, including those arriving with the purpose of work. While allowing for the clear identification of migrant workers, this information, which is publicly available only for the period since the end of 2016, does not provide sufficient depth in the time series.
Second, monthly data from Rosstat, available since 2011, on the number of people arriving from abroad in Russia and registered at the place of residence or stay for a period of 9 months or more. However, these data summarize not only labor migrants (not allowing them to be singled out), but also students, reuniting family members, etc. At the same time, taking into account that modern migration is primarily labor migration and that not only labor migrants but also other categories of migrants are interested in work (looking for information about it online), the mentioned and some other shortcomings (Chudinovskikh, Stepanova, 2020) can be neglected for want of better data.
At the same time, the Rosstat data have undoubted advantages: 1) impressive depth of time series with monthly detailing of data, providing a large number of observations and making it possible to build a more relief trajectory of migration processes compared to quarterly, more smoothed data; 2) compliance with the most common data format used abroad in similar studies; 3) reflection of more stable flows of migrants coming temporarily for longer periods or for permanent residence, in contrast to short-term volatile circulation.
For the subsequent quantitative analysis, we formed a time series of data on migration inflows from these Central Asian states to Russia for the period from January 2015 to December 2020, which included 72 points (observations) for each country (denoted by the indicator of migrant arrivals – M ).
During the formation of statistics on the queries of potential migrants, a list of possible search words or search images was compiled. When forming the list, the authors took into account the experience of foreign studies, in which search images related to work in specific territories showed the best results.
To check the relevance and accuracy of the match to the object under study of the selected search images, we used the Wordstat service provided by the Russian company Yandex.
The Russian web application allows getting information about the absolute number of queries that include a search term, as well as the context of its inclusion (Yurevich, 2021). Whereas the American counterpart Google Trends reveals only the dynamics of queries, but does not show their absolute number, so it is less informative for validating search images – determining the frequency of use of particular terms online and their associative relationships, which makes it difficult to prove true relationships and increases the likelihood of finding false correlations.
At the same time, Yandex service does not allow analyzing queries for a long period of time, limiting it to only two years of available data, so to build models for the analysis of time series in the medium and long term we used Google Trends application, which is much more suitable for this due to the deep retrospective data.
Justification for referring to these two search engines is based on their popularity among Central Asian users, although Yandex is markedly inferior to Google. According to analytical service StatCounter, in 2020 in Kyrgyzstan 89% of the browser market accounted for Google and 10% for Yandex, in Tajikistan – respectively 82% and 15%, in Uzbekistan – 84% and 14%9. The geographical binding of the requests was determined by the user’s IP address or by using the appropriate browser settings.
According to the Wordstat service, search queries containing the word “job” are very popular (Tab. 1) . The term “vacancies” is used somewhat less frequently, but is also quite common. Queries for more specific words like “residence” (e.g., “get a residence permit”) and “migration” have a frequency of less than 1,000 per month. The word “patent” is used somewhat more frequently, but the context of its use indicates a strong “noisiness” of the term, which is often associated with a document
Table 1. Characteristics of the popularity of search terms related to potential labor migration per month
Search query considering morphology Number of requests per month, units Kyrgyzstan Tajikistan Uzbekistan job 63,945 41,460 67,731 vacancy 11,686 7,599 12,835 job|vacancy 72,387 46,901 77,481 job|vacancy - Bishkek - Kyrgyzstan -homework 59,937 job|vacancy - Dushanbe - Somon*- Tajikistan 41,379 job|vacancy - Tashkent - Uzbekistan - Samarkand 62,832 job|vacancy Moscow|Russia 6,842 6,400 4,537 patent 1,118 3,032 1,741 * - classifieds site, vacancies only in Tajikistan. Note. The symbol “|” acts as an operator “or”; the symbol “-” excludes the following word from the possible variants of the query. The excluded words are those that obviously do not meet the goals of identifying migratory sentiments. Source: (accessed: October 19, 2021).
protecting intellectual property. At the same time, queries containing the words “job” or “vacancies” are not suitable for nowcasting or predicting migration flows for a similar reason: first, people often use these words to search for jobs in their own country without being interested in employment opportunities abroad; second, on the Internet there are many references to the word in an educational context, as “homework” and “classwork”. The attempt to build a search images using words in the national languages of Central Asian countries is not effective either. Apparently, residents are looking for jobs in local markets with such queries, and their efforts are not very active. For example, in Uzbekistan the query “ish o rinlari” (jobs) has 1.3 thousand mentions per month; in Tajikistan “kor” (work) has 5.5 thousand; in Kyrgyzstan “jumush” (work) has 2.6 thousand.
Adding the name of the Central Asian country to the search allows clarifying the search area and characteristics of jobs, but leads to a merging in the overall statistics of queries such as “work in Tajikistan” and “work for citizens of Tajikistan”. And vice versa, if you use the names of these countries as stop words, all queries containing the words “Tajikistan”, etc. drop out of the field of observation.
On the contrary, the inclusion of the names of the host country, its cities, etc. in the query is justified. The search image “(job OR vacancies) AND (Moscow OR Russia)” demonstrates a high level of compliance with the task, which is almost noiseless due to the concretization of the geography of the search. At the same time, other cities and constituent entities of the Russian Federation, according to the Wordstat service, attract much less interest from citizens of each of the three countries.
The compiled search query image “(job OR vacancies) AND (Moscow OR Russia)” was entered into the Google Trends service to form a long time series (indicator designation – GT ). The resulting statistics are automatically normalized with respect to the maximum value for the period from January 2014 to December 2020, i.e. the indicator has acquired the form of an index. For clarity, the time series were normalized from 0 to 1 using the MINMAX procedure ( у = (% — min)/(max — min) ).
The Figure shows in favor of the correlation between the variables in question, although not very close. The broken trajectory of the dynamics of flows and especially of queries fluctuating with a large amplitude reflects the instability of the Russian economy in conditions of sanctions of Western states against Russia, pandemics, etc. The similar
Comparison of the dynamics of migrants influx and queries “(job OR vacancies) AND (Moscow OR Russia)” in the Google search engine in 2015–2020
Kyrgyzstan
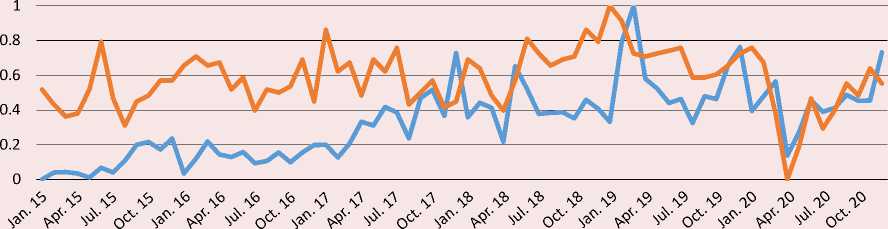
Flow of migrants Dynamics of search queries
Tajikistan
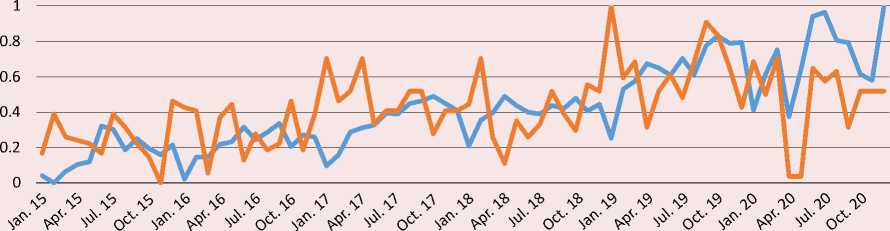
^^^^^е Flow of migrants ^^^^^™ Dynamics of search queries
Uzbekistan
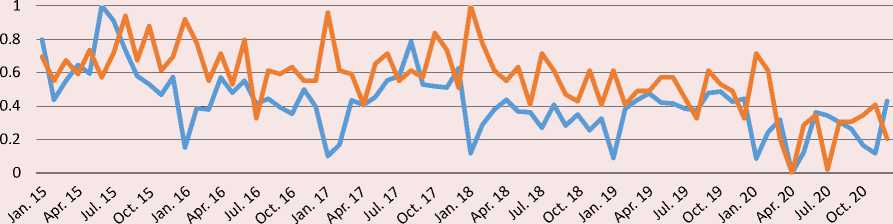
^^^^^™ Flow of migrants ^^^^^™ Dynamics of search queries
Source: own compilation.
reactions of the variables to significant, especially extraordinary, events and extreme situations are well noticeable. Thus, the increase in queries and flows since late summer 2019 may be connected with the adoption of Law No. 257-FZ, which simplifies the procedure for granting temporary residence permits and permanent residence permits to certain categories of migrants, and the broader psychological effect of this liberalization measure. On the contrary, after Russia adopted a package of strict measures against the spread of the coronavirus epidemic, there was a rapid decline in the influx of migrants and minimization of the number of queries in the spring of 2020. However, when Russian legislation adopted the provision on the possibility of repeatedly extending patents from May 2020, as well as a package of liberal rules for the stay of migrants in the country since June, both queries and flows grew almost in parallel.
Changes in the opposite directions are observed in all three countries from year to year in January, when the flow of migration greatly decreases, but interest in working in the Russian Federation noticeably increases. This suggests the probable presence of seasonality in both variables.
However, the trajectory of queries, in contrast to the movement of flows, does not show a rise in the summer period of the Russian economy’s demand for foreign labor, which is explained in typical conditions by the lag between queries and subsequent flows. It is also noticeable that flows from Kyrgyzstan reacted with great lag to the country’s accession to the EAEU on January 1, 2015 (membership in which does not seem to affect any explicit features of the network and migration behavior of citizens), while movements from Tajikistan and Uzbekistan similarly reacted to the introduction of patents for migrants from the CIS to work for legal entities on January 1, 2015.
In addition, we can see in the charts, the inflow of migrants from Kyrgyzstan and especially Tajikistan has a pronounced upward trend. The rate of change in queries from these countries also gravitates toward the upward trend. On the contrary, the dynamics of queries, as well as arrivals of migrants from Uzbekistan show a downward trend. Probably due to the inertia of the waning dynamics of flows, the entry into force in December 2017 of the agreement between the governments of Uzbekistan and Russia on the organized recruitment of Uzbekistan citizens for temporary labor activities in Russia, causing a surge in queries, was not reflected in the subsequent rise in migration.
The conducted statistical tests confirmed these hypotheses. The augmented Dickey-Fuller test (ADF) and the Ljung-Box Q-test indicated the non-stationarity of the time series (calculations performed in the RStudio application, package “tseries”). In addition, a comprehensive test for seasonality, including tests for seasonal dummy variables, Friedman tests, Kraskell-Wallis tests, etc.10, indicates the presence of seasonality in M variable by Uzbekstin and in GT variables for all countries (calculations are performed in RStudio application, package “seastests”). One way to obtain the stationarity of the time series is to take the first differences, i.e. further we will analyze the monthly change in the number of migrants arriving and the change in the demand index (∆M and ∆GT). Smoothing of seasonal fluctuations in those variables in which seasonality was detected was performed using the X-13ARIMA-SEATS algorithm11. After this operation, a correlation analysis with the inclusion of lags from 0 to 12 months was performed for the purpose of primary analysis of the relationship between the variables. At this stage, we found an extremely low degree of correlation between the observed variables for Tajikistan. Somewhat better results were recorded when the search image was changed by removing the word “vacancies”.
Correlation analysis showed a moderate relationship between the variables. The tightest interdependence is observed with a lag of 6–9 months, which is required to make a decision and thoroughly prepare for departure for an extended period, as well as with zero lag, which indicates a search for fresh information about work in Russia just before departure. The results obtained are consistent with similar findings of some foreign works (Wladyka, 2017; Wanner, 2021), by no means refuting the hypotheses of the study.
Modeling results and discussion
The study of correlation coefficients demonstrated approximately identical strength of the relationship between variables with different lags within the same country. But given the rather moderate values of these coefficients and in order to increase the overall stability of the models, the indicator of the monthly inflow of migrants (M) was also introduced into the number of explanatory regressors with lags. The search for optimal model specifications for each country was performed using a stepwise regression algorithm, the determining parameters being the value of the Akaike information criterion and the significance of coefficients on explanatory variables (calculations were performed using the RStudio application, the “MASS” package). Additionally, a variable backward elimination algorithm (leapBackward, the “caret” package) has been implemented, which, among other things, takes into account the accuracy of the predictions. The final set of specifications was determined based on theoretical assumptions about the signs at the coefficients; the value of the mean absolute error (MAE), the significance of the coefficients, and other indicators of model quality were also taken into account (Tab. 2).
The resulting models create preconditions for confirming the main hypothesis of the study: the dynamics of migrant arrivals show a positive correlation with changes in the number of requests related to the search of Central Asian residents for
Table 2. Models forecasting the inflow of migrants
|
Country |
Kyrgyzstan |
Tajikistan |
Uzbekistan |
||
|
Specification |
C1 |
C2 |
C3 |
C4 |
C5 |
|
Constatnt |
930.11** (361.96) |
885.60** (345.57) |
1117.78** (499.29) |
181.12 (462.52) |
1477.41*** (516.70) |
|
∆ GT (–7) |
41.92** (16.99) |
19.571) (12.15) |
19.55* (10.17) |
||
|
∆ GT (–11) |
59.71*** (17.08) |
18.05** (7.65) |
|||
|
M (–1) |
-0.59*** (0.11) |
-0.64*** (0.11) |
-0.17** (0.08) |
-0. 56*** (0.10) |
-0.17** (0.07) |
|
M (–6) |
0.19* (0.10) |
-0.14* (0.07) |
|||
|
M (–9) |
0.37*** (0.10) |
0.42*** (0.10) |
0.41** (0.12) |
||
|
Number of observations |
59 |
59 |
59 |
59 |
59 |
|
Normalized R-square |
0.37 |
0.43 |
0.10 |
0.37 |
– |
|
R-square |
– |
– |
– |
– |
0.20 |
|
MAE |
477.6 |
446.2 |
609.4 |
539.8 |
– |
|
1) P < 0.12 Level of significance according to Student’s t-test: *p < 0.10; **p < 0.05; ***p < 0.01; standard error value in parentheses; lag value in the first column for variables in parentheses. Source: own compilation. |
|||||
work in the Russian Federation. The relationship is stronger for Uzbekistan and Kyrgyzstan, while in the case of Tajikistan it is the weakest. The magnitude of lags between the dependent and explanatory variables suggests that potential migrants prepare for their move in advance and look for places of employment in advance too.
At the same time, the constructed models have a relatively small percentage of the explained variance and a moderate mean absolute error. This may be due to several circumstances. First, combining data not only on labor but also on other categories of migrants in the dependent variable inherently reduces the accuracy of the model predicting labor migration, because different search images may be relevant to the queries of different categories of migrants.
Second, citizens of Russia and other countries account for a large proportion of migrants from Kyrgyzstan, Tajikistan, and Uzbekistan: about 23%, 33%, and 28%, respectively, of those arriving in 2018 from these countries12. These migrants may have different online search behavior patterns, and their higher percentage in the flow from Tajikistan probably weakened the link between specific queries and flows, which is consistent with the results obtained abroad.
Third, as we know from foreign studies, the low level of Internet connectivity can distort the links between requests and flows. According to materials presented on the site DataReportal, at the beginning of 2021, the Internet audience included 50.4% of all residents of Kyrgyzstan, 34.5% of Tajikistan, and 55.2% of Uzbekistan, which is below the global average13. Although Central Asian residents aged 20–34 make up an increased share both of those arriving in Russia and of Internet users, a deformation in the representativeness of the latter in relation to potential migrants cannot be ruled out. The lowest level of Internet connectivity in Tajikistan compared to the other two Central Asian countries may be reflected in the least strong connection between the demands and flows of this state’s population.
Fourth, given the long history and recurrence of such trips, the need to search for information about migration online is reduced among migrants who have already been to Russia, as well as compatriots who receive information from them.
Fifth, as foreign experience shows, the statistics of requests made by migrants from countries with rare languages show weaker links with the flows from these states. The languages of Central Asia are also not widespread, and the population of the region seeks information about Russia in the Russian language. Considering that Russian is not a native language for migrants and they often speak it superficially with a generally low level of education, it is difficult for researchers to imagine what words a migrant would use to formulate a query. In 2020, only 14% of migrants over 14 years of age from Kyrgyzstan, 18% from Tajikistan, and 25% from Uzbekistan had higher and secondary vocational education14. Nevertheless, perhaps a more scrupulous validation of the search image by including stop words could enhance its predictive ability.
Sixth, perhaps using advanced and resourceintensive machine learning algorithms, particularly neural networks (Blazquez and Domenech, 2018), often used for complex analysis of large data sets, could provide more accurate results. Foreign migration authorities already use such methods for prognostic purposes15. Nevertheless, advanced artificial intelligence methods, due to their high technical resource intensity and the need for a significant amount of time for the training and regularization procedure, are sometimes less suitable than regression approaches for identifying the presence and nature of causal relationships that were established in the study.
Moreover, the obtained values of the average absolute error are relatively small in relation to the projected monthly change in flow volume. Thus, if we relate them to the average total number of migrants arriving in a month, the error will be within 10% for Tajikistan and Uzbekistan and 15% for Kyrgyzstan. Taking into account the “noisiness” of the dependent variable, such results seem quite acceptable.
Conclusion
In our study, we found a moderate correlation between changes in the number of online queries about migration to Russia from residents of Kyrgyzstan, Tajikistan, and Uzbekistan, and the dynamics of subsequent migration flows from there to Russia. We identified contextual factors that may have affected the relevance of search images and the accuracy of estimates of the relationship closeness: the composition of migrants by category, citizenship and level of education, their knowledge of the Russian language, the level of Internet connectivity in Central Asian countries. The results show that query statistics can be used as a predictor of migration to Russia from Central Asian countries, especially Tajikistan and Uzbekistan. The advantages of new ways of obtaining information about migrants on the basis of reading their digital footprint open up prospects for the integration of alternative data in the study and forecasting of migration processes and the use of such data in Russian migration policy.
This study can add to the experience of such migration forecasting by applying Yandex capabilities to validate search images, as well as the results obtained on materials previously not studied in this vein in the post-Soviet region.
References Nowcasting migration using statistics of online queries
- Acostamadiedo E. et al. (2020). Assessing Immigration Scenarios for the European Union in 2030 – Relevant, Realistic and Reliable? Geneva: IOM and e Hague: NIDI.
- Albertinelli A. et al. (2020). Forecasting asylum-related migration to the European Union, and bridging the gap between evidence and policy. Migration Policy Practice, X(4), 35–41.
- Beduschi A. (2018). The big data of international migration: Opportunities and challenges for states under international human rights law. Georgetown Journal of International Law, 49, 982–1017.
- Bengtsson L. et al. (2011). Improved response to disasters and outbreaks by tracking population movements with mobile phone network data: A postearthquake geospatial study in Haiti. PLoS Med, 8(8), e1001083.
- Bijak J. (2016). Migration forecasting: Beyond the limits of uncertainty. IOM’s GMDAC Data Briefing Series, 6, 7. Available at: gmdac.iom.int/gmdac-databriefing-migration-forecasting-beyondlimits-uncertainty
- Bijak J., Czaika M. (2020). Assessing Uncertain Migration Futures: A Typology of the Unknown. QuantMig Project Deliverable D1.1. University of Southampton and Danube University Krems. Available at https://www.quantmig.eu/res/files/QuantMig%20D1.1%20Uncertain%20Migration%20Futures%20V1.1%2030Jun2020.pdf
- Bijak J., Czaika M. (2020). Black swans and grey rhinos: Migration policy under uncertainty. Migration Policy Practice, 2020, X(4), 14–18. Available at: https://publications.iom.int/books/migration-policy-practice-vol-x-number-4-september-december-2020
- Blazquez D., Domenech J. (2018). Big data sources and methods for social and economic analyses. Technological Forecasting and Social Change, 130, 99–113.
- Bohme M. et al. (2020). Searching for a better life: Predicting international migration with online search keywords. Journal of Development Economics, 142, 14. DOI:10.1016/j.jdeveco.2019.04.002
- Carammia M., Dumont J. (2018) Can we anticipate future migration flows? OECD/EASO Migration Policy Debate, 16, 9.
- Carling J. (2017). How does migration arise? In: McAuliffe M., Klein Solomon M. (Conveners) Ideas to Inform International Cooperation on Safe, Orderly and Regular Migration. Geneva: IOM, 19–26.
- Choi H., Varian H. (2012). Predicting the present with Google Trends. Predicting. The Economic Record, 88 (June), 2–9. DOI: 10.1111/j.1475-4932.2012.00809.x
- Chudinovskikh O.S., Stepanova A.V. (2020). On the quality of the federal statistical observation of migration processes. Demograficheskoe obozrenie=Demographic Review, 7(1), 54–82 (in Russian).
- Connor P. (2017). The Digital Footprint of Europe’s Refugees. Pew Research Center. Available at: https://www.pewresearch.org/global/wp-content/uploads/sites/2/2017/06/Pew-Research-Center_Digital-Footprint-of-Europes-Refugees_Full-Report_06.08.2017.pdf
- Hawelka B. et al. (2014). Geo-located Twitter was proxy for global mobility patterns. Cartography and Geographic Information Science, 41(3), 260–271.
- Lifshits M.L. (2016). Forecasting of the global migration situation based on the analysis of net migration in the countries. Prikladnaya ekonometrika=Applied Econometrics, 41, 96–122 (in Russian).
- Malysheva D.B. (2017). Migration processes in Central Asian countries. In: A.B. Krylov (Ed.) Postsovetskie gosudarstva: 25 let nezavisimogo razvitiya. T. 1 [Post-Soviet States: 25 years of Independent Development. Vol. 1]. Moscow: IMEMO RAS.
- Rango M. (2015). How big data can help migrants, World Economic Forum, 2 (October 5, 2015), Available at: https://www.weforum.org/agenda/2015/10/how-big-data-can-help-migrants/
- Sîrbu A. et al. (2021). Human migration: The big data perspective. International Journal of Data Science and Analytics, 11, 341–360. DOI: 10.1007/s41060-020-00213-5
- Sohst R. et al. (2020). The Future of Migration to Europe: A Systematic Review of the Literature on Migration Scenarios and Forecasts. Geneva: IOM and Hague: NIDI.
- Sohst R., Tjaden J. (2020). Forecasting migration: A policy guide to common approaches and models. Migration Policy Practice, 4, 8–13.
- Spyratos S. et al. (2019). Quantifying international human mobility patterns using Facebook Network data. PLoS One, 14(10), e0224134. https://doi.org/10.1371/journal.pone.0224134
- Stewart I. et al. (2019). Rock, rap, or reggaeton? Assessing mexican immigrants’ cultural assimilation using Facebook data. In: WWW ‘19. NY: Association for Computing Machinery, 3258–3264. DOI: 10.1145/3308558.3313409
- Struijs P. et al. (2014). Official statistics and big data. Big Data & Society, April–June, 1–6. DOI: 10.1177/2053951714538417
- Szczepanikova A., Van Criekinge T. (2018). The Future of Migration in the European Union: Future Scenarios and Tools to Stimulate Forward-Looking Discussions. Luxembourg: Publications Office of the European Union. DOI: 10.2760/000622
- Tjaden J. et al. (2021). Tale of high expectations, promising results and a long road ahead. Available at: https://medium.com/@UNmigration/using-big-data-to-forecast-migration-8c8e64703559
- Tjaden J., Auer D., Laczko F. (2019). Linking migration intentions with flows: Evidence and potential use. International Migration, 57(1), 36–57. DOI: 10.1111/imig.12502
- Tkachenko A.A., Ginoyan A.B. (2018). Evaluation of the migration potential of the CIS countries based on the model of international migration. Voprosy Statistiki, 25(11), 46–56 (in Russian).
- Wanner P. (2021). How well can we estimate immigration trends using Google data? Quality & Quantity, 55, 1181–1202. DOI: 10.1007/s11135-020-01047-w
- Wilson T. (2017). Can international migration forecasting be improved? The case of Australia. Migration Letters, 14(2), 285–299. DOI: 10.33182/ml.v14i2.333
- Wladyka D. (2017). Queries to google search as predictors of migration flows from Latin America to Spain. Journal of Population and Social Studies, 2017, 25(4), 312–327. DOI: 10.25133/JPSSv25n4.002
- Yurevich M.A. (2021). Inflation expectations and inflation: Nowcasting and forecasting. Journal of Economic Regulation, 12(2), 22–35 (in Russian).
- Yurevich M.A., Ekimova N.A., Balatskii E.V. (2020). Digital transformation of economics. Informatsionnoe obshchestvo=Information Society, 2, 39–47 (in Russian).
- Zagheni E., Weber I. (2012). You are where you e-mail: Using e-mail data to estimate international migration rates. In: WebSci ‘12: Proceedings of the 4th Annual ACM Web Science Conference. New York: Association for Computing Machinery, 348–351. DOI: 10.1145/2380718.2380764
- Zagheni E., Weber I., Gummadi K. (2017). Leveraging Facebook’s advertising platform to monitor stocks of migrants. Population and Development Review, 43, 721–734. https://doi.org/10.1111/padr.12102
